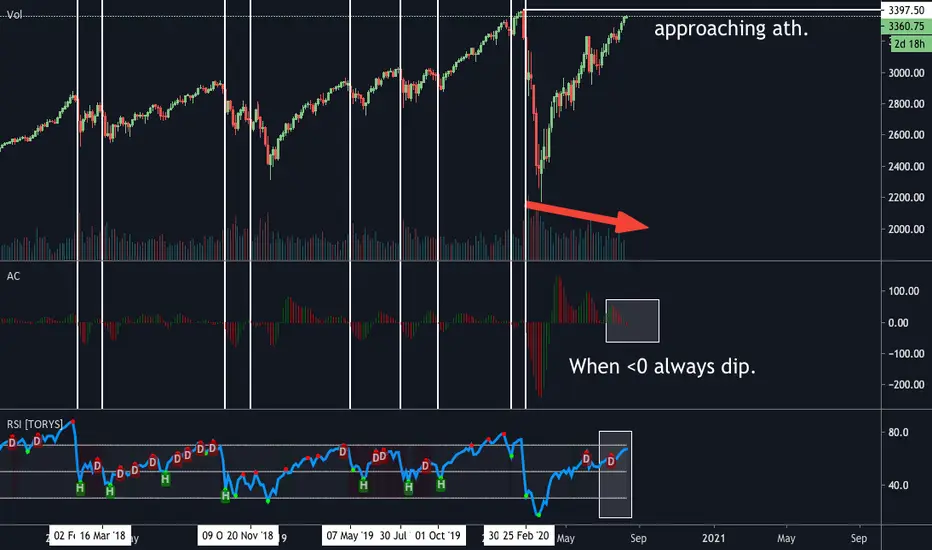
S&P 500 is not looking good up there! Let's have a look everyoneSo S&P 500 is not looking good on the weekly chart right now.
We got a bull run in 2020 up until 3600 and closed the candle with a long wick, which is bearish in my dictionary.
So if we start to correct right now, let's check the trend.
The Trend is broken by this week. It was not healthy as you can see. What says the indicators?
RSI is since 2018 in a bearish divergence to the actual price.
Macd is also interesting, we are days before a bearish crossing of both lines and as we all know, when the cross happens, the price is already down, so we must see in our crystal balls.
I also got for today my lovely Market Bottom Finder. As you can see the green shows the market on a volatility low end and you can see also macd and rsi showing the same things. A nice indicator to harden your buying intention. So as of now the indicators shows us low volatility, which means we are sitting at a beginning of a wonderful roller coaster.
Are you ready for the action? : )
_________________________
Disclaimer
In the context of this website and our advice, neither investment recommendations nor financial services in the sense of the legal provisions are provided. The purpose and content of these consultations are to provide the adviser with information and thus to be able to make decisions independently and without outside help. If a business registration is necessary, it will be carried out by the adviser himself. He is also responsible for the taxation of his profits. No liability is assumed in this regard.
Sp500short

Tesla Falls After Stock Sales And S&P500 RejectionAs says Investing catalyst for the liquidation is largely Tesla shares, which plunged more than 13% after saying it completed the sale of $ 5 billion in common stock on Friday.
The stock price was also under pressure with Standard & Poor’s announcement on Friday that it would not be listed on the S&P 500 index for the time being. The announcement disappointed hopes that the passively managed money tracking the S&P 500 would be forced to buy the shares of Elon Musk's company to fulfill its investment mandates.
If Tesla opens at its current level, it would be about 25% below its historical record at the beginning of the month, but still about 30% above where it was when the wave of speculation about the inclusion of the S&P 500 started.

SP500 (Y20.P4.E1).Still bullish but a correction taking placeHi All,
This is a continuation of my previous post which discussed the correction that is likely to happen soon, now we have it.
I'm still sticking to my original thoughts that this price action will move towards the average of this channel and in this case we have:
a) support at the previous resistance;
b) confluence with the daily 21/34 ema;
c) channel bottom or trend line which shows we have 2, depicting a deviation of 1 and 2 of the channel. Price was over extended represented from the deviation of 1;
d) fib. level at a number of levels;
e) indicators still show downward pressure on the 8 hr and daily;
My interest with the SP500 and Gold is from a crypto perspective, as they have direct correlation, with crypto being more volatile, better opportunities in terms of % gains.
A few days ago, I saw it coming with that bearish candle on the 4 hrly followed by more;
Today's chart on the 4 hrly;
Regards,
S.Sari
BTC CHART
PREVIOUS POST

ES - Expected Price ActionThis is what i am expecting to see. This is the daily chart and i think this can go up to end of September. However, if it doesn't work until mid Sept, then we need to update the trend.
My ES target is $2500 but it's up to economy and covid.
This is not a financial or investment advice.

SP500 get ready for Deflation Strong dollar is comming off and Big Bubble at the markets at the moment getting ready for a recession, february wasnt the true recession as many think we still need another deflation move before inflation truly begins, market is not healthy when its moving up without any wave down or pullback
Watch price action on lower timeframes to short it after a retest~
Good luck

Pre-elections trading. ExplainedSP500 broke to the new highs. Volume is still very low and the Advance Decline Line doesn’t support this rise too. It is bearish. However, there is still a lot of momentum in this market. Likely we will see choppy trading with upside bias till the middle of September followed by a decline till the end of the month. Pay attention we are getting close to elections. With that in mind, I believe that pullback (if any) will be bought very fast. Besides, the Fed Funds forecast signals a rally coming at the end of September. The best thing we can do now is intraday trading. There is a chance for a swing trade, but only in a month from now.

Market moves down for 2 weeksWith fresh stock splits, tightening election polls, eviction madness about to start, more schools open, the Fed, Congressional inaction, COVID positivity rates ready to climb, and maybe football, The first 2 weeks in September will bump lower.
I am not using those events to justify the analysis but the catalyst could be in there somewhere. I am using enhanced Elliott Wave analysis for the following modeling and projections.
Intermediate wave 3 was strong, but was set to end. Initial forecast was for it to last around 42 days, it made it to 43 on Friday.
Intermediate wave 4 should last around 7-13 trading days. My specific target is 10.1 days based on my models. Wave A typically lasts 39% of the the overall length of the larger wave (Intermediate wave 4). Wave B typically lasts 25%, and wave C is 37%.
The price drop could be greater than 225 points, but my specific forecast is a drop to around 3310 or 199.23 points from the ATH. Wave A typically moves 74.5% of the overall drop. Wave B typically gains 45% points of the overall drop and wave C drops about 67%.
All told. I have wave A lasting about 3.9 days and dropping 149 points. Wave B could gain for 2.5 days and claw back 90 points before wave C drops 134 points over 3.7 days.
I have placed all of this on a 2 hour chart in order to track the movement better.
I am overall long for now, but will be short through September 11, 2020.


sell at 3449 with 3 tp within 48hsell #sp500 at 3449 with 3 tp within 48h ,so much overbough and #jacksonhole #symposium coming also there a bit euphoria with #china #tradedeal while it should be sell the rumour and #spx500 overperform #nasdaq #DowJones #usdjpy #eurusd #audusd #audjpy #uscad #xauusd #nzdusd
also it can bed much more down make 2 separate lot and take profit on the first at tp 2 as exemple and let run the other with a manual trailing stop,like every 10 pts you down your stop wich you placed a bit down from the entry point for secure gain and no lost

Short Signal TriggeredIt is my believe that TSLA is going to drop around 10% to a price of $1800 +/-20.
This is due to the bearish signal that is being generated today by the RSI (14 days ) which is clearly developing a bearish divergence and by the bearish candle formation that has been drawn in the last 3 days.
My intention is to open a short position and set a TGT1 around $1850 and observe the price action then I will place a SL around 2065.

S&P500 Monthly- Long term chart. Bearish RSI divergence, 1600??S&P500 Monthly- Long term chart. Bearish RSI divergence. 1600 worse case target.

SP500 / SPY / DUMP INCOMING1. testing ath
2. rsi divergence (dump)
3. volume + acceleration declining
4. bitcoin will drop most likely aswell, since those two pairs are correlated (Btc couldnt pass ath today)
sell 3189 and 4 tp step by stepsell 3189 and 4 tp step by step
as all time with 2 lot
1st lot will close at tp 2
2nd lot will let run and make his stop at the tp 1

FED Funds indicate big move is coming this autumnChoppy trading in SP500 continues. All declines were bought back quickly last week. It seems to be positive. However… Advance Decline Line doesn’t support this. It is negative in a short-term perspective. Based on cycle studies we can expect to get buy signal around 10 – 15 August. Till that time we will likely see more choppiness with a bias to the downside. I don’t think we are entering another wave of huge sell-off. We had a nice rally in this market and decline is just a normal pullback. GDP showed a big decline last week, but it turned to be positive for stocks as Powell said FED will do all to support the market. We have an interesting forecast based on FED Funds – a huge rally is coming at the end of September. Recent 2 years FED Funds has been one of the best indicators for swing traders. Let us see how it turns this time. For now, I keep focusing on very short-term trades.


Get this #DJI-FAILED_MONEYPRINTSmart money shorts this bitch. It's over, gone, ended, finished. fcuk 'er bud!

negative RSI divergence S&P500 dailyRSI divergence is a very accurate leading indicator imo, does not look good for the price action here.
This is not financial advice

sell at 10854 and tp under 10000sell at 10854 and tp under 10000
do with 2 lot
first lot cut in half of target like 10480
lot 2 made a stop loss at 10600 as exemple when he reach less than 10500
if you see the volatily very high coupled with a bed news.u can go down than 9950..just do a traling stop manulally

SPY: Elliot wave analysis: Big week ahead!Analyzing 4 HR chart of SPY: Counting the waves in a shorter timeframe makes it pretty clear that SPY has completed 5 impulse waves and is currently going through the corrective phase. Huge divergence on most momentum indicators, volume, and fundamentals can make the corrective wave C an extended one. Currently projecting a drop to 0.38 fib level ( 283) or 0.5 fib level ( 271). We may get a retracement back to 306/308 before we resume move. Either way, we need to see a clean break of 297 print level before we see any downside. This week promises to be eventful so stay hedged and trade smartly.


COVID-19 Resurgence Scare - Bearish Flag Forming On 4h Chart!$SPY looking weak and with COVID-19 resurging and fears of future lockdowns. I think this calls for a pullback. This week all the way into next week.

SP500 Short IdeaSP500 started dropping below trendline. I think this is high for the day, I short here. I think I'm good to at least where I put TP.
Disclaimer, this is not trading or investing advice, just for entertainment and education.

S&P500 In TroubleGet out while you can and take some profits. This week was the last chance to make the case for a bullish breakout. Uneasy news of new coronavirus cases, riots, and slower than communicated recovery. At minimum a correction to 3000, then it might pop again but faily to break the trendline. Once that happens, it's a deterioration of market conditions and confidence in a new bull market. To me, this confirms a bear market rally. Look out below!
