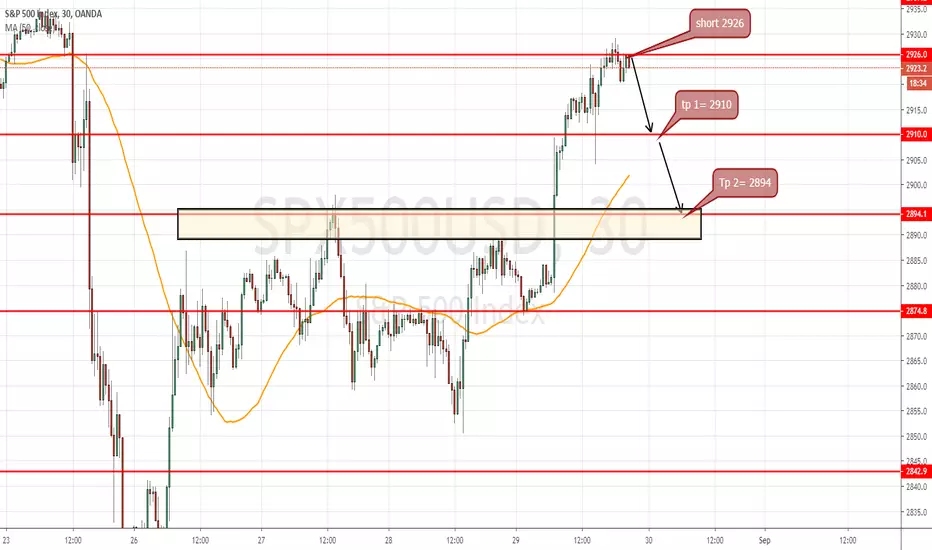
We can get negative news for the USA stock market. S&P500 shortToday, FED is starting to buy short debt papers. Today, the reporting season in the United States begins. The Chinese want to clarify the details in the trade deal. We can get negative news for the USA stock market. The price of the rise to the short zone. We count on achieving the goals.
There is no stop-loss, as there are possible shake out/
The position can be modified.
Sp500short

Bank Of America (BAC) Calm Before The StormBank Of America has been on a rise after the 2008 US Stock Market crash. No coincidence as many US companies have been rising since then. This is not an excuse to get off track and believe all is good now. If you take a look at the bigger picture, you can see this company has had a decline soo huge, even the attempts to pump the value back to pre-2008 figures has been failing. There is still much to go for the rise before this stock can become stable again. It will need to take a wild spike along with some sort of unimaginable great news to spike prices back up that high to over $54.00/share. With that being said, I will stick to my technical's and as of now it is bearish. The chart along with my own technical analysis should explain the rest to the crowd. Just be patient and avoid greed in these times of uncertainty. I am prepared to go long if price signals me to do so, but my overall bias is short.


Equities likely to continue down...Following the massive drop due to poor manufacturing data, equities have had a considerable relief rally... Most articles point to good employment numbers, but in my opinion this will not prevent an even deeper correction... It seems like news outlets are clinging to whatever data they can find that attempts to explain a sharp move in one direction or the other... I am not entirely sure of the wave count but I am confident we are in a corrective pattern that should extend to at least the length of the first wave (which I have marked as a wave A)... This leaves the green line as my next target (can extend much further but I plan on exiting at this level)... The red line is still my stop loss, passing this line would invalidate my idea and suggest further upside...
Still very bullish on crypto, I believe there should be one last push lower before back to bull...
I also bought some SLV December calls... precious metals should continue upwards but I do have conservative stop losses in place...

Equities likely to move lower...For reasons put out in my previous post (global tension based)... The sp500 should continue it's trek downwards... Currently up from my short entry and recently moved stop to red line... Considering entering a second position on a 3 wave corrective rally before harsher downside movement... Not entirely sure on the wave count at this point but the larger head and shoulders pattern is still in play... Targets are not clear but I could see 2920 as a good first exit for profit taking and possibly 2700 for longer term...
If you find value in my opinions or ideas, I encourage you to follow me!


#SP500, Will we have a confirmed Double Top template here?Upward trend.
Currently, the SP500 is in a Double Top pattern that can cause a trend change.
The Stochastic confirms the Double Top pattern by crossing its lines and positioning.
Target: 2830

S&P 500 BULL MARKET OVER?This chart would suggest we are very close to a complete and utter collapse in stocks. The rising bearish wedge pattern indicates when something is far overbought and usually corrects dramatically to the lower side, usually caused by some sort of catalyst. The Fed losing control of REPO may be that catalyst or may be just the start of something even more dramatic. Either way it's not looking good for stocks and it would be sensible to be reducing your position and possibly going short.

Monthly DivergenceSP500 trading at resistance zone and has given Monthly Divergence. It can make a new high but eventually it shall crash to psychological level 2000! SPX is on my watch list. Weekly and Monthly charts are not H4 or H1. Bigger time frames demand bigger patience.

S&P 500 INDEX - HEAD AND SHOULDERS PATTERN FORMING??The S&P 500 index has hit a lot of buy stops propelling it higher in recent days. However, is it just forming a head and shoulders pattern on the right shoulder? If you believe this market is overbought (refer stochastic) and overvalued (high PE), then, could a head and shoulders pattern present an ideal short position? You could sell now at the top of the right shoulder or wait for the neckline to break for confirmation. Trump has gone all quiet on trade, is this the calm before the next stormy tweet? Small caps are not confirming the recent rises in the S&P500 and Nasdaq100, a bearish sign. I think this right shoulder is a bull trap, sell into it with a close stop just in case it continues higher. This market has struggled to get above 3000 for a while now, I think it's ripe for a decent decline before this trade war and global slowdown is over.

Bearish for Monday on SPY 1 hour!!Couldn't break above long-term uptrend AGAIN, volume declining, RSI overbought, volume divergence since the gap up, and the gap needs to be filled (well, usually they do...).
Clearly the market was not overly impressed by the end of day on Friday. The entire day was flat, and .2 was shaven off SPY in the last few minutes of trading and it almost closed at 0 or just below.
I have an open SPY call that I hedged with TVIX. I think Monday will be red. Depending on the futures action tomorrow night, I may buy a vertical put spread as well. I will go short until the gap is filled, unless something drastic happens and it decides to keep going up.

SP500 - Bounced back from 2940 resistance and broke the supportOngoing US - China trade wars are still holding economies of the two countries and as major players these two have shown the effect of their poke-game in global markets.
SPX has started this year very optimistically showing newer records and higher-highs and still more higher points to come. Unbelievabale isn't it? Despite rumors of the US is one step away from an economic recession.
US Non-farm Payrolls and unemployment rates are at the 50yr lowest rate, however the economy has show some interesting numbers.
Such as:
- US-companies show the lowest net income
- Manufacturing PMI is showing weak performance of the last 2 years
- US quarterly growth is down by 2%
- US Bonds are still in the negative yields
All of the above display difficult times in the US and Global economy.
September, as a matter of fact, shows positive rates in exchanges, however upcoming Brexit may also turn markets upside down.
From the technical view the price has tested the 2940 resistance level and bounced back to test the 2826 to gain power and jump back, or will it?
Nevertheless upcoming supports for SP500 are 2850-2800, 2745 and 2700. If the FED approves another rate cut which Trump is eager to get, and there are improvements in US-China negotiations regarding the "trade war" they have conduceted, the SPX will hop to 3000 and higher. On other hands if all remains "as is" we shall see a regression of the trend and the price to test support after support and plummet to 2700, especially by the end of September.
Support 1 - 2850
Support 2 - 2800
Resistance 1 - 2940
Resistance 2 - 3000
Good luck everyone!
That was another market review from us, hope you enjoyed it! If you did, hit the like button.
Follow us to see more market overviews!

SP500 Channel play On the chart two possible scenarios for the SP500. Best bet is to short at this top side because it has the best R:R ratio and there was no close above the res. yet. Untill we see a close above it is just ping-pong inbetween these levels, but the EMA's are tightening which means a price will get squeezed.

S&P500 IN A BEAR FLAG - SHORT ITThe S&P500 index is currently in a bear flag. Indecision and uncertainty about Trump's trade war and overvaluation of US equities has caused this pattern to emerge. We are at the top of the bear flag, an ideal time to short or buy put options on the SPY or S&P500 futures. Recent optimism about a resolution to the trade war is unfounded. I don't think Trump and Xi will agree on forced technology transfer and open markets in China. Xi has too much to loose if he gives in to Trump's demands. Xi would prefer to keep stalling the negotiations until the next presidential election. China needs forced technology transfer from US companies. China has built an economy based on it and I don't think will agree to ending the arrangement. This market could trade inside the rectangle for a while yet before it breaks down to the downside. Short it at the top of the rectangle and hold and wait. A severe drop to the downside could happen at any time, maybe caused by a further increase in tariffs or economic conditions deteriorating confirming the inverted yield curve. The inverted yield curve has confirmed most recessions in the past and should be right again now. With Germany and the UK entering recessionary conditions, this could spill over into the US.
On a DCF valuation using 4.5% growth rate in earnings and 8.2% discount rate I get an S&P500 valuation of 2700. If a severe slowdown occurs, this DCF valuation could become lower. I think the S&P500 is overvalued now, further reason to stay short. On the Nasdaq, there are lots of companies selling for PE of 100 or more. Ripe for a drop in share price. You could also short the Nasdaq100 index.

short #sp500 at 2827 with 2 TP short termshort #sp500 at 2826 with 2 TP short term ,the indice is overbought if we read the #tradewars news nothing is bigger or change a lot,i just play a pullback before he go more up or down
when it will reach 2910 i will make a SL at 2920 and down it every 1$ for if he back up before my tp ,i still keep some gain and be safe
SP500 Cooking a vicious SELLIn my view SP500 is cooking a vicious selling opportunity, I am not in the trade yet as I was on a holiday and resting from the charts after an action-packed 8 months of trading...
I only trade one pattern and that is the Contraction pattern... one is cooking on the weekly SP500 chart and I fully expect a repeat of 1937 to start in September this year... so I am eagerly waiting and scouting this index for the next few weeks... when I enter you will know!
Price action has developed 3higher highs connected with a trend line and in reality, I should have entered on that 3rd high... but I missed it, so I am now heading into shorter time frames to locate the best possible entry

S&P 500 IS APPROACHING RESISTANCE AT 2972 - GET READY TO SHORTThe S&P 500 index may tick up a bit from here as Trump has tweeted that he's going to delay tariffs until Dec 19. However, the additional tariffs will still be applied to Chinese imports. We are in a reaction to the main downtrend. I think the market will climb up to fib retracement 0.764 and hit resistance at the prior low of the uptrend. Sell short at about 2972. The next down leg could be a sever move as all hope of a trade deal dissipate. On a DCF valuation, this market is way overvalued. Expect the next move down to be as sever as the first leg down. I don't expect any meaningful deal between US and China on trade. It is about forced technology transfer which Trump will never give in to. I suspect it will play out with higher tariffs being enforced and US companies exiting China for cheaper countries to manufacture. This down move has only just begun ...

SP500 - SPX - To Test Lower Fibonacci Levels - Recession AwaitsThe perfect storm, at exactly the wrong time.
- Trade war that keeps getting worse, no talks until September
- Fed rate cuts did nothing to help the problem
- China weakens their currency + adds to tariffs
- Gold reaches all time highs, moves higher as sign of recession looms
- Weak reportings from companies affected by trade war just now starting to come in,and will only get worse (Apple, Amazon, etc)
- Recession alarms going off in every single area
- All of this, right on top of an ascending narrowing wedge pattern, brewing since December 2018.
- Broken bear pattern with strong volume
- VIX broken narrowing descending wedge, bullish pattern with strong volume
Prediction:
SP500 will move higher to lower resistance line it broke out of on August 5th, 2019 of 2870-2885 (0.786 fibonacci) where it will be rejected and continue to move lower. First to 2690-2700 if it easily passes 2800, where it might also face resistance, and ultimately to 2500. If it stands here, possible bounce, if not, heading to 2200.
**Also a move to 2950 and rejection from same resistance line possible, this would complete head and shoulders pattern.
Market has been too good for too long. If it seems too good to be true with all of the negative stuff going on in this world, most likely it is. No reason for a bull market in the conditions we are in and have been in.. this move is long overdue.
Only way I see this recovering strongly is if Trump makes a deal in the trade war, and I think we all know how this has gone for months now. No one is backing down.

Where's the S&P headed?Someone once told me that the S&P is the "All-Star Team", many have opinions on it, but almost impossible to find anyone who could consistently predict where it's headed.
This chart shows the bearish case, which seems reasonable except that Many people are seeing it and the S&P doesnt follow what people think will happen. With volatility at current levels, it's best to short or day trade it as direction isn't clear at this point.
Bearish case:
1- Megaphone top
2- Broken trendline
3- much damage has been done to the uptrend
4- Bearish seasonality until beginning of October
5- Tariffs and china devaluing the Yuan
Bullish case:
1- still hasnt dropped and closed below 200 Day MA
2- All CB's easing >> "Dont fight the fed"
3- Shock events like the ones we had the past few days usually end with selling culmination followed by a melt up and fuel for a big rally, and we might just have had that on Monday, think of Brexit, China in Aug 2015, Elections night
4- at this point the worst seems to be priced in or almost
5- Earnings strong and expectations are low
6- Almost all "widely Known" bearish setups (like the megaphone now) fail
I'm currently neutral, let's see if 200 Day MA gets tested or if Bulls reclaim the 100 and 50 Day MA's
**If you're interested in joining a group of like-minded traders, send me a PM. This is NOT a subscription service, just bunch of average traders sharing insights in a FREE group

Short entry after NFPNFP could give us a bounce to enter a short position for a flash correction into early next week. Either way I will be looking to short Friday and anticipate the bottom by August 6 which is the same as my canceled entry from last week. After that bottom is confirmed, I will post long opportunities when they make sense. But the long entry could be as soon as mid-day on the 6th.
Note: a Trump tweet could change everything!


SP500 to 2822 then Re-test 3000While the SP500 was on track to re-test record highs through today and into tomorrow, Trump doing what Trump does best: rekindling the trade war for seemingly stock market manipulation.
It seems that we are no closer to any trade deal between USA-China, and this continued escalation will continue to wreck havoc on the global economy and eventually USA economic numbers. This will likely force further rate cuts down the road.
I suspect a very similar outcome to what we saw in late May; I am targeting a hard short to 2822 for SP500 before a re-test towards 3000. Trade policy, monetary policy, geopolitical and political issues will indicate at that time whether we fail to re-test 3000 or make new records.
Pro-tip: Long Gold/Silver/Proven Weed Stocks
- zSplit

This is a beautiful chat, We hava two chart, Broardening wedge and Ascending wedge.
Diamond Formation
www.forexstrategieswork.com
The diamond pattern is a rare pattern but when it occurs you can expect price reversal on the horizon. This is usually formed at the top end of the rally and as the name suggests the consolidation leads to a diamond shape pattern.
Broadening Formation or Broadening wedge
The broadening wedge is where prices consolidate and in the process form higher highs and lower lows, thus expanding the range. At the end of the consolidation, the broadening wedge pattern breaks by forming a lower high before price fall sharply. The broadening wedge pattern occurs in a bullish trend. Similar to a rising or falling wedge pattern, the broadening wedge pattern is formed by five reference points.
