SPX Short RoadmapBearish $SPX #ES_F roadmap to watch for if we continue to drop.
DONE Initial test of 200wma
DONE Bear market rally to lower high at resistance
Break of 200wma
Trendline bounce @ $2300
Backtest of 200wma
Panic sells to major support @ $1500-1600
Sp500short

SPX Weekly Candles Signal a Turn to Bottom of Channel!The S&P 500 has been in a bullish channel since 2009. The 200 day moving average has stayed within this range. Last week's rejection at the top of the channel paired with a bearish hammer signals a reversal. There is a potential for this to be a bear trap, so keep an eye on weekly closes.
A likely scenario is we revisit the top of the channel around 2840 and get slammed down to the 200 DMA. Re-evaluate your SPX shorts here, (2750). If the 200 DMA breaks down there is a chance we will fall to the bottom of the channel, (2440).
This is still a bullish trend. If we break below this channel the bear market will be confirmed.
This is not financial advice. Do your own research.
-Whistle

SPX SP 500 LONG But possible Trendchange to come
Hello to all who follow my charts.
Today has been an interesting day.
Of course, the S & P 500 was still long and continued up the long trendline
But today we experienced a reversal day and that always does not bode well for the respective trend direction.
The day started normally, then went much higher in the end but to go deeper from the market. A reversal just.
Often, such a reversal day announces a turnaround.
So please be careful with long positions currently.
We have to see tomorrow what happens.
If SP 500 continues to move up the trend line, negate the Reversel signal or begin to tip over the trend lines.
We will have to take a close look.
Currently, the long scenario is definitely at risk.
----------------
--This information is not a recommendation to buy or sell. It is to be used for educational purposes only .Alllways do your own research---
----------------

short at 2835 and tp around 2800 before FOMCshort #SP500 at 2835 and take profit around 2800 just 48h before #fomc also i notice many rsi divergence and all this move up is only speculation for me and at a time buyer will take them profit.
also all this move up is only speculation so before an FOMC as market exploited near already all the dovish comment and all thing to have a reason to go up...is dangerous to them to keep them position before an FOMC because not much thing can made them pulse up again...a probality to go more deep down more than 15 % in coming 1-2,3month is high but for now i play just a pullback as i think is a good timing to buyer to take them profit

SPX LONG S&P 500 Taken out The Resistance on Daily ViewHello to all who watch my charts.
Contrary to the opinion of many here is in my view S & P 500 a Long Setup.
As you can see we had it at the beginning of March
a short trend which I marked with the orange trend lines.
Now, however, the index has risen above all short resistance and has both major resistance levels
which I marked purple. In the near future no direct resistance is to be seen.
Next is at around 2870
That's why I see these Index in a long trend.
To be cautios here , its needed that SPX fall below
2800 and
2786
at end of day chart
If that wil happen the long setup is gone.
----------------
--This information is not a recommendation to buy or sell. It is to be used for educational purposes only .Alllways do your own research---
-----------------


ES FUTURO DEL MINI SP500 CORTOSResistencia clara entorno a los 2800 , con posible retroceso definido.


Pitchfork + Wave Channel 3DI discovered The wave channel 3D. It gives good short positions and allow for determining pitchfork 3rd point.
I will add to my short position if we go here.

S&P500 Short Trade - The next big shortI have tried multiple times to short the S&P500 this quarter with little success. 4hr & 1hr trendlines that were broken then appeared to be fake outs and the index just kept on climbing. Resistance zones held and then failed and it has been quite messy.
That being said, the power of R:R ratio always comes through and the higher it climbs... the more it has to fall.
This time we have the long term fibonacci 0.786 retracement zone and 2800/2810 resistance zone holding strong. There appears to be a change in direction bias on the 4hr and todays little pullback is providing a nice entry for a long term short position.
Target Profits:
$2600 first... the famous support/resistance zone
0.27 fib extension & support at $2100 after that.


Approaching speculative short top positionRedraw of my previous idea. Period to watch: now to 02.25.19.

sell at 2746 with 2 tp before end weekmuch overbought in short time
face biggest resistance
market euphori on shutdown and trade talks but nothing is done,is buy the rumour for now..so investor will surely take some rofit sonnest

S&P 500 Weekly Model shows Markets Bottom March 2020Tonight i ran my model on a weekly scale - just amazing results - the low is locked in for March 26 2020.
brschultz / markettimer777 / @brschultzgoldw1

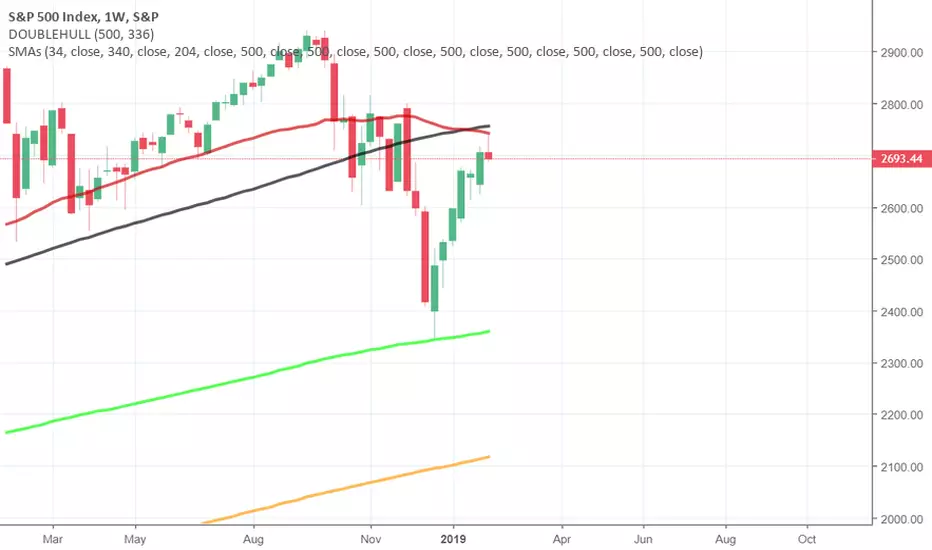
March 26 2020 Major Market Low en route perf tag 500 Double HullIt Now Begins as markets nailed 500 period Double Hull on weekly & daily basis ON THE SAME DAY!!!
AMAZING
brschultz / markettimer777

Losing steamThis has been forming a long and slow top, often making new unexpected highs.
The probability that this tumbles over becomes increasingly higher, but markets can always go on longer than we expect them to, so be carefull.
MACD about to cross, RSI relatively high (and losing steam), 200SMA as resistance (interesting level to keep watching)
red = 200 sma
orange = 100 sma
yellow = 50 sma
green = 20 sma
white = 21 ema

Indexes have crackedAs said, patience in key. If you missed shorting the top months ago and have been waiting for this rally to end, we have the crack! The 200 MA on daily was the obvious brick wall. On long term shorts, I always take profit at the Weekly 200 MA, as it's very powerful and aligns with Fib ratios frequently. For this rally, the weekly 0.95 Fib is last(medium term) target. The first 3 targets I have with X's by them. Stop loss would be 2740 to 2750. I do believe this is a generational short and it will go lower than the December correction, but only time will confirm that.


Weekly Momentum Model Puts Peak hereTesting my weekly model - SH weeklly shows a buy here so thus a peak in markets if testing goes as planned
brschultz


For My Earnings Model to Be Accurate S&P 500 MUST FAIL hereIf my model is going to be accurate in the majority of market directional changes then the S&P 500 must peak at the 340 daily SMA here.
