S&P500: Rocket Science! 🚀🚀🚀It IS rocket science when we are analyzing the S&P500 and where it is about to go, because this thing is literally a rocket! We expect it to rise to areas above 4549 points. After a small correction, we expect it to extend new all-time highs above 4620 points.
Happy weekend!
Sp500signals

SPX500 Short SetupSPX500 Short Setup
🔵 Entry Level: $4486.0
🟢 Take Profit: $4426.9 (1.28R)
⛔ Stop Loss: $4532.1
Reasons:
- Reaching resistance level at $4485
- Expecting either divergence or highly overbought level on the PVS Indicator by the time price reaches that level.
Game plan: If the price flips this resistance into support (tests it), I may close the trade prematurely and open a long trade until the next resistance level is reached at $4548

SP500 found strong supportWhat has started like a healthy and meaningful correction, has proven to be an anemic not even 10% drop for SP500.
The index found strong support at this moment in 4300 zone and as long as this area is intact we can see it challenge the all-time high in the next trading sessions.
I will look to buy dips in search of a good R:R for my trade

S&P500: Ready for Take-Off! 🛫🛫🛫The S&P500 has reached its low and is now ready for take-off. We expect the course to rise until the area around 4620 points. Alternatively, the course could turn around before 4549 points with a 35% chance.
Let’s go!

US500 1D: Possible SHORTUS500 1D: Possible SHORT
As we look at S&P500, we can see a possible fall from 4500 to 3400 in the coming months

S&P500 third consecutive triple DIV!Hi folks!
This - in addition to almost everything in financial markets ATM - is very scary reading.
S&P500 just flashed a third consecutive (i.e. uninterupted by an equivalent buy signal) Triple Divergence (RSI, MACD and Volume) since the covid-correction on the dialy. Usually, one such signal is a bad sign, but three consecutive ones is just madness.
Time to hand over the bags and buy volatility, short or just sit ut out completely - just everything else than being long the stock market.
For me, I have accumulated VIX futures (VIXY ETF) since the end of june at all times when it dipped under 16 to protect my long holdings. I sold almost all my other holdings late friday after the bounce - its just a terrible risk/reward ATM.
DYOR.
NFA.
Never take the word of others as a given - and never take advise from someone without skin in your game.

Is your money worth reading "maybe´s"Hello Trenders,
Been thinking a lot to or to not publish this signal. Many of you expect a deep on global level, therefore I here show you some mathematic forecast.
This may not be the end of the world, yet it is far worse than the most downbeat forecasts. The evidence to support this outlook is in plain
sight. Some sixth-grade math is a good place to begin the analysis. Make 2019 economic output 100 (the actual figure is $22 trillion; “100” is
100 percent of that number; a convenient way to measure ups and downs). Assume output drops 20 percent over the second and third
quarters of 2020 (many estimates project larger drops; 20 percent is a plausible if conservative estimate). A 20 percent drop for six months
equals a 10 percent drop for the full year, assuming the first and fourth quarters are flat on net. A 10 percent drop from 100 = 90 (or $2.2
trillion of lost output).
Since 1948, U.S. annual real growth in GDP has never exceeded 10 percent. Since 1984, real growth has never exceeded 5 percent. The
highest-growth years since the end of World War II were 8.7 percent in 1950, 8 percent in 1951, and 7.2 percent in 1984. An assumption
that real growth will occur in 2021 at a 6 percent annual rate is a generous if unrealistic assumption. Such growth would qualify as a Vshaped recovery.
If our new base is 90 (compared with 100 in 2019) and we increase output by 6 percent in 2021, this brings total output to 95.4. If we
enter 2022 with the new base of 95.4 and increase that base by 4 percent (so, 95.4 × 1.04), we come to 99.2 in total output by the end of
2022. Here’s the problem. Using 100 as a baseline for 2019 output, and assuming 6 percent real growth in 2021 and 4 percent in 2022 (rates
of growth that have not happened on an annual basis since 1984), the economy does not get back to 2019 output levels. The hard truth is
that 99.2 < 100.
Source : The new great depression (2021).
What about if we really have a second wave harder then the first with mutatied covid?
I want to add, is not my intention to spread panic or "maybe´s" but the study got my attention.
Even the legends will have trouble surviving if this happen.
So how can a trader survive in this case condition by trading as only source of income???
Perhaps agricultural commodities will always perform....

SP500: All-Time High! 🆕🆕🆕Another week, another all-time high for the S&P500 – and it does not stop there. We expect the course to further rise to levels above 4426 points. There, a correction should pull us down under the support line at 4353 points. In the mid-term, the course should rise to levels above 4547 points.
Bull, Bull Hooray!

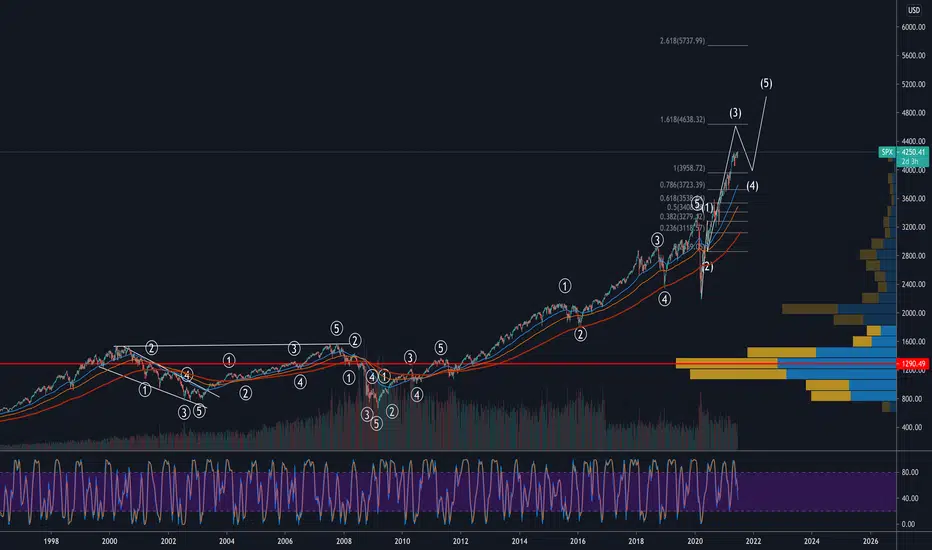
SP500Playing around with this count on the LT weekly chart from b4 2000 dot com bubble. SP500 looks like a very clean 5 up & 5 wave down pattern 1 after another. I am sure that if we dial down into the LTF we could find many complex Flat & zig zag corrections but zoomed out everything looks pretty clean.
The W3 that we are currently in lines up with 4600 rough target. I know a W4 is coming but the fib 1.618 lvl is really a better target for W3. So maybe SP500 continues up for now until 4600 and after that W4 will ensue. Hard to tell but I don't see W4 forming as of yet even with all the bearish inflation narratives.
Ponzi Factor Invisible. Hello Trenders and Volatility hunters.
Scanning hungry for results, I couldn´t belive my eyes when I saw SP500 Volatility Index.
This is unbelivable, the most easy and best ROI with security from Feds in the package included, in my best knowledge.
Here is hidden the "millionaire gentleman club" , wonderful.
I would appreciate every tip as a newbie.
The chart does not require any clarification, is a "no comment" one.
At this point I will say good luck but as you don´t need it I say BE HEALTHY.
M.M.M Make Motherfuc.in Money
Be wise: don´t work for the money, make your money work for you.

SP500 - SHORT; Nothing but Shorts (SELL!!) here!A ~25% decline from here should be rather quick and uneventful. However, such a decline is likely to be just the first leg on a long road to a full ~70% decline by the end of this full cycle. - Which would be nothing more than a garden variety return to the Historic Norm ! The same goes for all US Indexes and those who are historically informed (or reviewed the evidence, presented in virtually every single recent post) should not be surprised at all.
The Carry Trade Currencies - and equivalents relative to the VIX post;

SP500: Snoop Dogg! 🐕🦺🐕🦺🐕🦺We expect the SP500 to fly high like SnooP(500) Doggy Dogg and reach above 4238 (sorry not 420). There, a correction should set in which will bring us back below 4238 points. However, afterwards we expect the SP500 to rise again and reach new all-time highs.
Stay tuned!

SP500 Final Top??... Only SHORT Entries from here!!Expecting an initial -25% drop, then an additional -60%. (For a total of -70%, minimum - full cycle!)

Big move incoming in the coming weeksThe S&P 500 Vanguard Euronext is about to make a big move in the coming weeks. Target 62.4 euro (bottom of the wedge) in the bearish scenario and 68.5 euro in the bullish scenario.

You know(!!) you are in a bubble ...... When:
The funding a 36-year stream of expected inflation-adjusted spending requires over 38 years of money up-front;
Every single decile of S&P 500 components is at record valuation extremes; www.hussmanfunds.com
The amount of leverage in the system (U.S. equity markets) is now easily the highest in history, by any measure, not just in absolute terms! (relative to GDP, etc. Margin Debt/GDP = Margin Debt/Market Cap x Market Cap/GDP Showing insane over-valuation across the board!);
In a world where speculators now value the stock of bitcoin at one-fifth the value of the entire U.S. monetary base;
The current SPAC mania is identical to the South Sea Bubble in as much as: "Let them see not what they do!";
In an economy with $11 trillion in corporate debt at $58 trillion in equity market capitalization;
When U.S. Market Capitalization exceeds 263% of U.S. GDP (the norm, not the low, being 78%);
Anyway, this is likely a Double Top here.

SP500 - The Phantom Menace (Episode I)As can be seen in the graph, after the pandemic, it collected rapidly and it seems that it will continue the rising wedge movement to the end.
If the targets for the future will not be 4000+, we can see a very sharp decline as a result of the rising wedge formation from here. In this sense, it would not be wrong to expect the prices to fall back to 3000 levels due to the formation target. However, this 25% decrease would be a disaster for the financial markets.
The place to enter the game is as important as where and when we exit the game. It is useful to be careful, especially in light of these inflationary expectations. TVC:SPX
It contains only personal views and opinions. Does not contain legal investment advice ...

SP500 Lifetime OpportunityHi there,
SP500 at the moment is a clear buy with target above 4000
If we pay attention to the DXY chart, we are starting a uptrend but still on sideways moment, which SP500 due to many retails shorting it, has been making new highs every week, as long as dollar is weak it will keep doing it, but dollar is soon ending this sideways market to start an uptrend.
SP500 then will top at that moment
If we look at the elliot wave theory, we are in the final phase, Blow off, close to a top to begin then a new trend.
This is a long term view, if your looking to sell it, sell only at the mentioned wave 5, near it.
Good luck

SPX500 Short SetupSPX500 Short Setup
🔵 Entry: $3,885.0
🟢 TP & RR: $3,787.4 (1.91)
⛔ Stop Loss: $3,936.1
Trade Reasons:
✔️ Price bounced off the upper trendline
✔️ Price still ranging within the triangle
✔️ Somewhat overbought levels

S&P 500 Long PositionS&P 500 Long Position
🔵 Entry: $3,886.0
🟢 TP & RR: $3,929.1 (2.44)
⛔ Stop Loss: $3,868.3
REASONS FOR THE TRADE
✔️ Market Flow Green
✔️ Higher low on lower time frame
📝 I am expecting a small retracement upwards before price continues to go down. The second order I am looking to open is for a short at the $3,914.0 level.

SP500 - SHORT; Look for a Short Entry, right here!Like the title says...
... and the Nasdaq100
... and the NDX/US30 (Nadaq/Dow)
... and the Dow/Gold from this post;

S&P500 - The "Mayan Calendar" Chart Fearing an upcoming crash / correction I've been looking at all the key indexes etc, and this was one of my earlier explorations using Fibonacci.
I look at this chart with a large pinch of salt, more a fascinating oddity than something scientific (maybe!), but I do find all the correlations very interesting.
Ultimately this connects well with my Vix & Gold charts in regards to overall cycles so I do pay attention to this and it's progression.
Time will tell! Enjoy this "Mayan Calendar" chart as it was jestingly called on Twitter ;)

S&P500 2021 - Signs Of The Impending CorrectionThis is a another chart where I've look for clues in different ways this time on if / when a correction / crash may happen.
All correlating with what has been found previous imo.

S&P500 Long SetupSPX500 Long Setup
🔵 Entry: $3,911.9
🟢 TP & RR: $3,954.0 (2.48)
⛔ Stop Loss: $3,894.9
REASONS FOR THE TRADE
✔️ Market Flow Indicator went green
✔️ Trade in direction of the trend
📝 Not much to analyse here aside that it's a trade based on my system. With that being said the price may drop down to the support level, where I will be looking to open a long order again.
