Plug Power (PLUG): Recovery Play or Terminal Decline?Plug Power Inc. (PLUG) , a company focused on green hydrogen and fuel cell technologies, stands as one of the most emblematic examples of a boom and bust cycle in the speculative clean energy sector.
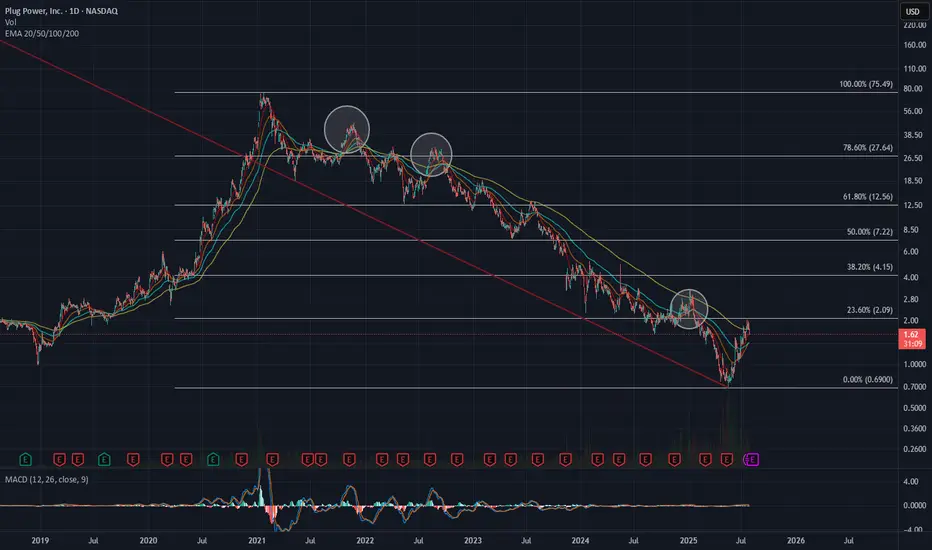
It reached an all-time high of USD 75.49 in January 2021 , driven by market enthusiasm over the energy transition. However, since then, the stock has collapsed by more than 99% , hitting a low of USD 0.69 on May 16, 2025 . It currently trades below USD 2, reflecting a massive loss in market capitalization and deep investor distrust.
🧮 Fundamental Analysis
1. Business Model
Plug Power develops integrated systems for the generation, storage, and distribution of green hydrogen, mainly targeting logistics, mobility, and high-energy industrial sectors.
2. Financial Issues
Persistent losses: the company has been unprofitable for years. In 2024, it posted a net loss of over USD 700 million.
High operating costs and poor efficiency in hydrogen project execution.
Accounting concerns: the SEC flagged accounting issues in 2021 and 2022, further damaging institutional confidence.
3. Capital Dilution
Plug has repeatedly financed its operations through equity offerings, significantly diluting shareholders. Recent rounds were issued at very low prices, worsening the drop in share value.
4. Cash Position
As of June 2025, the company requires new capital to continue operations, facing the risk of issuing more shares or convertible debt under unfavorable terms.
⚠️ Key Risks
Delisting risk if the stock doesn’t remain above USD 1.00 in the short term.
Bankruptcy risk (Chapter 11) if no strategic financing or partnerships are secured.
The green hydrogen sector is still not cost-competitive without subsidies, and competition is fierce (Air Liquide, Linde, Bloom Energy, etc.).
✅ Opportunities
Potential to secure strategic alliances with utilities, automakers, or industrial partners.
Ongoing green subsidies from the U.S. and EU may offer short-term support.
Much of the negative outlook seems already priced in: current market cap is around USD 1.8 billion, with physical assets and contracts still in place.
📉 Technical Analysis
From its all-time low of USD 0.69, PLUG staged a strong rebound, gaining +294% to reach USD 2.03 on July 21, 2025 . It now trades in a consolidation zone between the 23.6% (USD 1.71) and 38.2% (USD 1.52) Fibonacci retracements , which may act as short-term technical support.
This is a high-risk, high-volatility stock , capable of generating outsized returns — or total losses. Strict risk management is essential.
Repeated Rejections at the 200-EMA
The 200-day exponential moving average (EMA 200) has acted as a dynamic resistance throughout PLUG’s multi-year downtrend. Over the past three years, the stock has attempted to break above it on at least three occasions — in 2022, 2023, and 2025 — but failed each time.
The most recent attempt, in July 2025, ended with a reversal after reaching USD 2.10, which also coincides with the 23.6% Fibonacci retracement from the all-time high. Unless the stock breaks above the 200-EMA with strong volume and an ascending price structure, the bearish trend remains intact.
🧠 Speculative Position
We are currently positioned with a bullish options strategy targeting a speculative upside:
📈 Buy CALL USD 2.00 (exp. January 16, 2026)
🛡️ Sell CALL USD 5.00 (same expiration)
→ This forms a Bull Call Spread, limiting downside risk while maintaining a favorable risk/reward ratio.
🧾 Conclusion
Plug Power is no longer a fundamentally sound investment , but rather a high-risk speculative play , comparable to a synthetic long-term call option . If the company survives, restructures its balance sheet, and secures strategic partners, the upside could be substantial — but the risk of total capital loss remains very real .
🧭 Suitable only for experienced traders with speculative capital and disciplined technical execution.
Speculation
MVST, beginning of the new lithum hype? With ongoing US-China trade war, one of the key issues resides on lithium battery technology . Lithium technology is brought up as a national security concern . This is a tailwind for the industry .
Now let's get to the technicals.
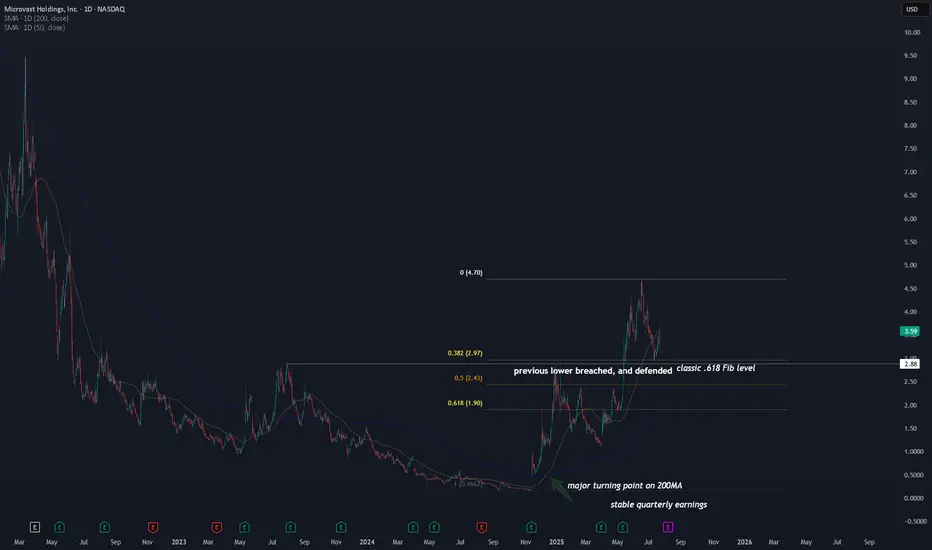
A major turning point on the 200MA . We haven't seen this happening since Dec 2020, when the stock first went public.
$3.00 key level is tested three times . This is not just a .618 Fib level, but the previous cycle high in 2023.
First test happened during Dec 2024, which it failed. Second time we saw the stock blew through this key level on May 2025. Lastly we saw a solid defense on this level on July 2025. If this level were to hold, the upside can be very high .
In addition to the technical side, the company is generating $100M revenue with neutral/break-even earnings this year, up from $60-80M in 2023 and 204. A steady increase in revenue , while not losing much from earning perspective.
This places NASDAQ:MVST at a tipping point . All it needs is some tailwinds from the new geopolitical conflicts , and we will see either an increase in revenue (scale up) or an improvement in profitability. Or both. If that were to happen, MVST will skyrocket.
I am watching and monitoring this stock as right now, I am expecting to add MVST to my portfolio once I see further confirmation.
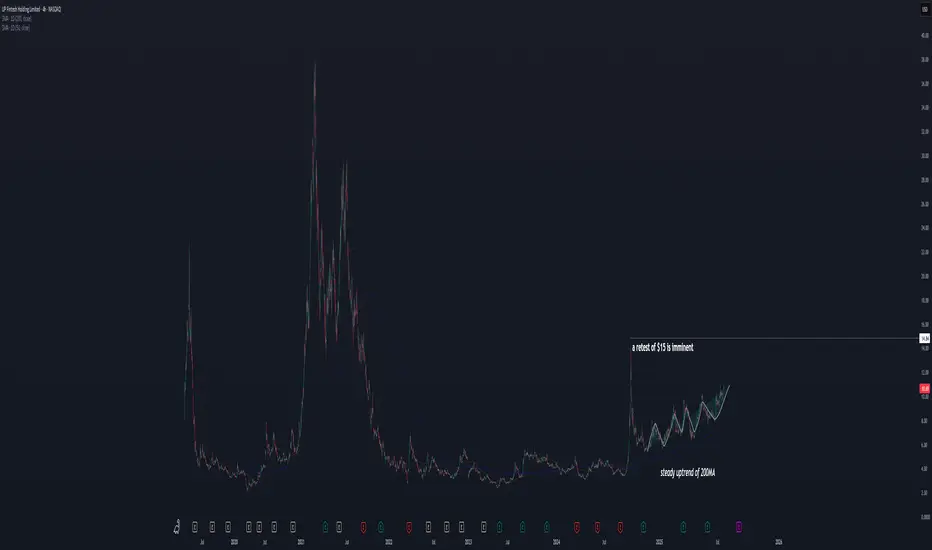
Next Robinhood? TIGR, a hidden gem.We all know the story about retail going crazy on $HOOD. But what about its SEA counterpart, TIGR? Will our SEA friends follow the same trend?
With more and more retail traders rushing to the stock market, TIGR is a safe grab to get on the retail frenzy.
This is also supported from a technical side:
1) a zigzag pattern trending up,
2) a slow and steady uptrend of the 200MA,
3) 3 consecutive earning beats during the last 3 quarters.
All these is suggesting that a retest of the previous high at $15 will happen very soon, if not more (I think there will be more upside, but I have to wait and see how patterns develop when the previous high will be tested).
I am holding TIGR I purchased at 9.55 with a 2.3% portfolio size, with the expectation of reaching at least $15 before/around Oct.
XCN Savvy?XCN is a speculative play, and in my opinion, speculative plays should never exceed more than 15% of your overall portfolio, as they can be very risky. That said, as far as speculative plays go, XCN is my top spec pick.
Good luck, and always use a stop-loss!

GOLD TODAYIf the price is approaching R1 (3089.73):This could suggest bullish momentum. You might consider entering a long position if the price breaks above R1, targeting R2 (3109.63) with a stop-loss near the pivot point.
If the price reverses near R1 and heads back toward P:This might indicate resistance at R1. In this case, a short position could be considered, aiming for S1 (3025.29) as the next key support level.
Volume analysis: I'd recommend checking the volume at these levels. Strong volume near resistance or support zones could confirm the price's direction.

$LCID will be catapulted to $4.3-5 range- This stock has been beaten down as it failed to reach the masses.
- However, the cars are impressive in terms of technology and looks.
- Tesla model 3 & Y looks ugly in front of stylish Lucid motor's cars.
- A big reason why Lucid might have a good run way to go higher is because of Saudi funding. They have invested billions in this company and would be investing more.
- Lucid cars were sold to Police department of Soudi to further support the lucid.
- Recently, lot of hedge funds like DE shaw, Citadel increased their position in the company.
- Can it go to double digits?
- Maybe if there is a short squeeze
- Would it go to $5?
- Yes, Charts indicate that it should test $5

BTC/USD - Bullish Order Flow Resuming [SWING TRADE]Hello,
Various sentimental analysis is building bullish order flow volume into this cryptocurrency. As seen on higher time frames, such as the monthly, we are bullish. Furthermore, weekly, and daily are bullish as well.
The two blue zones I have labeled are inactive weekly/daily demand zones. I say that these zones are inactive because price can touch this zone and pass right through.
If price touches either one of these zones and forms various higher highs and higher lows on a lower time frame, such as that of the 4H time frame; this will confirm that the weekly/daily zone has been activated.
Should this happen, I'll do further investigative analysis to pinpoint the entry that I'll be taken. Details coming soon.
As for the projection of where BTC/USD could be trading at in the next few weeks? Quite difficult to speculate, however, at the moment it appears as though bullish order flow volume is favoring the bulls rather than the bears. Lets choose to run with that stampede rather than against it.
More updates coming soon. Best of luck to the remaining experienced traders, inexperienced traders, get ready for a long journey.
Regards,
Authors

Topping Pattern Ahead of Earnings: AAPLNASDAQ:AAPL needs to have a great earnings report on August 1st but it has a topping formation at the moment, after huge speculation from promoting something that is not yet proven to increase sales. You can't take hope to the bank. Speculation occurred as investors assumed that AI would sell more new iPhones in droves. This earnings report will reveal reality one way or another.
There is a negative divergence between the price trend and accumulation/distribution suggesting there may have been quiet rotation against the retail speculation.

Is USD/JPY Trade of Decade? US Dollar Nears 34-Year High Again.If you’re a ‘90s baby, the yen is the weakest you’ve ever seen it. Putting it back with the cool guys in forex town isn’t going to be easy. In this Idea, we discover why.
Yen Languishes in 34-Year Lows
The Japanese yen is trading at a 34-year low against the stronger US dollar. This means that the volatile USD/JPY pair is flying high. Very high. To many, this is the opportunity of a lifetime — pop a short, load up on the leverage and go for the jugular (to use Soros slang ). Only that it’s not as easy as it looks.
So not-easy that there’s even a term for that. It’s called “widow maker trade” and it describes those unfortunate souls who dare to bet against the Bank of Japan in hopes of anticipating the right direction. It’s so difficult to predict the path of Japan’s interest rates that many have seen their fortunes wiped out in trying to do so.
So why’s the yen so badly hurt? Until recently, Japan’s central bank was the only one in the world to flaunt negative interest rates. It was holding on to an easy-money regime to stimulate economic growth — low to negative rates encourage businesses and consumers to borrow cheap money and spend it on whatever they want.
Biggest Loser on Forex Board
But this loose money policy has a downside — it makes the local currency highly unattractive. The Japanese yen is the biggest loser among the major currencies on the forex board so far in 2024. It’s down more than 13% against the dollar this year.
Against that backdrop, in March, the Bank of Japan abandoned its negative rate regime and hiked interest rates for the first time since 2007. The shift provided little relief to the yen.
The USD/JPY this week blasted beyond ¥159 and extended its winning streak to seven days in a row. But bulls’ efforts to carry the exchange rate above the ¥160 milestone might meet an archnemesis.
Japanese officials have been monitoring the speculative moves around the yen and have said many times they’re ready to intervene by buying boatloads of it. Traders, however, have already seen this play out. And they've seen the aftermath, too.
A Failed InterYention
In late April, the Japanese yen tumbled beyond the key ¥160 level to the dollar, hitting ¥160.20 — a low last seen in 1990. Japan then decided to lean against the skyrocketing dollar and sank as much as $60 billion going long the yen and shorting the dollar.
Briefly, the yen rose about 5% before bargain-hungry traders were back for more.
Moral of the story? The downturn of the yen is predictable and until the Bank of Japan introduces a more aggressive policy to buck the trend, it may remain vulnerable to attacks.
More of the Same?
Meanwhile, bullish traders are excited to try their hand at shooting the dollar-yen pair to a fresh 34-year high. It must be noted, however, that the exchange rate is overstretched and overbought. This skews the risk-reward ratio and makes the upside look fairly limited, at least in the short term. Or does it?
Zoom out, and you’ll see the yen was trading at ¥300 to the dollar back in the ‘70s. And that’s not something Japan wants to see now. A cheap yen is generally good for exports but it makes imports a lot more expensive. And that’s where the Asian economy is getting its technology, energy, cars, and many foods from.
Japanese officials, namely the Ministry of Finance, remain tight-lipped about any potential intervention. What’s more, the Bank of Japan joins the silence with no forward-looking guidance on future interest rate hikes.
And all this means one thing — yen volatility is bound to continue as traders engage in some extra spicy speculation fundamental price discovery.
Long or Short?
If you’re in the trade, which side are you on? Are you long the dollar-yen or short it? Let us know in the comments below!

BASED PEPE-BRETT-TRUMP-WEIRDO-PEPE0x69-ETC - Today and BeyondBASED MEME COIN SUPERTHREAD
Im gonna Start trying to Follow some hardliners and some new one's
Speculate the Speculators and do some Trend Analysis as Well as Fundamentals
The Based MEME Coin space is literally a Wild West and you can get Wrecked playing fast and loose
BRETT has been a darling of the space with a whole host of Support coins and is popular on many DEX's providing price speculation leaving profit for scalpers

Oracle (ORCL): Bearish Scenario with Long-Term PotentialSince our last analysis of Oracle on the daily chart, there has been little significant change. The stock moved into our Wave (B) zone between $128 and $138, and after reaching a high of $132.77, it was rejected. A trendline was broken but quickly reclaimed, suggesting a potential push upward.
We anticipate Wave 3, the subordinate wave, to find support around $91 to $86. Currently, everything indicates a falling trend, and unless the price rises above the recent high of $132.77, we expect continued downward movement.
However, our primary scenario remains bearish, expecting a further sell-off down to the range between $80 and $50. This range is broad but suitable for long-term entries. We see no issue with the size of this target zone, as it offers good long-term potential.

Meta Platforms (META): Ready for a Correction?We initially set our maximum target at $510, and the price climbed to $531—a difference of only about 4%, which is quite close given the magnitude. We're satisfied with our analysis so far and want to stay within this timeframe.
While it's possible that Waves 3 and 4 haven't fully played out yet, we need to consider that Wave 5 in Meta often tends to be longer. This historical pattern suggests that the current Wave 5 might have extended similarly.
If Waves 5 and (1) are not yet complete, we would need to see the price rise significantly, surpassing $575. Such a move would indicate that the bullish cycle isn't finished, and we might see a further upward spike before a deeper correction.
However, the RSI shows a bearish divergence: lower lows on the RSI while the price chart shows higher lows. This divergence is typically a bearish signal and shouldn't be ignored, as it often leads to price corrections.
Even though we have closed the gap, we believe that a further decline is possible, potentially down to around $384 to complete Wave A. An ideal entry zone for us would be around $306, with a worst-case scenario down to $181. This analysis takes into account both historical price patterns and current indicators to inform our strategy moving forward. Keep in mind even though META seems to be a huge organisation we have seen some bigger pullbacks in the past.

BTC Long, possible path to 100k if bulls step in fast and hardBTC has a chance to reach ~100k if it can get above the previous ATH of ~74k considering the recent uptrend and interest since the 57k bottom forming a higher high.
Otherwise, if BTC gets under 65k, it will likely continue its range until Aug and form another pivot. More so, if it closes under 62k on a daily candle. It'll bring consideration of reaching 45k if we close under 57k.
In the event of hyperinflation or BTC exceeding 110k, I suspect it to max out at 145k, 195k, or 235k. 30k-35k is roughly the capitulation zone/hard bottom in a worst-case scenario to where it begins to compromise the network for this cycle.
Note that current prices above 65k are met with extreme resistance for good reason if you're looking at the right charts surrounding liquidity/fair value, pointing toward a cycle top or at least a mid-cycle top similar to 2019. Also, the market shifted bullish at the 70k top on May 20th, so there is consideration for a correction. BTC wouldn't be abnormal to trade as a ranging asset considering how fund managers will likely rebalance/offset risk with the near 100% returns since the ETF's inception. By ranging, I mean both, 74k-57k until Aug, and 74k-30k until EOY. Early June may present itself as an unexpected downward move. Not sure of its strength, guessing -8-10%. Be weary of more geopolitical events affecting price in the coming months.
Overall, the BTC is neutral/bullish in the short term if it can hold 65k and overtake 74k, giving the chance of reaching 100k by Aug. Bearish long term while it is under 75k, vulnerable to ranging to 57k until Aug, or even worse to a low of 35k or 45k through the rest of the year. However, its more probable that the short term neutral/bullish case takes place at current prices and conditions as of when this idea is published.
Long at 67.5k
tp 76k, 85k, 94k, 106k (likely close here)
sl 62.5k
Long at 60k (if prev long got stopped out and we do range) - expires by early Aug if not filled
same tps
sl 55k
Long at 46k
same tps
sl 40k

BTC 2024 BULL RUN SPECULATIONI am expecting something like this to play out (ceteris paribus). Pure speculation however the data is based on previous cycles. Expected blow off top between $140 - $160k with a potential bear market bottom in late 2025 at between approx. $30 - $40k. Further accumulated between the range then ready for a next cycle in 2027-28

Speculation to correction risk: COSTNASDAQ:COST was over-speculated by retail groups. Extreme angles of ascent do not hold. The severity of the recent angle of ascent due to speculation warned well ahead of time that COST would have a meltdown when buyers evaporated. The first strong support level is at the black line.
The Weekly chart shows stronger runs up than down. Costco is frequently speculated as there are retail gurus and chatroom groups, etc. that run the stock up from time to time. However, this stock is absurdly overpriced at this level and needs to do a split.

Protective Puts to Ride SpeculationOverview
SoundHound AI ( NASDAQ:SOUN ) doesn't appear to be fundamentally sound, however, its technicals support a potential spike to around $15.50. While the rest of the market also appears to be nearing a peak, there may be a few more weeks of squeezing which is where SOUN may find a second, yet short-lived, wind.
Fundamentals
SoundHound AI has experienced significant negative income the last three years. There was an increase in cash flow which appears to be from the solicitation of its company's shares. The company has also downsized by 40% which it annotates in the 10-K Annual Report for 2023. Overall, my impression is that SoundHound is struggling to find its balance and is shrinking. I believe that the only reason it has surged as it much as it has is due to the market's overwhelming interest in artificial intelligence.
Strategy
Unfortunately it's not enough to be right about the health of a company especially when the rest of the market is chasing a high. Despite SOUN's lack of a healthy fundamentals, I would not be surprised to see a spike to the 1.618 Fibonacci level. This gives me the desire to utilize protective puts in case the market euphoria ends sooner than expected.

BTC LONG Speculation, no major corrections until 75k-80k?Since the ETF, it seems to have been a sell the news, followed by buying the dip event at the 100D MA.
Dips since the start of the bull run, even before the launch of the BTC ETF, have averaged ~20% followed by a continued massive bull run. Some, including myself, speculated a break of this trend of 20% dips (breaking 38k) followed by a continued sell-off into 34k or even 30k. The ETF launch was a perfect event to sell along with outflows from the GBTC takeover until recently.
Assuming this pattern of 100% returns after a 20% dip, technically BTC can reach ~80k. Considering the shortened duration to reach such returns, we may reach 80k sooner than expected in this cycle.
Note that we have recently (in the past few weeks) broken a multi-cycle trendline that acted as resistance roughly two months before the FTX collapse. So it could validate prices rising on top of ETF inflows increasing. Note that upon reaching 74k-80k, it is likely a significant pullback within 30k-40k will occur, given the lack of test of structure that BTC normally does pre-halving.
This idea is invalidated with a daily close under 49.5k. Closing over 59k will likely have the rally continue toward 74k, with any price beyond it being risky to hold without selling, likely maxing out at 80k roughly the end of March. Closing under 44k would be bearish enough to consider going to 30k.
Overall, this idea is very speculative and assumes a trend continuation that breaks BTC's normal patterns/expectations of price movement. Upward price movement is 34%-44% toward 74k and 80k, with a downward price movement of 42+% toward 31k, so entering now is dabbling more in the middle, slightly favoring bears in the long run. This is likely all that's left for BTC to continue the rally past ATHs assuming it can hold 50k before a significant correction. You could even argue of strong resistance ~57k-59k, but inflows are too strong, as is the narrative of RWA and the Tokenization of Financial Assets .
Be weary that there are still other risks (cyber pandemic, bank runs, civil unrest, real estate, labor market participation/retraining, shipping routes in the Middle East, control of rare earth minerals/semiconductors) that have been deferred thanks to speculation/attention of tech around AI, and may conveniently come back. I'm not sure when, but I'd speculate starting the second half of 2025 to 2026.
Trades:
Long 55k
SL 49.5k
TP 74k (close or by the end of March)
Short 77k
SL 85k
TP 60k, 45k, 35k (close)

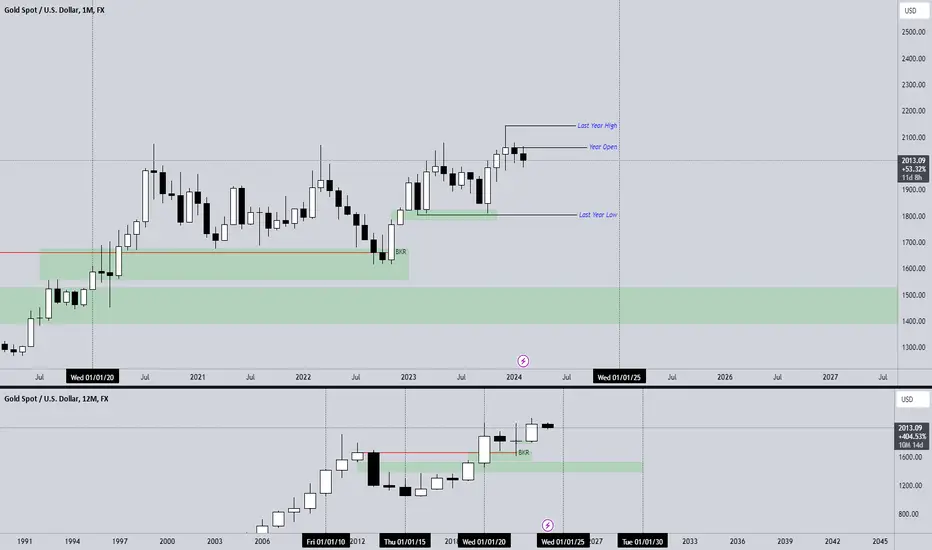
Gold Basic HTF OutlookCut out all the noise, still uptrending but there's still alot of liquidity waiting to be swept over the next couple years if it doesn't happen this year.
We're at a key point on the daily now deciding if that last sweep was for the upside (ATH) or if we really are going into a few down months/years regardless of macro economics.
Baby Bonk at $10M Market CapConsidering that this token is only at $10M market cap and BONK is at SEED_TVCODER77_ETHBTCDATA:1B market cap, we can expect this token to get to the SEED_TVCODER77_ETHBTCDATA:1B market cap region within the next couple months (Perhaps even weeks :o). The Baby Bonk team is on point with their marketing and are very active on social media. Already , 95% of the token's supply is in circulation, with plans to release the token on more centralized exchanges in the (very) near future, alongside the centralized exchanges that already list the token.
Not financial advice. Good luck, and God speed. TO THE MOON!!!

Fundamental Value Levels via Technical Analysis: GOOG ExampleNASDAQ:GOOG had a mega gap down on earnings news. The stock was simply over-speculated.
The price of this stock was way above the true fundamental values. So the stock gapped down to its current fundamental value level.
See the chart attached. The green rectangle outlines the last range where there were Dark Pool Buy Zones. Indicators like Accumulation/Distribution help to confirm a consistent level of accumulation.

$ETH and $BTC Price Level in USD to achieve $ETHBTC ATHI'm going to put this straight forward simple.
BINANCE:ETHBTC , essentially representing the price ratio of Ethereum to Bitcoin, serves as a key indicator of market dynamics between these two leading cryptocurrencies.
Due to the recent Break Of Structure on this Chart, I was curious enough, at what prices are we looking at in USD, in order for the ATH to break.
Last ATH was on June 12th, 2017. Prices at that ATH were following:
ETH: $414.8
BTC: $2980
According to my beloved friends ChatGPT, he could give me many scenarious, at which the ATH at 0.15636 would have be broken. Regarding of the multiplier, you get a different answer, here few very possible for me at this stage of market.
Multiplier: 1.5
New Price of ETH: $3,766
New Price of BTC: $24,085
Multiplier: 1.7
New Price of ETH: $4,269
New Price of BTC: $27,302
Multiplier: 1.9
New Price of ETH: $4,771
New Price of BTC: $30,513
Multiplier: 2.0
New Price of ETH: $5,022
New Price of BTC: $32,118
Multiplier: 2.2
New Price of ETH: $5,524
New Price of BTC: $35,329
Multiplier: 2.4
New Price of ETH: $6,026
New Price of BTC: $38,539
This might be the biggest signal, showing Ethereum has a lot of potential in the upcoming Altcoin Season / Bullmarket.
Not trying to convince anyone, just speculating on some interesting numbers.
Feel free to come up with more different scenarious. 100k for BTC & 15k for ETH might also be possible :D

AI's Insight from News Cross-Checked with Pattern Recognition 👁Dear Investors, I believe that PLTR might fall to $13.2 in the coming months. Here, I made a short idea from the insights of the different AI algorithms I use for speculative analytics.
News Analytics - Natural Language Processing
1 Palantir's revenue growth has slowed in recent quarters. The company's revenue grew by 31% year-over-year in the first quarter of 2023, but this was down from 54% growth in the fourth quarter of 2022. This slowdown in revenue growth could be a sign that Palantir is facing challenges in the market.
2 Palantir's gross margin has been declining. The company's gross margin was 74% in the first quarter of 2023, down from 77% in the fourth quarter of 2022. This decline in gross margin could be a sign that Palantir is having to invest more in sales and marketing to drive revenue growth.
3 Palantir has been losing market share. The company's market share in the data analytics market is estimated to be around 1%, according to Gartner. This is a very small market share, and it has been shrinking in recent years. This could be a sign that Palantir is not as competitive as its rivals.
4 Palantir's stock price has been volatile in recent months. The stock price has fallen by more than 50% from its all-time high in August 2021. This volatility could be a sign that investors are uncertain about Palantir's future.
Cross-Checking Logic
Of course, there are also some positive news about Palantir that could suggest that the stock price will not fall to $13.2. For example, the company has a strong pipeline of new business opportunities. Palantir is also investing heavily in research and development, which could lead to new products and services that could boost the company's growth.
Chart Pattern Recognition - Deep Neural Networks
Between the two red trendlines, my neural networks believe to be a bearish channel. Your human eyes can see how Palantir rejected the upper trendline on 11 October and 21 November. I marked these price points with red ellipses. The channel had some bullish aspects when the bottom trendline acted as a support on 02 November and possibly today. Look at the left green arrow. Palantir's last rally related to this point. Today, the stock is near the same trendline again, and there's a chance that it can reignite a similar rally. The white arrow shows this possible scenario. I, however, feel skeptical that history would repeat itself.
Ensembling Technical Indicators
I asked different AIs to weigh technical indicators to represent their opinions. I ensembled the results of these AI opinions and selected MACD, RSI, and volume to simulate AI's insights in a way you can reproduce on your chart without AI. From declining volume bars I suspect the continuation of the bearish trend. The price action has been bearish over the last week, and I can't see the volume to reverse it. I can see extreme sell volumes every now and then, but they seemed to escalate the bearish trend. I don't see where the orders are that could absorb the end of the bearish trend. RSI tried to make a bullish cross below the volume indicator, but it happened to be a failed cross. RSI reversed as it crossed the SMA, which suggests a lack of bullish momentum. The potential bullish signal turned out to be an indication of how weak bulls are. At the same time, MACD has been going on the bearish side with a strong momentum, and periodically pulsing bearish momentum without signs of weakening. Overall, these indicators simulate what my AI bots believe about the market. Their ensembled opinion seems to be a bearish continuation.
Chart Explanation
I already explained the red bearish channel, the channel contacts, the indicators, and a potential bullish scenario, but I think bears enjoy a better risk-reward ratio. Theoretically, channel breakdown could pull the price into the support level of 13.2. I've got a green line at this level. Thus, the target price of a short could be within the green box around this level where the bearish trajectory's red arrow shows. The stock might reverse or not at this level. I'll have to reassess if I see the playout of my bearish expectation.
Conclusion
Ultimately, the direction of Palantir's stock price will depend on a variety of factors, including the company's financial performance, the overall market conditions, and investor sentiment. It is always important to do your own research and consult with a financial advisor before making any trading decisions.
Kind regards,
Ely

Swing Trade Patterns: $NKE ExampleNYSE:NKE stock has a 2-day resting pattern and then a candlestick buy entry signal that is slightly longer than its average price gains in a single day.
Most Volume Oscillators are not at the top of the chart yet. Flow of funds indicators indicates money flowing into this stock.
The higher line is the bottom completion level for this short-term bottom. The resistance is moderate for a swing trade, but the stock could break through if momentum to speculative buying continues.
