LTC- LitCoin - This is how a Fake Break on Fib looks like This is how a Fake Break on Fib looks like using Weis Wave with Speed Index
Reading the Daily Cha rt
1. Fib Location - Sellers could enter here
2. Largest Up volume wave after a while - also sellers could be hidden in there.
3. Increasing PVR (progressing volume rate) = as we approve the top more volume comes in (sellers)
4. This up wave has the highest Speed Index 10.0S of all the up waves in the trend, that's a HTMU (hard to move up = sellers)
5. The highest PVR bar =sellers
6. Another Abnormal Speed Index 25.5 S - that's another HTMU = more sellers on the up move, price cannot progress upward anymore.
7. and finally down we go with a PRS signal.
All the ingredients for the Short were there. Reading Weis Wave with Speed Index is like reading a book, page after page, until you reach to the last page that the writer has kept the surprise, the only difference is that this is never ending chart book with many stories. This was the story of LTC for now. I think this story has not ended yet and continue to drop to another Fib, the details on the 1HR!.
I hope you enjoy this chart reading lesson using Weis Wave with Speed Index.
Speedindex
BitCoin - Is it heading for the Fib?This is a classic Entry Short for Weis Wave with Speed Index owners called " Exit from Range with a Plutus Signal" and in this case it was a PS. It looks that it's heading for the Fib, I will wait for some pullback on 1HR to confirm with Speed Index and the waves, as well as getting a better RR.
I
BNB Binance Coin: Lesson 15 methodology did the job again
Lesson 15 methodology (annotations in sync with the chart):
1. Largest up volume wave after a while - sellers might be in there.
2. Placed AVWAP and waited for price to cross downwards and pullback again on AVWAP
3. HTMU (hard to move up) - Abnormal Speed Index 4.6S at the top
4. Entry short signal PRS with abnormal SI 4.8.2 (price has a hard time to move up - absorption)
Simple as that. Enjoy!
TRX - Double signal short Wyckoff Up-Trust + PRS Reading the chart (annotations in sync with chat):
1. Largest Up volume wave
3. Resistance Level coming from Daily chart
3. Fast Up Wave (could be fake)
4. Placed AVWAP on fast wave and
5. Our Entry: Double Plutus signal after the retracement Wyckoff Up- Trhust + PRL
Enjoy reading the waves , speed index and Plutus signals.
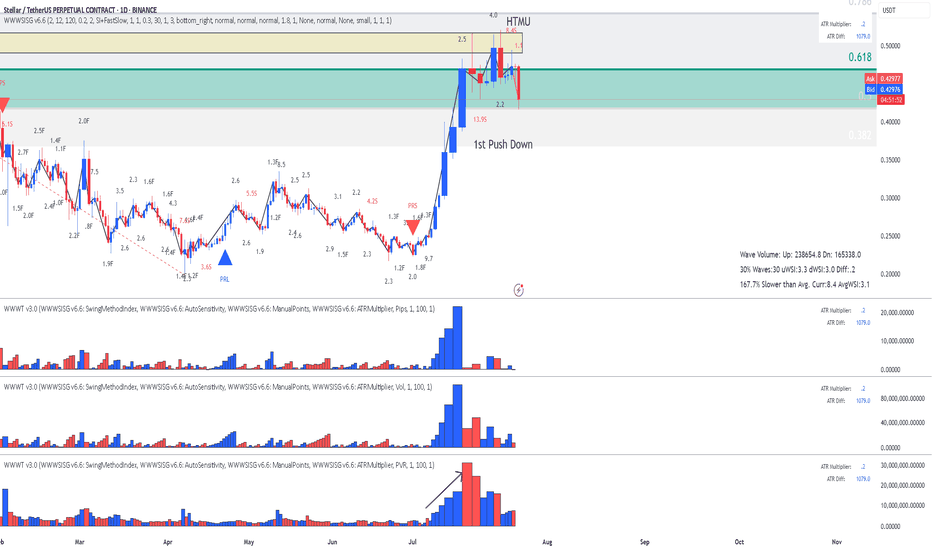
XLM - Stellar - Possible Short coming up - This is Why?Reading the chart (annotations in sync with chart):
1. Location: Fib over-shoot - possible sellers
2. Largest up volume - possible sellers in there
3. Mountain shape PVR - increasing volume as wave progress
4. Abnormal SIs at top (could be closing positions but it also could be sellers absorbing buy orders.
Risky Entry but with better RR enter now. stop above tops, target blue AVWAP
Conservative Entry with worse RR: wait for the break downwards of red AVWAP, target blue AVWAP.
Enjoy, wave and speed index reading!
LTC - Litecoin - After the Short the LongAfter the short Signal on the AVWAP line we found buyers at the bottom.
1. PVR mountain shape is the first indication that buyers are coming in.
2. Abnormal SI 5.6 is what I call 1st Push Up.
Finally the entry Plutus signal PL.
You should be careful now because we are crossing Fib 61.8, get you profits sellers might be in that high volume bar. The reaction later waves will be indication if we are going to continue or reverse.
Enjoy Trading the Volume Wave and Speed Index!
ETHFI _ just went Long reading the waves and Speed IndexReading the recent history of the waves (annotations in sync with the chart):
1. Support
2. Huge volume on PVR indicator at the bottom (buyers)
3. Abnormal Speed Index 55.7 on the down wave , that's Hard to Move Down , more buyers
4. Finally the Entry on a PRL signal.
Enjoy!
PS. I have no idea what this ETHFI crypto is, I just analyzed the chart and it looked like a high probability trade.
LTC- Litecoin Entered Short Reading the chart this is the story:
1. We had Significant Fib location where we found sellers visible at the top- the reaction after the up wave a large down wave.
2. Placed AVWAP at the beginning of the up-wave and waited for the price to cross downwards and the pull back so that AVWAP will act as resistance.
3. Pull Back to AVWAP came after some time
4. Price never breaks AVWAP upwards and it has hard time to move up - Abnormal SI of 4.9
5. Finally waited for a Plutus short signal and in this case it was a PRS.
Stop above AVWAP center line target at least 1:1.5
Enjoy!
ADA - Cardano - Long - Classic Exit from Range with PRLThis is one of my classic trading strategies called "Exit from Range" with Plutus signal and in this case it was a PRL.
Entered Long on the Exit from range, put my stop and hopping that we might cross Fib. When price reached Fib moved my stop a bit above breakeven to compensate on brokers fees and now we are running a free trade. Currently sellers did show up on the Fib , but let's see who is going to win!
Enjoy!
XLM Stellar - Classic Lesson 15 said Long Lesson 15 methodology (annotations in sync with the chart):
1. Support (this where buyers can come in)
2. Largest dn volume wave after a while - Look left - buyers came in previously at the same location.
3. Placed AVWAP and waited for price to cross upwards and pullback again on AVWAP
4. Entry signal PRL with abnormal SI 11.2 (price has a hard time to move down - absorption) after the pullback and that's our entry.
Enjoy!
AAVE - Short Plutus signal: Wyckoff- Up - ThrustReading the chart:
1. Fib 61.8 perfect location for sellers to enter
2. Fast up wave with 5.4 SI -Fake Break
3. Pull back with price having a hard time to move up with 38.1 SI (abnormal Speed Index) and then double signal short Wyckoff Up-thrust and PRS.
Enjoy!
SHIB - Lesson 15 this is how to read the chartUsing Lesson 15 to read the chart (annotations in sync with chart):
1. Support (coming from daily chart)
2. Largest down wave (buyers could be in there)
3. Placed AVWAP wait for the price to cross upwards and pull back
4. PFBL Long signal on the pull back and up we go
Enjoy !


