Never bet against Elon?Never betting against the man is a pretty solid strategy. Nevertheless, considering I am long shares I want to take this textbook trade to hedge (again).
This morning on my spike alerts list was $NASDAQ:TSLA. With an opening high of 354.56 which swiftly closed back inside the range a 30m spike was created. The ATR Clearance fits my criteria to consider this a valid spike to play.
Add to this the context of the Daily. NASDAQ:TSLA is riding the 50% of the big move down on the Daily at 351.39. The spike combined with the Resistance makes this a "have to take" trade.
Playing this with July 300P Options.
Spike

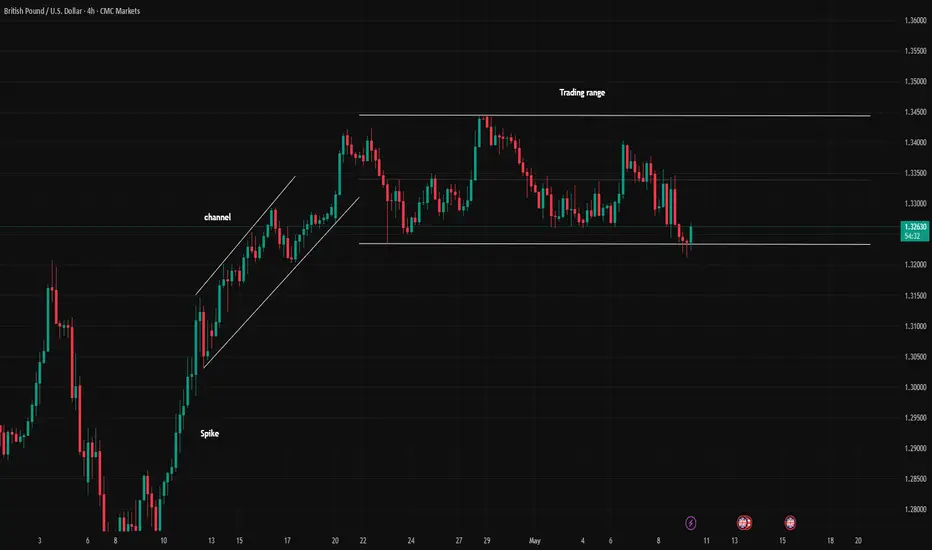
Spike to Range: A Complete Market Cycle UnfoldingPrice has reacted to the bottom of the trading range, forming a signal bar and a key bar, indicating a potential reversal. If confirmed by a breakout on a lower timeframe, this could present a good long opportunity. However, with the Bank of England Governor’s speech scheduled for today, it’s wise to wait for the event before entering any trades. Always apply proper risk management!
Did Redditors make any money on TSLA?I thought I read that NASDAQ:TSLA was going down and Elon was going broke. Earnings were going to assure it. Looks like it came and went and instead went bullish. Oh well, you can't rely on narratives: Only Technicals!
The 218.65 Volume Profile Level has been holding TSLA up for weeks now. Great long by the way. And as long as it holds the next major VP level would be 183.63.
Now though TSLA is caught in a range and this does seem to be the top. If haters had just waited for a signal instead of trading on emotions they could have played this short from a higher price and with Earnings IV crush already over.

"This is fine" on Nasdaq?The general sentiment coming into this week is that the bear trend is over and "things are fine." Maybe. This morning there was a 30m opening spike on NASDAQ:QQQ I cannot ignore. It is happening right at the big Daily 50% Retracement of the leg down:
The level is even more prominent on Nasdaq futures and one can add the Volume Profile Point of Control to said level.
CME_MINI:NQ1!
Playing this with June Puts on QQQ but going to use today's high as a tight stop. We'll see what "Sell in May" brings...

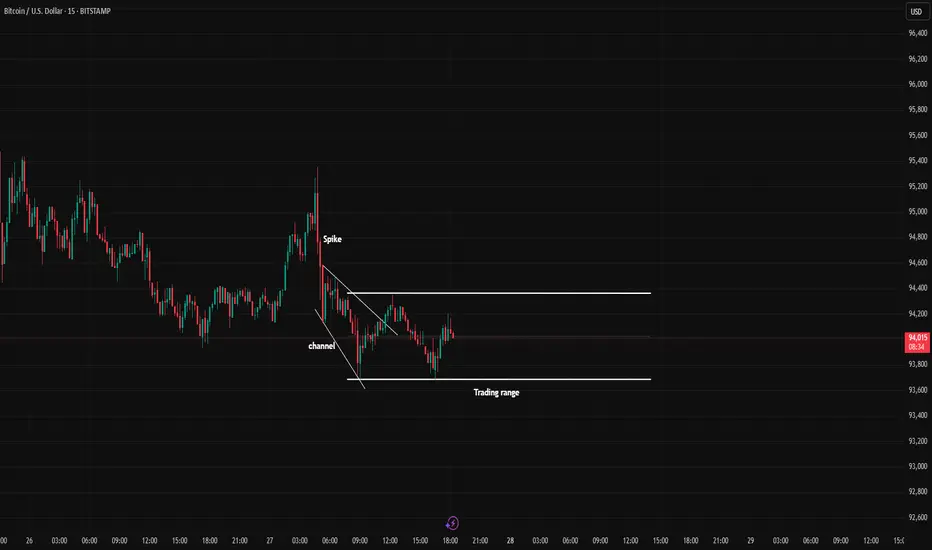
BTC cycleIn the 5-minute timeframe, you can sell at the top of the trading range and buy at the bottom of the trading range (by observing reversal candles and patterns).
Alternatively, you can wait for a breakout and enter in the direction of the breakout.
Be mindful of fake breakouts
Us30 Upward or downward?In the 5-minute timeframe, you can sell at the top of the trading range and buy at the bottom of the trading range (by observing reversal candles and patterns).
Alternatively, you can wait for a breakout and enter in the direction of the breakout.
Be mindful of fake breakouts

Whirlpool of DividendsAm I crazy to be looking at a manufacturing play right now considering the tariff trade wars going on? The stock right now has a forward dividend yield of 8.65% at the current price with a technical setup. There are fundamentals around tariffs to consider but that could only be the "reason" the price has come to a great buy.
I set an alert almost a year ago in April 2024 based on a follower of mine liking the stock NYSE:WHR as a dividend play. I suggested that we set the buy alert for the Volume Profile level going back 20 years ago which also incorporated the 2020 COVID low:
That alert his this week and I did some fundamental research on the company. Back in 2018 Whirlpool took a big hit with the first round of China focused tariffs. However, the company responded by focusing on more U.S.-based manufacturing. Its competitors, LG and Samsung have more tariff exposure. Material costs could still present a challenge.
From a technical standpoint I see a major low with volume support that could hold up price.

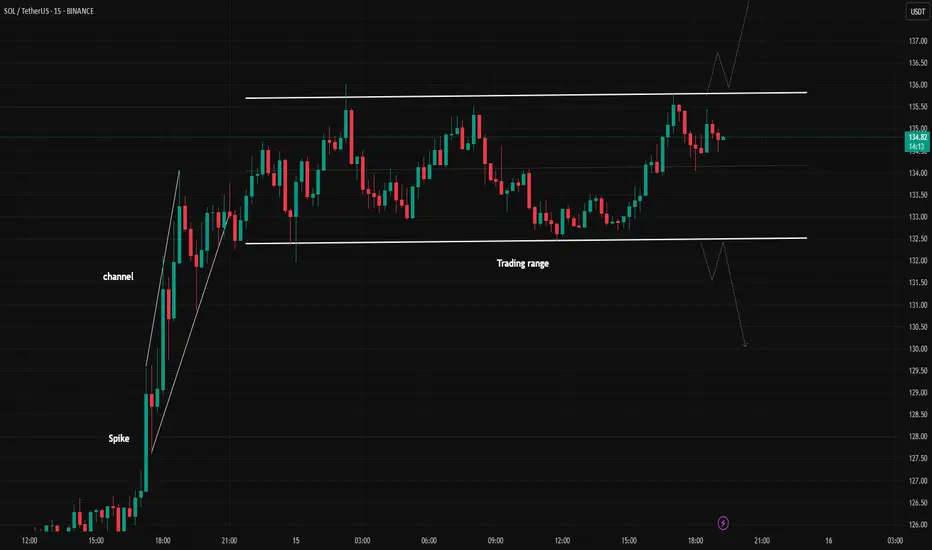
SOLUSDT Upward or downward?Hello,
In the 5-minute timeframe, you can sell at the top of the trading range and buy at the bottom of the trading range (by observing reversal candles and patterns).
Alternatively, you can wait for a breakout and enter in the direction of the breakout.
Be mindful of fake breakouts.
May your trades be profitable!
Bullish Spike on DG: Consumer Staples playI think that people might hate this pick... but I love "hated" tickers.
NYSE:DG came up on my 30m Spike scan this morning amid a sea of red and tanking "risk on" stocks. This indicates some interesting opening price action this morning as a "hey, come look at me!"
This action is happening in the context of a clear rotation into "safe" stocks like Consumer Staples and Utilities; DG is renowned for being a Consumer Staple. The logic is that people will still need to buy basic good, no matter what, and Dollar General's brand is to sell these at low costs to Consumers.
Dollar General experienced a meteoric rise (and fall) due to what analysts attribute as a rapid OVER-expansion. Anecdotally, I recall a newly built location in rural Georgia that I pass by frequently on trips to see family that opened, closed, and in just recent weeks was renovated and re-opened. Either way, I like a stock that everyone thinks is dead that more importantly has come to a decadal low, matching with Volume Profile support, that was also the technical Support that launched the prior rally.
Furthermore, on the Daily there is a clear path for a good Ichimoku Breakout that taking the stock now lets one get the jump on. A full Daily breakout would reverse the bear trend since last April.

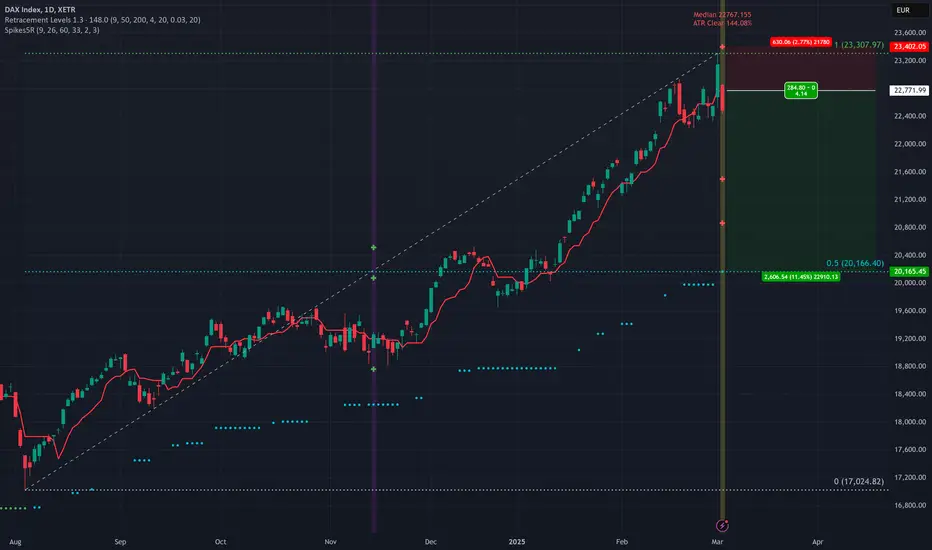
Falscher Ausbruch auf DAXThe German Stock Index XETR:DAX made a new All Time High yesterday only to close back inside the high's recent price action. This sets up a clear Spike with today's close back inside.
Many signs in the US stock market are pointing to the market turning over for at least a bearish correction. I'll be watching the XETR:DAX for a bearish play of this Spike: possibly back down to the 50% of the rally since August 2024.
Do you like chocolate? (HSY)NYSE:HSY Came up on my alerts last Friday (see below) as a Spike of Volume Profile Support. Price rallied from the Spike almost immediately but has since returned for an opportunity to take this trade.
Since the Volume Profile POC is based on the Weekly trend from COVID low > All Time High this trade can be setup as a long term position with the Risk management laid out in the chart above. I would call this an attempt to catch a bottom in the "Valley of Risk" that the stock is currently within.
The above chart is the 30 minute timeframe Spike that triggered the alert. This trade never came back before reaching the 3:1 target. However, we can consider the 2 hour timeframe for more tactical risk management as it is still valid:
Managing risk on the 2 Hour timeframe gives a tight stop just below the Spike low. At which point we can derisk.

Nucor (NUE) Materials Play for 2025NYSE:NUE announced earnings this morning. The subsequent opening price action triggered a Spike Alert on the opening 30 minute bar which brought the stock to my attention.
This spike was generated by the Earnings opening price action. Earnings beat estimates and the stock rallied. However, where the spike breached... and more importantly held... was what interests me.
Price Action Support
The combined supports of:
The 50% Retracement of the trend from January 3rd to January 21st
The Volume Profile Point of Control (POC) for the Trend
...being tested and held are a great sign that price has found support and is respecting it.
To further my analysis of the stock for a long term hold I graduated up to the Weekly Timeframe.
The same two confluences of 50% Retracement and Volume Profile POC have come together and prior to today's Earnings they held as Support in late December 2024.
Finally, we can move up to the Monthly and see the Ichimoku Cloud holding as a potential Ichimoku Cloud pullback.
Fundamentals
NYSE:NUE is a company that has been around a long time. It is a Materials Company (Steel, mostly) with a long price history to look back on. Doing so I noticed that the company's price trends were highly cyclical covering many years. The current pullback that price is within represents a close to -40% discount from the All Time High. The stock's performance will likely depend on economic demand in the coming years.
Trade Management
For this Entry to be valid it should first hold today's Earning Spike low and continue to rally. In the longer term price should not violate the low set during the month of January 2025. Holding both would be great and be exactly as I plan this trade. Violating either or both means the Support is wrong.
Market Thoughts
As a final thought; a lot of investors ask me questions about whatever is "HOT" and in the news. Clearly, this week (and for many weeks) that has been everything tech. You will not find me very interested in chasing these stocks. Not until they have had huge (-50%, -60%) drawdowns. These plays (like Nucor) are the ones I try to find to start my year and then hold them for long to come.
Trade wisely.

BloomZ Inc. Breaks Key Resistance, Signals Bullish MomentumThe share price of BloomZ Inc. (NASDAQ: BLMZ) surged by 7% in pre-market trading, signalling a potential breakout moment for the stock. This sharp move has propelled the price above the critical resistance level of $0.580, which had previously acted as a barrier to upward momentum.
Technical Indicators Favour Bullish Continuation
This breakout is accompanied by a move back above key moving averages, including the 50-day and 200-day MAs, reinforcing the bullish sentiment. These moving averages now serve as dynamic support levels, which can sustain further upward momentum.
The price action is also supported by positive market sentiment and a recent re-rating of BLMZ’s valuation.
Market participants are optimistic about the company’s prospects, contributing to increased trading volume and renewed investor interest. Broader market strength today has further amplified the stock's performance, creating an ideal backdrop for continued gains.
Next Levels to Watch
With the resistance at $0.580 decisively breached, traders are now eyeing the next significant levels around $0.620 and $0.650. Sustained trading above $0.580 could establish a strong base for further bullish activity, while a pullback to retest this level would provide an opportunity to confirm it as new support.

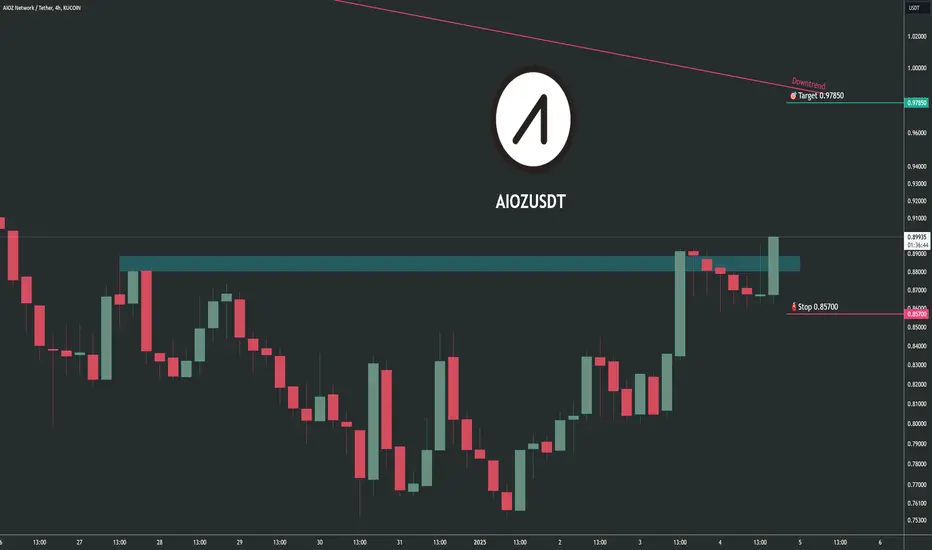
Trading opportunity for AIOZUSDTBased on technical factors there is a Buy position in :
📊 AIOZUSDT
🔵 Buy Now
🪫Stop loss 0.85700
🔋Target 0.97850
📏 R/R 2
💸RISK : 1%
We hope it is profitable for you ❤️
Please support our activity with your likes👍 and comments📝
Trading opportunity for 1INCHUSDTBased on technical factors there is a Buy position in :
📊 1INCHUSDT
🔵 Buy Now
🪫Stop loss 0.4170
🔋Target 0.4530
📏 R/R 2,2
💸RISK : 1%
We hope it is profitable for you ❤️
Please support our activity with your likes👍 and comments📝

Why Buy LLY?A textbook spike trade... that's why!
Every morning the stock market open gives us opening volatility spikes on the first 30 minute bar. Most are noise but when that rare one comes along that fits my rules AND has multiple matching confluences... it's time to "Strike at the Spike!"
This setup has going for it:
At a 50% Retracement of the recent trend (from November 18 - December 4)
At the top of a Gap Level
At the Volume Profile Point-of-Control for the last year of price action (see below)
With a Spike that my indicator shows >80% ATR Clearance I consider the baseline for a trade; this one is 150% so it definitely fits the rules. I would take a spike if there were only 2 of those matching levels above. Targeting the local high for the first take profit at 834.
Here is the Daily chart for just how key this level is:
Full disclosure: NYSE:LLY is and has been one of my biggest holdings; having owned the stock for over a decade.

Look for Spikes to get Long EthereumLate to the crypto bull run? Maybe not! Technical Analysis is not about predicting the future... it is about identifying opportunity.
COINBASE:ETHUSD has been bullish for a few weeks and I've been patiently waiting for it to trigger a setup. I got what I was looking for on Tuesday of this week and it made for a great teachable moment combining my Spike Indicator, 50% Retracements, and Volume Profile. Another "MUST TAKE" opportunity that traders should study and look for...

Bitcoin FAILED 100k!INDEX:BTCUSD FAILED a breach of 100k! Now it has setup my Spike indicator perfectly for a 3:1 Reward/Risk back down to retest the prior ATH at 73811. I could not have asked for a better setup.
I refused to short this rally... knowing better than to get in the path... waiting for a signal. That has now happened. This has been the most interesting Daily candle of the whole rally. Over the past 24 hours the social media sentiment has gone from exuberance at the break of 100k to now slamming back down inside the prior pre-100k high. THEN... right before the bar close a volatile selloff. How, why, does not matter. A chart is a record of human emotion expressed in price.
The party could be over.

The TSLA Trade Setup You NEED To Know!Even if you did not know anything was going on this week... NASDAQ:TSLA had an amazing long setup on Monday. I posted about it then and wanted to make a followup educational video because it was so amazing! It was a setup I HAD TO TAKE because it was all my rules come together!
Traders need to know these individual components:
Earnings Pullback
Gap Levels
50% Retracement
Spike
And when some or all of them come together you take the trade

Post-earning spike and holdI missed this yesterday when it happened in the morning open. NASDAQ:TSLA did a spike at the 50% Retracement of the post earnings rally. Support is established... the stops know where to be. Looks like a good rallying point.

XYL Multiple Levels of SupportAlso on my morning Spike scanner came up NYSE:XYL (see below for the spike on the 30m timeframe).
I especially like this Support level as it has many matching components:
50% Retracement Level. My bread and butter. The most important Retracement Level.
Volume Profile node. Not the POC but a key level of price and volume here.
Ichimoku Cloud. A long flat SKB with the Lagging Span far away from crossing into bearish territory.
This is the Spike that triggered me to look and find price acting such a way at Support:
The take profit target is easy to find; the POC on the Volume Profile for the bullish trend. The stop is between the current VP node and the next significant one (which could be next support but no reason to take that much risk).

American Airlines (AAL) set to fly?Off the top of the 10AM scans this morning is a spike on NASDAQ:AAL with a good ATR Clearance of the bottom of the range.
Why I like this spike, at this position, is based on the Daily low from back in October where this spike also represents a rejection of the Volume Profile level from that low:
Good chance for a bottom pick!

Ethereum Price TRAPPED - Breakout?The Ethereum ETF news came and went this week. It has set up a DOUBLE Spike. As a trader you can often see where traders probably have their stops set. Breaking one of these could trigger a cascade of stops in that direction.
This video lays out what to look for in this unique price action situation where INDEX:ETHUSD currently sits!
