Spike

DisciplineNASDAQ:AKAM and NYSE:THO I took three weeks ago.
I have checked my signals in thinkorswim every morning diligently at 10:00am. That's my job. I have not found a single trade that fit my rules to take bullish since September 17th! My two that I took on that date were NASDAQ:AKAM and NYSE:THO . AKAM and THO both pulled a 3:1 on 75% of my positions, AKAM's remainder I closed when it got below a key level, THO continues to run.
Every day that I do not find an opportunity comes with a little bit of trepidation. "Is thinkorswim's scanner code broken this morning?" "Has the strategy lost some edge?" OR... "Is my strategy just performing as intended and keeping my trades long and short in sync with the market?" I like to believe the latter and based on the timing of the two longs I did take it did help me capture this last bullish run up to resistance on the AMEX:SPY and market as a whole.
So I wait... and reserve my capital for OPPORTUNITY and FOLLOW MY RULES!

Loving Tradingview!Negotiated with the good folks at Tradingview to allow me all the alerts I need as part of my subscription package that I can now use the platform as a signal service to cover all the markets I want with my custom built indicator and system.
I MISSED this alert on the first night I put this into place because I went to bed but it validates all my hard work in coding, backtesting, forward testing, and coding some more to make a trading system that is MY OWN! It's a new chapter in my Spike Trading strategy!

$GRWG Spike and Flag Formation Poised To Break Out$GRWG is showing a fantastic flag that is staying very bull weighted. It's likely that buyers will want to continue this rally up from here. I would love to see a fake-break low to dip in to entry zones for buyers to push back up to highs.

Long on SRPTSetup an order this morning to buy SRPT at 127.71 and was not sure if it would fill. Market sold off today as the SPY continues to fight that critical level this week.


Wednesday Long... DVNToday's trade is a long off support on DVN. Looking to take it back up to the prior range at 10.65.

ETH finding supportTaking a long on BITFINEX:ETHUSD on the 1h to start the weekend after a big morning volatility bar.

Starting off with DHIStarting off the week and my publishing of live equities trades with a long position on NYSE:DHI . Looking for it to hold this spike created in the early morning back up to a retest of the recent high range.


Global Social Chain (GSC/BTC on Huobi) 80%+ spike incoming?Some tokens on Huobi are very spiky. Predicting these spikes is incredibly hard, and something I'm working on long-term.
But for now, I found an interesting pattern by eye on the GSC 3-day chart.
Oversold conditions (you can't really call it a signal) stop just before the big spikes. In other words, the last 3 times out of 3, buying when the 3-day oversold signal disappears has been a highly assymetric risk (earlier in this token's history this correlation didn't work very well, I think because it took the trend measurements a while to adjust after the very quick 95% drop from ATH.)
Will it be 4 for 4? I don't know, but I'll be in it to find out.
Indicator used: Price Action Trend Overlay | Simple with default settings.


BTC/USD Neutral AnalysisA lot has changed since yesterday! We've managed to break through a few areas of historical resistance. The last (obvious) level of resistance to break is 9.6k. If we can break through that our next target should be around 10k. That being said, I'm willing to bet that there are quite a few long-term trapped traders (going long) at the 9.8k - 9.9k levels. If they are looking to break even when the price returns to that price point, they will be exiting their long positions, and will drive the price down a bit. I can't imagine that there are too many, but I do expect that we will have to deal with that.
(very) Short term, I'm bullish up until 9.6k. At that point we will have to test it. Last time we tested it we ended up in a week long sideways trading period so I'm not entirely sure what we can expect to see there. There was a recent price spike that got us to 9.55k which is nice, but we're starting to lose volume. That leads me to believe that we will battle to get passed 9.6k. In all honesty I expect the price to bounce off of 9.6k and sit around 9.55k for a bit, but we'll have to wait and see.


Market getting toppy? Lots of bearish signalsI primarily use TDAmeritrade's thinkorswim platform to trade and I am starting to notice that their intraday data integrity is far better than Tradingview. I use thinkorswim to generate my morning alerts for "spikes" and the bars in the platform are very different from TV. Regardless, the number of alerts this morning gives me a hint that the market is getting a bit toppy today. I had 2 Limit order profits hit and closed 2 other bullish trades manually. I went short AZO and ALL on signals. Here is this morning's list for posterity. This many data points should yield some statistics on the signal.
AGN
ALL
AMGN
ANTM
AZO
BDX
BMY
BR
CDNS
CPB
KMX
CME
CMCSA
GLW
DHR
DRI
XRAY
ETR
FE
FCX
AJG
JKHY
HLT
INTU
IQV
LVS
LYV
MKTX
MMC
MDLZ
MCO
MOS
MSCI
NDAQ
PFE
PPG
PGR
DGX
ROST
CRM
SRE
NOW
STE
SYK
TMO
TRV
VRSK
DIS
XRX
ZBH

SPX Future Projection Analysis *Future spike detected*TVC:SPX What's happening on the May 1, 2020? Checking the United States Economic calendar. This is what I found that could be the cause of the increase volatility on that day:
1) Core Price PCE Index: Forecast is 1.7%, Previous was 1.8%...May drop further than anticipated.
2) Employment Cost Index: Forecast is 0.7%, Previous was 0.7%..."The Employment Cost Index measures the change in the price businesses and the government pay for civilian labor. A higher than expected reading should be taken as positive/bullish for the USD, while a lower than expected reading should be taken as negative/bearish for the USD. " ...Will this be 0.8%+? I think so.
3) PCE Price Index..."The PCE price index, also referred to as the PCE deflator, is a United States-wide indicator of the average increase in prices for all domestic personal consumption. The impact on the currency may go both ways, a rise in CPI may lead to a rise in interest rates and a rise in local currency, on the other hand, during recession, a rise in CPI may lead to a deepened recession and therefore a fall in local currency.
4) Personal Spending (Month to Month) Forecast is -6.5%, Previous was 0.2%...Maybe reading will show less than negative forecast.
5) Chicago PMI
While these reading can flip the forecast; volatility will increase. So, for all Option holders, check your Vega. If you don't know what Vega is, don't do options until you understand the Greeks.


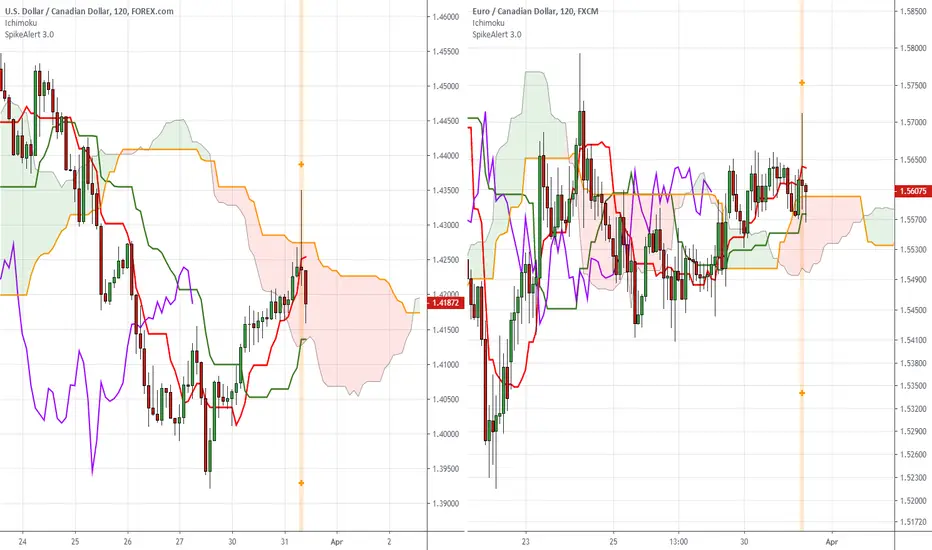
CAD signaling a reverseAlerts went off this morning on the CAD pairs (USDCAD, EURCAD, CADCHF) with some intraday price action. Price spiked up on these pairs (down in the CAD) for the first part of the US session only to slam back to below the session opens. I'm going to play this as a confirmation of the countertrend pullback within a full reversal of the CAD's recent run-up. I want to play the move down to a target around 1.38 on USDCAD; the 50% retracement of the run-up.
Smarter than Buffett?"Delta plunges after Warren Buffett's Berkshire Hathaway slashes its stake" is the morning's headline following the announcement. As investments I don't know why anyone would want to own airlines. They are too exposed to all kinds of risk... world economic factors, energy, terrorism, and now plagues. But to trade airlines... the contrarian in me combined with a price action alert makes me want to test for an opportunity. Earnings are this week and I do not expect anything they say to help or harm what is already known; that Delta is burning through a whopping $60 million per DAY! So while there is some earnings gap risk I'm going to keep my position small and exploratory. Let's see if this is the double bottom of the Daily.

Trade Ideas Analysis: GBPAUD SpikeisI shorted this repeated pattern on the spike that forms along the uptrend channel.
The Bonus of this setup is that my MT4 connecting to the live data detected an ABCD pattern, the black eclipsed on this diagram is amendments to this demo data that this movement didn't occur on my live data.
I will watch closely how the price reacts at the bottom trendline of this channel if a break and close below, I will be keeping the trade, but if an indecision candle appears, I may intervene and close this trade.

Spike Trade USDCADGot a spike alert at the top of the 1pm hour on FOREXCOM:USDCAD . CAD has been a big player in the market's volatility due to the price of oil. Using this alert and setup as a trigger to test for a top.

How to trade the current markets!In this video I explain how you should be trading the current market movement and conditions. This video is more educational than anything else.
