Something weird happened to cryptoMy Spike Alerts just exploded tonight across nearly every major cryptocurrency and exchange. All did spikes to the upside that quickly reversed. Failed pump in low liquidity? Arbitrage algos gone wild? Maybe we'll find out tomorrow....
Spike

spike & channel trend line on the #bitcoin 🔥 hi there
we all heard abut breakout's but normally price always put people behind therefor price make a spike but what should we do after recognize that.
well there is some that we can doo about it first we must analyze the channel after it see if it's a week channel of a strong channel because there is high chance that chart 📉 might make another spike in the same direction.
if the channel is weak then we might have a deep pullback but if the channel is strong we might have the second spike without any pullbacks.
I'll be happy to see your comment's
cheers 🥂.

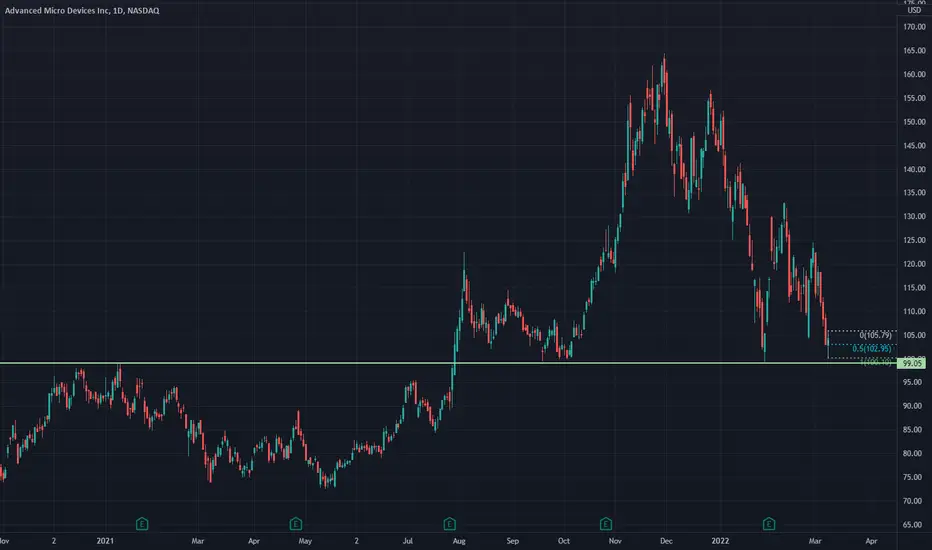
Long AMD off Inflection and Intraday SetupThis morning several tech stocks including AMD, NVDA, and ETSY which I have on my Spike Alerts setup a short term, 30 minute timeframe, spike right at the 1/24 and 2/24 lows. This sets up an opportunity for a low risk entry for a long term hold on either of these three stocks. AMD NASDAQ:AMD is my pick of the three because I have no current positions. See below for the 30 minute setup...
Bearish Spike on BitcoinThis morning following the recent rally Bitcoin BITFINEX:BTCUSD created a bearish spike at the highs to setup for a short trade.

Would you buy garbage (WM)?Waste Management NYSE:WM is one of my favorite stocks because I was once asked, when I said I was a professional technical trader, "if the price of garbage was going up, you would buy it?" To which I replied, "yes, I own Waste Management"
This morning I received a volatility spike alert which is happening at a major 50% Retracement.
Added to my position that began back in March of 2020 when the world was ending.

Litecoin at Support with breakout short signalLitecoin COINBASE:LTCUSD pegged the 108.82 support level which it has consolidated above for a few days. This snap back off the level shows confirmation that it is a support but also sets up a clear breakdown entry level. With crypto having a bearish few days and the Bitcoin short being live the sentiment is bearish. Breaking this level would trigger a short opportunity.

Trading Patterns That Repeat (Video)I wanted to make a companion explanation video for my idea that I just posted comparing the Daily Stock Market Indexes to the 30 minute timeframe on Waste Management. Both are setting up the same pattern across different instruments and timeframes.

Trading Patterns That RepeatLast week's price action of the stock market gave a textbook example of one of my favorite and fundamental trading patterns; that of the false breakout reversal.
On the longer term Daily timeframe both the Nasdaq and S&P 500 setup this pattern with the February 24, 2022 spike to break but then recapture the January 24, 2022 low.
We do not have to wait to see how this might play out. My trade on Waste Management NYSE:WM was based on this exact pattern and as of today it has reached the 3-to-1 target. It is fascinating and very profitable to accept and recognize that these patterns can and do appear on all timeframes and on all instruments.

Buy the Dip? The stock market just did THIS!One of my must trusted signals for false breakout opportunities just triggered in the stock market on both the Nasdaq NASDAQ:QQQ and S$P 500 AMEX:SPY . If you are a regular viewer of my content you have seen me talk about this setup before as it is one of my most trusted fundamental strategies of my trading. Win or lose THIS signal we got on the Russia/Ukraine FUD is going to go down as a textbook example I will use to teach the setup for months and years to come! I am super excited to share with my viewers in real time!

Nasdaq Daily SpikeThe stock market indexes last week on the Thursday rip setup a bullish spike false breakout. I expect the intraday price action to slow down as we move out of the volatile days of January-February and the Daily setup should dominate. Over the next weeks I expect a rise to retest the All Time High. I would change this opinion with a break of last Thursday (2/24/2022) low.

Royal Caribbean Cruise (RCL) Spike at 50%Today at the open MANY stocks in the S&P 500 did early trading spikes before recovering their trading range. NYSE:RCL happened to do this at a 50% Retracement Level Support.

Garmin Earnings SpikeGarmin NYSE:GRMN had earnings today and the price action on the swing timeframes broke the past weeks' lows to recover back inside the range. This setup is happening right on the 50% Retracement of the COVID low to All Time High along with an Ichimoku Cloud Pullback on the Weekly timeframe. Options spreads are wide so this trade will be best expressed with shares.

Bitcoin Spiking at Key LevelI just got an alert that BITFINEX:BTCUSD had a Spike Alert at a key level following a weekend of consolidation. Price is testing the Liquidation Low of December and trying to break higher following the recent rally. This creates a clear range that Bitcoin will likely break out of to the upside or downside. I am still trading Bitcoin as it is in a bearish trend since October.

The ONE price action trick you NEED to know!I want to show traders examples of a powerful phenomenon for trading price action. This quick price action happens on earnings, major news events, and other catalysts. It happens on stocks, cryptocurrency, futures, and anything that trades! This involves some candlestick analysis but is incredibly simple. Traders can use this to spot reversals and be contrarian to what the market may think right before they are wrong. This can also prevent you as a trader from taking big losses if you react quickly to this warning sign!
We look at 4 examples in this video:
-Amazon NASDAQ:AMZN earnings
-Facebook NASDAQ:FB earnings
-Bitcoin INDEX:BTCUSD
-S&P 500 Index Futures from FOMC meeting CME_MINI:ES1!
Everything that trades will have this happen. Once you see it you will not forget it!

Has Robinhood (HOOD) Stock made a bottom?Maybe. Robinhood stock (HOOD) could have setup a bottom on the last earnings. The stock has been rallying today but the foundation for why this could be a bottom still presents a good reward risk trade. In this video I talk about the potential trading setup, why I like the potential, where it goes wrong and you need to stop out, and use HOOD as a teachable moment for why bagholding is a terrible strategy. "The stock can't go lower..." ranks among the most deadly sayings in trading and investing!

XAU/USDThe gold chart entered the trading cycle yesterday after Sharpe's move and is fluctuating in the range of 1838 to 1843.7.

Bitcoin long trade breaking downOn January 10th I noted a price action Spike Alert around the December 3rd Liquidation Low. I saw this as a bullish signal as price was respecting that low with buyers coming in. In the days that have followed price action had a chance to reverse the bearish trend but as of this morning seems to be stalling out. The "bullish trade" is close to breakeven and on the trading timeframe (2h/4h) is setting up a bearish Ichimoku cloud breakout. This breakout could retest and break the January 10th low. I would not want to be long anymore.

Elon In potential profit zoneAs you can see, the price started its bullish cycle in Oct. It finished the channel phase and entered into trading range phase, but not a normal trading range, It created trading range in pattern mode ( bullish triangle ).
Parts of the charts are:
Red line: short term bearish trend line ( one side of the triangle )
Dotted red line: extended bearish trend line
Green line: short term dynamic support ( another side of the triangle )
White lines: Main support zone
The Price broken both bearish trend line and extended one with 3 consecutive bullish candles and then has created a pullback with 2 pin bars and another small bearish candle. That's definitely a spike and its pullback, but the context does not support the idea that it's a start of a new bullish cycle which can create a new ATH, or just a minor cycle into the trading range and can go up and touches the previous ATH. For now, We do expect that the pullback continues to at least the broken extended line ( dotted ). If it goes further, the price will make pullback to the main bearish line ( red ) which also will be the cross of the red and the green line, so at that point, strong support it likely expected.
So at this point, the tp1 would be the previous high which will give %89.29 profits ( %161 if it goes down to the red line ) and at that point, we need to see the price momentum and decide to go for higher tps or we should take the profit.

Crypto SpikingAll the things crypto are spiking on the swing trading timeframes. The Bitcoin entry now could be good... it has prior hesitation in price action and one could target the top of the range for a superb reward/risk. However, the rest of the spike signals in other cryptocurrencies look more like volatility. These spikes are happening in the battleground middle of a nasty consolidation.
I remain short BITFINEX:BTCUSD Bitcoin and BITFINEX:ETHUSD Ethereum. I am still looking for price to retest the Liquidation low of early December.

Litecoin to Liquidation LowLitecoin BITFINEX:LTCUSD gave a Spike Manipulation Signal. I have been looking for trades over the last few days to short cryptocurrencies back to retest the low of the recent liquidation event which will be the first target. I'll hold a partial position for a break of the Liquidation Low.

Ethereum Manipulation at the Rally HighA few minutes ago there was a Spike Manipulation that triggered stops above the last Rally High on BITFINEX:ETHUSD . This sets up a very low risk trade to short the rally back down to the 50% Retracement.
5 Minute trading timeframe:

Ethereum Versus Bitcoin (ETHBTC) Rally ContinuesToday's divergence between Ethereum BITFINEX:ETHUSDLONGS and Bitcoin BITFINEX:BTCUSD can be visualized in the price action of the cross pair BITFINEX:ETHBTC .
Yesterday's price action took it to the 50% Retracement of the most recent bullish trend and Market Manipulation Spike signaled a rally off the level.

Dollar short (USDCHF)Today's FOMO volatility created many Spike Alert opportunities. Along with equities, crypto, and all other risk assets spiking to the bull side the inverse properties of the US Dollar came into play. The Spike pattern most in line with my strategy was found in FOREXCOM:USDCHF
