Spike Reversal Pattern on Bonds (TLT)Yesterday's close on NASDAQ:TLT broke the day's range causing many to think it was going lower. However, today's open reverses that sentiment by opening back above that short term range.
Bonds are a very cyclically trending instrument (see below) and at some point the down move of the last few days was likely to reverse. This could be the setup with a low risk stop to get long TLT.
Spike

Money where your mouth is... ARKKI admire folks that are willing to put their trading out there for comment and criticism. It takes a lot of emotional control to trade in isolation much less when under public scrutiny. Cathie Wood was the idol of the trading world last year and widely followed for her style of exciting and parabolic investing as well as her public charisma and confidence.
There was one interview in particular (I wish I could find it now but she has done many) where she acknowledged that within her trading history she has had cycles of incredible returns invariably followed by large drawdowns. She gave this interview right around the peak of her funds' performance last year. Real recognize real. That she would openly acknowledge and admit that she had self identified this pattern of her trading spoke to my own journey and likely that of all serious traders. She had acute self awareness and in some way, in that interview and comment, was warning people to be cautious with her strategy at that current moment.
Now as her funds decline other traders are trying to make a name for themselves off her fall. One of which that has come to my attention is Puru Saxena. He is vocally short her funds and very bearish. That is fine for them to have a battle; no need for me to get involved. Cathie has her strategy focused on long term growth. Puru bases his strategy on macro. Neither are my game.
But now it gets interesting for me as a Technical Trader.
At the same time Puru is adding to his short AMEX:ARKK is sitting right at a 50% Retracement of the major trend. Over the last few days price spiked below this level only to recover quickly above it. These are my strategy.
So now I get to step into this battle by putting my own capital on the line. It's a low risk/high reward trade. Not for the money but for the validation of Technical Analysis versus macro.

DWAC Mooning off the SpikeFollowing a spike low this week and a rocket off the fake out NASDAQ:DWAC is up bigly today. The jump rally created a good 50% Retracement Level that matched the top of the range.
In all honesty... the chart pattern looks like a typical pump fail. However, most pumped stocks have their second life at some point with a relief rally. This could be it.
I still hold my Donald Trump fun tickets!

Technical Analysis GBPUSD FAKEOUT/SPIKE Trade.Looking at the GBPUSD monthly rejection point also known as support and resistance lines or memory. GBPUSD was currently on a weekly low and moved very rapidly to the south with a strong rejection at 1.32551. This could signify a change in trend or a continuation of previous support or resistance pattern, I'm risking 20 pips on this trade with a 2/1 R/R. 2% Per Trade. Remember this analysis is for educational purposes only and If you want to know how I draw my support and resistance lines. Just send me a message.

Looking for a rally in Oil stocksThe market looks to be recovery today and the most interesting stocks to me were oil companies ( NYSE:XOM , NYSE:MRO , NYSE:COP ) which all exhibited morning open volatility spikes. The one I liked the most because it was at at 50% Retracement (see high timeframe below) is XOM so it fits my criteria for a long trade.
I'll be looking for a retest of the last major highs.
This is also an addon positions to a winner from the beginning of 2021 (see Related Idea).

SPY within bearish spike tradeThis Wednesday nearly every stock in my list is up. The market as a whole is doing a recovery today. I went to the Daily AMEX:SPY to see where price action stands and found that price action of the SPY is within a bearish spike that occurred on November 22. In any instrument this would be a signal albeit the statistics of the spike's clearance are sub optimal.
As price approaches 464 it will test the 50% Retracement "line in the sand" as Resistance. Conquering this, it can go on to retest the ATH, make a new one, and continue the "Santa Claus rally" that I have been expecting from this "normal" year.
If the bearish pattern continues it could find support in the region around 450 that was a prior ATH and the 50% retracement of the last leg up.
Currently momentum remains bullish according to Ichimoku. Price has through the first days of December to stay on the bullish side of price action.


Long groceriesI've been patiently waiting on a setup to enter Kroger NYSE:KR for a while now. It is a fan favorite on my social media and I do nearly all my grocery shopping there. Yesterday I finally got a spike setup (Spike Alert with proper metric, at a 50% Retracement Level) that fit my criteria so I entered. While this is just another trade at the moment in the short term once profits are secured I hope for a break of the high and addition to my long term portfolio.

SHIB LONG AGAIN. Shib is almost done trading right. i am pretty bullish for a while. i see maybe .00021 targets in the near future, maybe higher like .00045

Comcast long after earningsNASDAQ:CMCSA had earnings yesterday and the stock opened and spiked below the October low. It quickly recapture the range setting up a good spike opportunity. I like taking these sort of setups because earnings is a good catalyst to move a stock (in either direction) and also removes that unknown volatility factor that could disrupt an otherwise good trade.
NASDAQ:CMCSA is a long term portfolio hold for me so this position is a trade and an addition on a pullback for the stock. I use Comcast and they are continuing to dominate the broadband space. I also have it in a basket strategy with other broadband related stocks such as NASDAQ:HLIT , NASDAQ:COMM , and NASDAQ:CSCO .

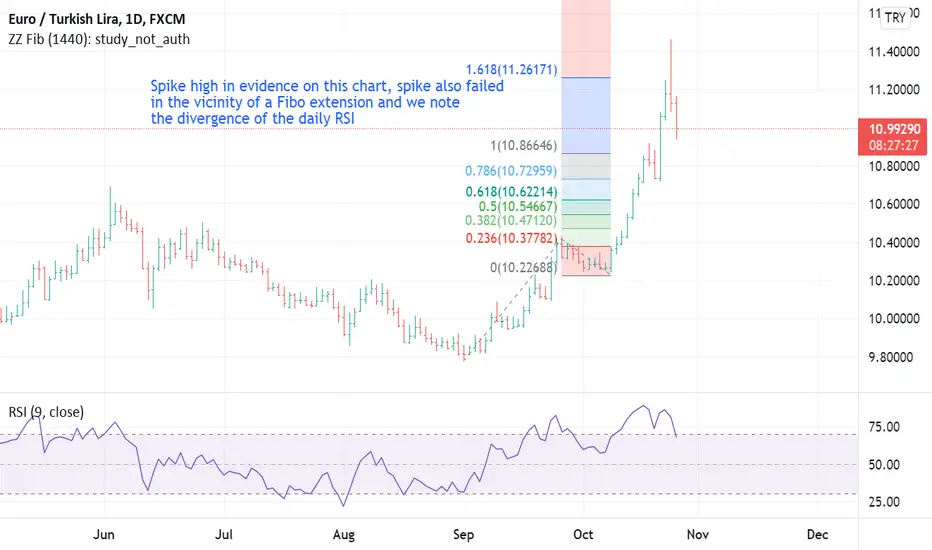
The spike high on EUR/TRY is a classic reversal patternThere are a couple of technical analysis patterns that can help identify reversals – some are more important than others, but this morning we note this beauty: - The spike high on daily EUR/TRY chart
The spike high on EUR/TRY, not only did it chart a spike high, but it reversed from a Fibonacci extension (1.618) AND we note the divergence of the daily RSI. All these factors imply that the market has topped.
Spike highs are identified by the following criteria:
• a High sharply above the days on either side,
• a Close near the day's Low, and
• a strong preceding rally.
The more extreme each of these conditions are, the greater the likelihood of a reversal.
NB RSI = Relative strength Index (click here if you would like to know more - www.investopedia.com).
Fibonacci extensions: Click here if you would like to know more: - www.investopedia.com
Disclaimer:
The information posted on Trading View is for informative purposes and is not intended to constitute advice in any form, including but not limited to investment, accounting, tax, legal or regulatory advice. The information therefore has no regard to the specific investment objectives, financial situation or particular needs of any specific recipient. Opinions expressed are our current opinions as of the date appearing on Trading View only. All illustrations, forecasts or hypothetical data are for illustrative purposes only. The Society of Technical Analysts Ltd does not make representation that the information provided is appropriate for use in all jurisdictions or by all Investors or other potential Investors. Parties are therefore responsible for compliance with applicable local laws and regulations. The Society of Technical Analysts will not be held liable for any loss or damage resulting directly or indirectly from the use of any information on this site.
might buy if you were methe market has went over our trendline which gives us confirmation for a clear buyy

Gold spikes after CPI, RSI divergence !!Hello everyone, as we all know the market action discounts everything :)
_________________________________Make sure to Like and Follow if you like the idea_________________________________
During the Asian session on Thursday, gold experienced some selling, losing a portion of the previous day's big climb to the highest level in roughly a month. The XAU/USD, which is considered a hedge against inflation, benefited after the US CPI report revealed that inflationary pressures had been steadily rising. In light of last Friday's poor NFP print, the data heightened concerns about the return of stagflation. This, together with widespread US currency weakening, provided a significant boost to the dollar-denominated commodity.
A positive RSI divergence has been found as well and it happened after the CPI report yesterday which indicates an increase in value.
Possible Scenarios for the market :
Scenario 1 :
Today started Bearishly but looking at the chart and how the trend is currently trading we might see another push today that will be headed near the first resistance level located at 1805.86 and from there it will push further hitting the major resistance zone starting at 1819.94 where the main battle will happen and the winner will determine the market movement for the next period of time.
Scenario 2 :
The Bears are starting strong today and they will be attempting to drop the market value today after the big rise that happened yesterday, If there were able to keep this momentum today then we will see the market drop, and the first stop will be the support located at 1767.87, in case they broke out that support then they will keep going until they hit the support at 1743.96 where we might witness a bounce back in price.
Technical indicators show :
1) The market is above the 5 10 20 50 MA and EMA indicating a Bullish short-term trend, But still below the 100 and 200 MA and EMA which tells us that the major trend is still looking Bearish.
2) The RSI is at 58.05 showing good strength in the market. a divergence has been seen between the market and the indicator.
3) The ADX is at 19.80 near trending state, With a positive crossover between DI+ (24.46) and DI- (15.79).
Daily Support & Resistance points :
support Resistance
1) 1767.87 1) 1805.86
2) 1743.96 2) 1819.94
3) 1729.88 3) 1843.85
Fundamental point of view :
Wednesday’s rally came after the Labor Department reported that consumer prices in the United States rose by 5.4% in the year to September as rallying commodity markets from oil to coffee kept the pressure up on the world’s largest economy.
On Tuesday, the International Monetary Fund cut its outlook for 2021 world growth to 5.9% from a previous forecast of 6%, saying the momentum for the global economy has weakened while uncertainty has increased.
The IMF is also concerned that surging commodity prices will force central banks into tightening cycles that could trigger selloffs in global equities.
While gold appeared to have a tentative resistance at $1,800, that might not prove to be too difficult to breach if risk aversion runs wild. According to investing
This is my personal opinion done with technical analysis of the market price and research online from Fundamental Analysts and News for The Fundamental point of view, not financial advice.
If you have any questions please ask and have a great day !!
Thank you for reading.

GOLD before FOMCWe have been mentioning today's events since the beginning of the week.
The main scenario before FOMC
Price going up to 1790 and then a bearish candle close with a long wick to the upside on the H1 timeframe.
This is when we will enter a trade. NOT BEFORE THAT!
Targets below 1725.
Stops above 1810 or above the wick.

SHIB Smart PlaysHere’s my insights on how I’m playing $SHIB, meme coins can be even more profitable with proper analysis and not just wishful hodling.
SHIB/USDT has been keeping consolidation patterns and is currently in consolidation right now. Volumes still in the billions and social media presence is still buzzing. Analysis report is remaining in BUY.
SHIB has been steadily spiking and dropping about 20%-30% and then repeating the process for the past couple of days. All stats are still pointing at another spike, and then opportunities to short.
I’m currently holding 1 futures contract on SHIB (long) and holding a bag of about 10M (to pull after potential next spike). Then the next drop I can open short futures contracts and keep repeating this process until the pattern breaks. Following this allows profits to be obtained in both directions

Spike Trade ExampleThis morning on the jobs report the S&P 500 futures spike in the premarket to a new All Time High but quickly shot back down. This triggers my indicator and an alert withing Tradingview to come check the price action and yields a potential trading opportunity.
The risk is defined by the + at the top of the spike. Fundamentally, if the market makes a new ATH the trade is wrong and should be exited.
If this volatility spike reveals a top then the trade should hold and the lower + represents a 3-to-1 reward-to-risk target from the entry on a pullback to the red median line. These + indicators are tools for defining the risk and reward of the trading opportunity.
Technical Analysis would give potential Retracement Levels. The first Retracement Level at 4505 happens to yield the desired 3-to-1 target as indicated. The longer term Retracement Level at 4450 could be a more ambitious target for more reward or to allow a partial position to continue after reaching the first target.

Why you still need to take profits in BitcoinFollowing long happy trends where everyone enjoys easy gains often follows hard consolidations where lacking discipline will cause traders to burn capital. That does not mean traders have to fully ignore the market during consolidations. The wise way to approach them is to be dispassionate and take opportunities with structured risk and target levels.
This is a followup to my Friday Livestream where I acknowledged my bearish sentiment in BITFINEX:BTCUSD had me miss a key Resistance turned Support which also setup a volatility spike trade on the 30m timeframe right at said level. Price held the Major Retracement level to achieve a 3-to-1 reward/risk trade. At which point a wise trader could have cut their position and left on a remaining long position to allow for a bullish continuation. Price came back to entry following the profit level which would have put the trade in peril... but since profit was taken even a loss of the remainder would still yield an overall net positive trade. The trader would not have needed to move their stop from the initial level to maintain the position for today's pump.
Be mindful that the recent highs are still not broken and Bitcoin continues to trade within this range. Trade wisely!

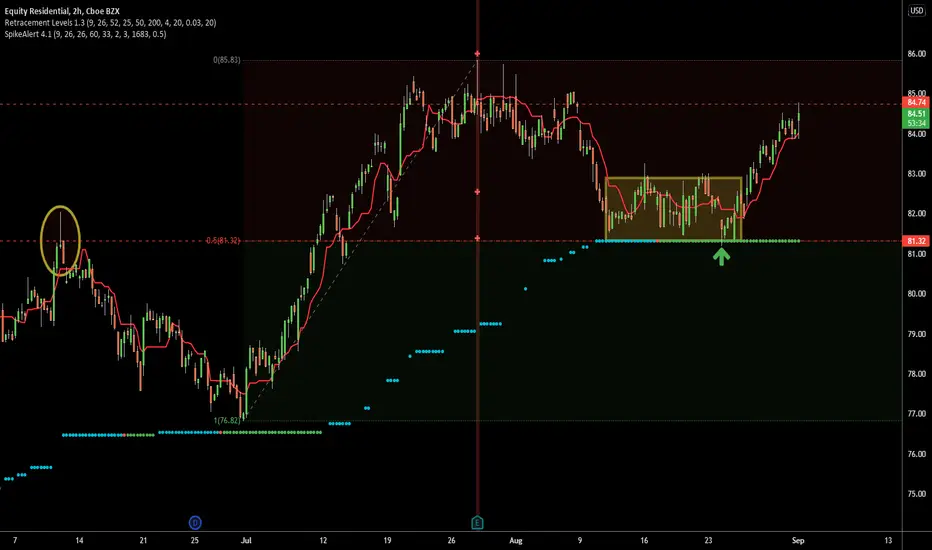
Textbook Retracement Level EQRThis is what I like to see: the stock NYSE:EQR pulled back to a 50% Retracement Level following an earnings high. This level matched with a past high price action and price hesitated for many weeks at the level before launching off it. The entry point was actually on a morning volatility spike 8/19/21 but this does not show properly on Tradingview data. Study this example.
Will CPOP... POP?Based on analysis from a friend (who I get to blame if this does not moon) I got a signal on this morning's volatility spike for NASDAQ:CPOP . Small YOLO knife catch.

Better Profit Taking Inside ConsolidationsMy last trade in UNH highlights an example of where I look for targets especially within a mid consolidation. When looking at a past high as a potential take profit target often times price will miss the actual proper high. The more conservative and higher probability place to take targets (or look for reversal) is the 50% within the reaction off the last high: the short term price action where price fooled around to create the high. -UNH

LMT at Retracement LevelLMT price action this week has begun confirming support at the 50% Retracement of the 2021 bull trend. Price has slowed down and held it for multiple days with a volatility spike adding confirmation yesterday. It is now setting up for optimum short term risk to enter.

Ethereum setting up breakout shortThe 60 minute chart of BITFINEX:ETHUSD created a support here around 3150 in the middle of a rising consolidation. Breaking the spike low would break the support, break the lower bounds of the flag pattern, and confirm an Ichimoku cloud breakout. These are three ways using different indications to identify a potential breakout.
I dislike when charts get too cluttered but at the cost of having a very busy chart I wanted to demonstrate the methods in a single idea. Choose a method or indicator that makes sense to you as a trader and then study it to mastery.

PGNY at 50%NASDAQ:PGNY is a stock that I have been in for over a year. It is a rare case where I have a fundamental bias (rather than technical to start) as a friend clued me into it June 2020. The fundamental case for this company is that they offer fertility services and their "moat" is that already have many deals with Fortune 500 companies that offer fertility packages in compensation to workers to delay parenthood in favor of careers. With the research showing that the trend is continuing that women are delaying family in favor of career I believe this company is a strong hold for the coming decade.
It is now providing a technical setup with a short term risk defined entry. I have been waiting for such an opportunity after watching the last year's run.
