Hedging with short JPMWhen the market reached a (new) All Time High earlier today I wanted to get some short Delta in my positions. I learned my lesson during the 'recent unpleasantness' bottom of 7/19 that being all net long puts one at risk of volatility in a portfolio... even if the positions themselves individually remain strong and profitable.
This morning's volatility setup a good short entry on NYSE:JPM that by looking at futures this evening should hedge against tomorrow's potential downside.
Spike
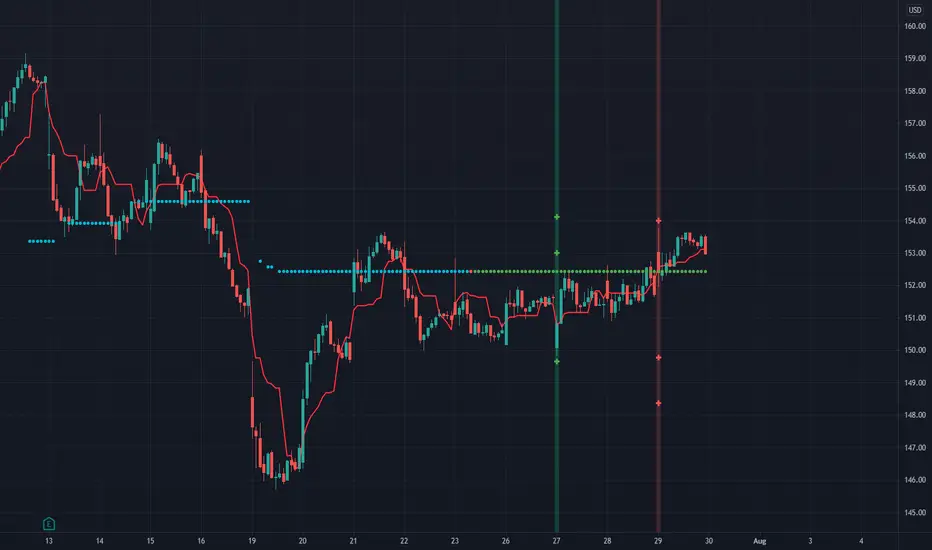
Hedging with short DVNWhen the market reached a (new) All Time High earlier today I wanted to get some short Delta in my positions. I learned my lesson during the 'recent unpleasantness' bottom of 7/19 that being all net long puts one at risk of volatility in a portfolio... even if the positions themselves individually remain strong and profitable.
This morning's volatility setup a good short entry on NYSE:DVN that by looking at futures this evening should hedge against tomorrow's potential downside.
Earnings are close so I may need to de-risk next week before.

WHAT IS THE TREND OF NASDAQ?NASDAQ break its ascending channel and came down by a spike. now it makes a triangle pattern and I think it break from bottom and goes down till the target.

PYG (PROCTER & GAMBLE) BULLISH VISIONTwo active chart patterns.
Space to rise by waves.
Do you have two options to enter:
1. 141.0 resistance breakdown.
2. leave a buy limit order on the support 139-140.
Hold on and enjoy! :)

LTCUSD is in a ascending channelLITECOIN change its trend after a long short trend and now it is in a strong ascending channel. its look that LITECOIN wants to rest and become range after a spike. then it continue the trend and goes up till higher target (148.00) .

Digging the price action on PENNNASDAQ:PENN was not on my immediate watchlist but I happened to notice the price action from last week giving a second solid rejection of the Weekly 50% Retracement. See below for swing timeframe spike...

UBER Price Action AnalysisI was looking at a trade today for a member of my social media. NYSE:UBER looks to have stalled at 52.35 which is right at the 50% Retracement of the recent down move. This if following a retracement of the last bull trend which was around the same zone as the IPO first weeks' price action highs. Price could in the short term retrace down to retest the 5/10/21 low but would remain bullish as long as that low holds. Breaking the 6/28/21 high would be a sign of a bullish breakout.

Spike or Tail [BTC/USDT]Not a financial advice
On the 4 hours chart, BTC just had a tail in candlestick which oftens mark a short term turning point after a price run or decline. BTC might touch he 36K mark again.

DPW could spike to $15When the yellow lines converter with the uptrend, with some news around earnings it spiked before: the lines are now coming together again around upcoming earnings.
Looking for a technical spike after the long squeeze, on high volume, after it goes above the 50DMA.Historically it did this before multiple times.
Also there's a gap above 15.16 so it could gap up to 23.44, and with very high volume even higher.
Basically PT is 10.94-15.16

Should be scanning ETFsCome Monday going to look at a position in XBI (if it has not gone too far). Pulled back and spiked at the Weekly 50% Retracement that matches with prior price action. Stop needs to be just below the low of May 11th.
The industry for this ETF is Biotech. This should make Cathie Wood happy.

Gap before EarningsNYSE:GPS fired off a bullish signal this morning at a support level that fit my rules for a long trade entry. I'll be watching this closely through the week as the stock has Earnings on 5/27 which can be a maker or breaker of a great trade.

WEC Resistance turned SupportNYSE:WEC triggered a volatility alert this morning. The level it is at is a former Resistance that has been turned into confirmed Support. It is worth a long trade off this level.

SPY Sentiment Signal BearishEvery day I scan the market for individual stocks within the S&P 500 index AMEX:SPY for short term volatility either bullish or bearish. I have begun compiling these signals into a derivative indicator. This morning's score was a -11. The last time the indicator signaled -11.20 was on 4/16/2021 which preceded a few days of downside in the market. This morning's price action made a slight try to get up and test the All Time High but seems to be failing. The first part of the day's down move has retraced to the 50% Retracement level of the day. It is worth taking a short here to test my signal, play the day's price action, and benefit from an asymmetric reward/risk. A failure to retest the last ATH could have much downside.

Autozone Post EarningsNYSE:AZO triggered a spike alert this morning on earnings announcement. Price action is at a support and worth a buy to play back to the top of the range and beyond.
As an aside, used car prices have increased dramatically in the last few months due to the shortage of new car inventory coming to market. Some of this is due to material costs and companies like Ford NYSE:F have been reported to be having backlog due to computer chip shortages. These market forces are compounded by inflation.

Vix could have one last spikeThe VIX could have one last spike left in it before it settles down for this secular bull market run. When it settles down it should settle below the '20s but until then a potential catalyst for another spike could be the June 10th CPI release or if a member of the Fed mentions tapering. If numbers come in hotter than expected again, there could be a frantic sell-off accompanied by a spike in the fear index as people worry it is non-transitory.
I am still overall bullish on the market since we are in a secular bull market but corrections are normal, healthy, and necessary in order for the market to take the next leg higher. BMO came out with a year-end target on the S&P of 4500. Some projections show that inflation could run hot for 6 months, which would be transitory. As for the damage it could do to the underlying economy, that is unknown. As for equity, stocks are a natural inflation hedge.

HUM Post-earnings pullbackNYSE:HUM Humana's post earnings run-up has pulled back to a 50% Retracement level and held this morning along with a volatility spike.

Cipla - Bullish viewCipla - Bullish view , Expecting price to move up to 955.
Once falling wedge trend line broken price may move up to 995, Expecting good momentum in the trade.
Please visit my You tube channel as well. ;-)
youtube.com


BPTH Case StudyI remember seeing this move live in real-time when it happened. It was amazing!
Thought of doing a study case of this pattern.
The chart is self-explanatory.
First, you wait for the first part of the pattern to happen ----> Huge gains + Huge Volume
Second, you watch it does the first pullback, and keep an eye on the HIGH.
Third, when the stock is making a new high, you enter with momentum, risking to the previous low.
The previous low is almost 50% away but it is fine, it is safer this way, being conservative protects you in the long run, putting 1 unit of risk on this trade.
Either to take profit on the way up somewhere when the profit seems substantial, or according to the gap theory, or take profit when touching the EMA, or when you see the move is drying up.
You can see that the move is drying up when there is no substantial volume on the rallies + the rallies don't follow through.
Note to self: I noticed that when there is a downtrend on drying volume, odds that the downtrend will continue ---->>> POTENTIAL SHORT SETUP
*** Could possibly look at options if they are profitable or not for this trade.

MU Triple Top inside Triple TopI like the price action for a bearish play on NASDAQ:MU . This morning spiked to make a local triple top which is also creating a Daily timeframe triple top.
This is a good example of using Multiple Timeframe Analysis as I talked about in my last video idea, linked below. We are using a short term timeframe setup combined with a higher timeframe setup.
Options also have very good spreads.

VZ low risk swing tradeNYSE:VZ Verizon spiked down this morning to a 50% level. It is worth a small risk trade to play back up the dividend catalyst dip from last week.

DRE triple top plus double topHave not seen a trade I liked in too many weeks but this morning NYSE:DRE setup a 30m timeframe triple top at 43.07. This also matches closely with the stock's ATH back in November. It is worth a swing trade short shares setup. Unfortunately options liquidity is scarce.
