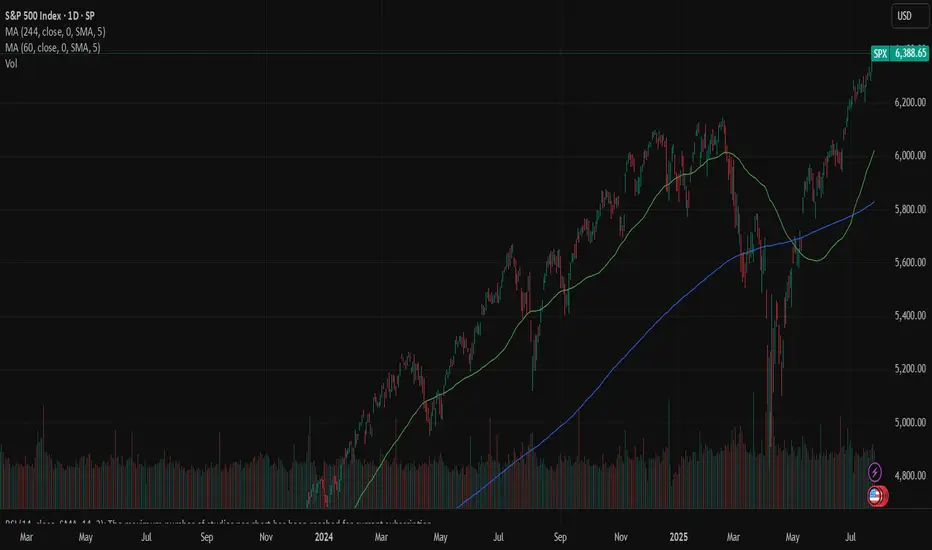
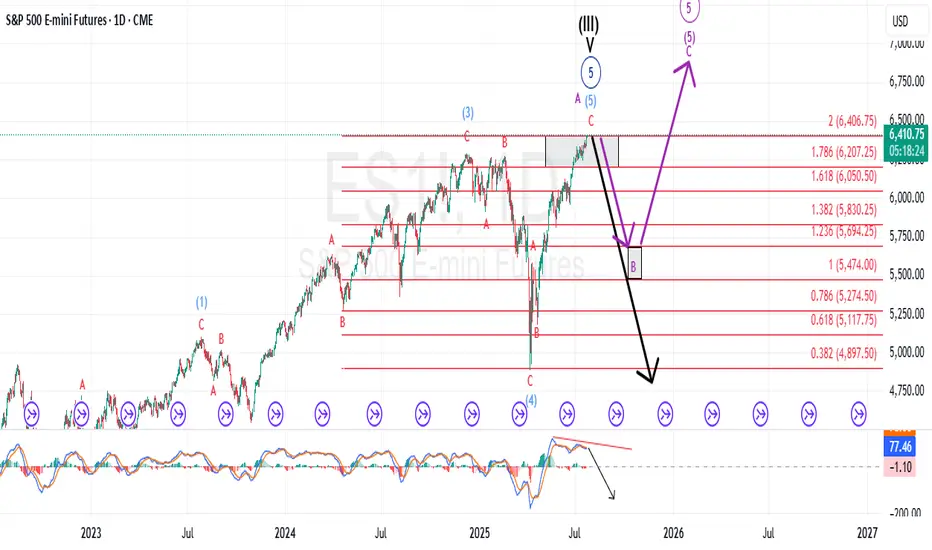
Hellena | SPX500 (4H): LONG to resistance area of 6596 .Dear colleagues, I haven't made a forecast for the SNP500 in a long time and was waiting for a correction, but it seems that a major correction is not yet close, and at the moment the price continues to be in an upward five-wave movement.
Therefore, I believe that we should expect to reach the 6596 area, which will mark the end of the medium-term wave “3.”
The corrections are not very deep at the moment, but the price may reach the 6317 area before continuing its upward movement.
Manage your capital correctly and competently! Only enter trades based on reliable patterns!
SPX (S&P 500 Index)

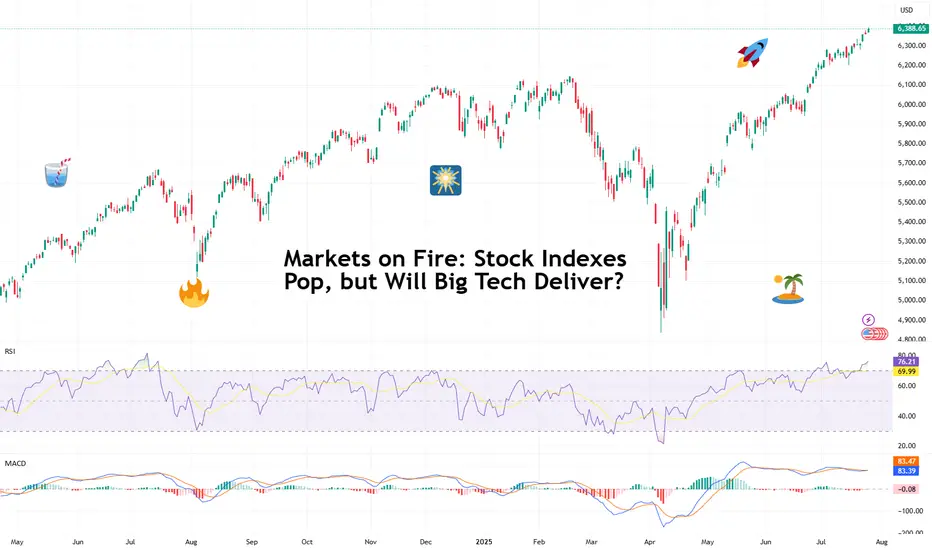
Markets on Fire: Stock Indexes Pop, but Will Big Tech Deliver?S&P 500 and Nasdaq set records. Now it's up to big tech to justify that.
Talk about forward-looking valuation. Tech companies’ valuations are largely based on future potential rather than current performance. And that’s what we’re seeing right now getting priced in across the big indexes.
You’d think we’d be bored of record highs by now. But no — Wall Street keeps hitting refresh on its all-time-high counter. 🎵 Over and over again. 🎵
On Friday, the S&P 500 SP:SPX notched its 14th record close this year, ending at 6,388.64. The Nasdaq Composite NASDAQ:IXIC followed with its 15th at 21,108.32. Even the Dow TVC:DJI — the older sibling who prefers yield over hype — climbed nearly 0.5% to 44,901.92, within a latte’s foam of its December record .
And while indexes are breaking personal bests, investors are buying ahead of some big data deliveries. Why? Because the week ahead is the Super Bowl of Earnings, and the bigger chunk of the Magnificent Seven is up next.
😎 What in the Magnificent Seven?
A highly exclusive club with just seven members, the Mag 7 has entered the earnings spotlight — and the audience isn’t going mild. Traders are pricing perfection, and the script better deliver.
Meta NASDAQ:META kicks things off Wednesday after the close with expected revenue of $44.8 billion and EPS of $5.87. Can Zuckerberg’s AI narrative get investors to forget about the metaverse?
Microsoft NASDAQ:MSFT shows up at the same time, hoping to dazzle with $73.8 billion in revenue and $3.38 EPS. Copilot AI better be doing overtime.
Then on Thursday, again after lights out, Amazon NASDAQ:AMZN joins the chat with its AWS and ecommerce empire expected to pick up $162.1 billion in revenue. Right behind is Apple NASDAQ:AAPL , fighting to stop its slide into meh-land with projected revenue of $89.2 billion and $1.43 EPS. (Fast fact: AAPL is down 12% year to date — among the worst performers in the crew.)
So far, Alphabet NASDAQ:GOOGL already crushed its quarter , posting $96.4 billion in revenue and $2.31 EPS, plus a spicy raise in capex to $85 billion.
Tesla NASDAQ:TSLA ? Not so great. The EV maker reported a 12% revenue drop and a 16% net income decline, spooking investors with a warning of “rough quarters ahead.” The stock is lower by 17% year to date.
Nvidia NASDAQ:NVDA , the AI trailblazer, reports in late August. Until then, it’s chilling on a $4 trillion throne, as per our Top companies rankings, watching its friends sweat it out.
💸 Can the Mag 7 Keep Carrying?
Here’s a harsh dose of reality: the entire S&P 500 is riding on the backs of these seven stocks. Analysts expect them to post 14% earnings growth, while the other 493 companies limp along at 3.4%. Talk about top-heavy things.
So what happens if even one tech titan misses the mark big time and spooks with scary guidance? A market correction? A buy-the-dip opportunity?
And let’s not forget: valuations are stretched. The S&P 500 is now trading at nearly 23x forward earnings (that’s projected profits per share). And the Nasdaq? Don’t even ask. (We’ll tell you anyway — it’s close to 30x). In all that, now’s a great time to keep a close eye on the Earnings Calendar .
📊 Not All Is Big Tech: Fed and Jobs Loom
As if this week wasn’t already packed enough, macro is back on the menu. The Federal Reserve meets Tuesday and Wednesday, and Chair Jay Powell is expected to hold rates steady at 4.5%.
But don’t rule out drama. A single hawkish word and this party could quickly get some rain on. Powell, the man who moves trillions with a simple “Good afternoon,” has a track record of putting markets in their place when they get too euphoric.
And then there’s Friday’s nonfarm payrolls report. Consensus calls for just 108,000 jobs added in July — soft, but not disastrous, and fewer than June’s 147,000 . Blame summer hiring slumps, tariff uncertainty, or the market finally digesting its own hype.
Off to you : Can the Magnificent Seven keep this market magnificent? Or are we about to learn what happens when you ride too close to the sun on AI-generated wings?
History does not repeat itself, however it tends to rhymeIt’s widely accepted that Mark Twain once said (or wrote) that “history does not repeat itself, however it tends to rhyme”.
Historical Parallels to a Super Cycle Wave (I) Top in U.S. Equities
The road to a major market top is often paved with echoing patterns from the past, and today's landscape bears an uncanny resemblance to pivotal historical events that preceded economic upheaval.
The 1918 Spanish Flu—though less economically damaging in the U.S. than elsewhere, still triggered a 1.5% drop in GDP and a 2.1% decline in consumer spending. The resulting economic weakness, paired with rising inflation, eroded real returns on equities and short-term government bonds for years.
Then came the 1929 stock market crash, the spark that ignited the Great Depression. Driven by a perfect storm of extreme speculation, sky-high valuations, and a regulatory vacuum, the collapse revealed the systemic fragility beneath the euphoria.
Adding fuel to the fire, the Smoot-Hawley Tariff Act of 1930 slammed the brakes on global trade. By sharply raising tariffs on imports, it invited swift retaliatory measures from abroad. The result: a devastating plunge in both U.S. exports and imports, deepening the economic crisis and worsening unemployment. Smoot-Hawley has since become a textbook example of how protectionist policy can magnify economic damage.
Modern Echoes: A Cycle Repeating?
Fast forward to the present and we see unsettling similarities.
The Covid-19 pandemic serves as a modern analog to the 1918 flu, disrupting global supply chains and triggering a steep drop in GDP and consumer spending. Unlike the post-WWI period, however, inflation didn’t precede the crisis, it exploded afterward, fueled by pent-up demand and fiscal stimulus, giving rise to persistent “sticky” inflation....and NOT TRANSITORY.
In a similar inversion of sequence, the Trump-era tariffs—modern-day echoes of Smoot-Hawley, were enacted before any major equity downturn, not after. Still, their long-term impact on global trade and supply chain reliability remains a pressure point for the economy.
Most critically, speculation and valuation excess are again center stage. Just as the roaring ’20s were characterized by euphoric risk-taking, today’s U.S. equity market is trading at record-high P/E ratios, despite rising macroeconomic uncertainty and deteriorating breadth.
These historical and contemporary markers suggest we may be approaching the apex of a Super Cycle Wave (III), a turning point that, like its predecessors, may only be fully recognized in hindsight.
It is my contention, that history is currently rhyming.
Best to all,
Chris
SPX500 Correction Before Rally? Key Levels in FocusSPX500 Correction Before Rally? Key Levels in FocusSPX500 OVERVIEW
Fundamental Context:
The U.S. and EU have averted a tariff standoff. The agreement reduces the baseline tariff on most European imports to 15%, down from the previously threatened 30% by the Trump administration. In return, the EU has committed to investing approximately $600 billion in the U.S.
Additionally, U.S.–China trade talks are ongoing in Stockholm, with reports suggesting a possible 90-day extension to the tariff deadline.
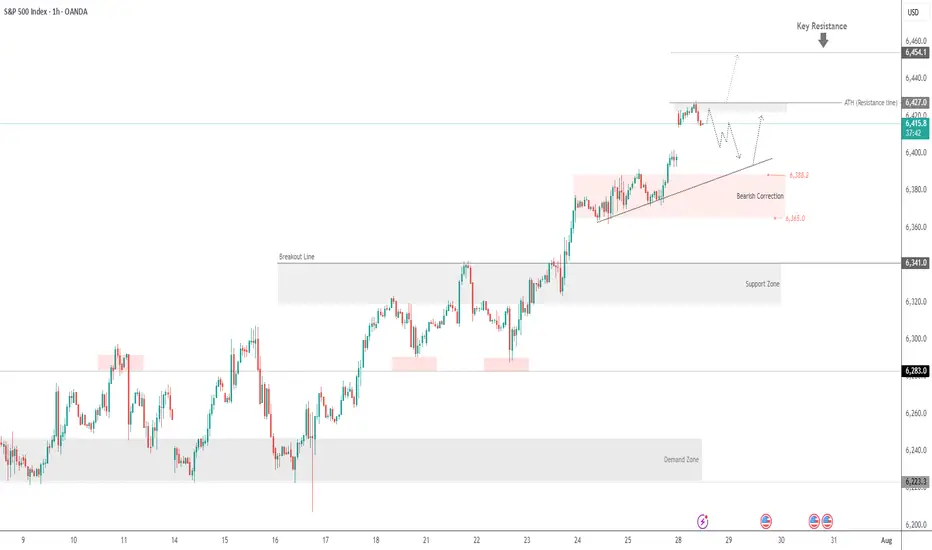
Technical Outlook:
SPX500 maintains a bullish bias due to easing trade tensions. However, as long as the price trades below 6421, a short-term correction toward 6397 and 6388 is likely. A rebound is expected if the price stabilizes above 6388.
🔺 Bullish Continuation will be confirmed if a 1H candle closes above 6427, potentially targeting 6454 and 6470.
Key Levels
• Support: 6397 – 6388 – 6365
• Resistance: 6454 – 6470
SPX: Tariffs deal (un)certainty Investors' optimism continued to hold at the U.S. equity markets another week in a row. The S&P 500 posted another weekly winning streak, supported by solid earnings of companies included in the index. The index also reached another all time highest level, with Friday's level of 6.388, gaining around 1,5% for the week.
Tech companies were once again main contributors to the surge of the index. Alphabet posted better than expected quarterly results, supporting the surge in share price of 4%. Tesla shares gained 3,5% for the week. The company reported strong vehicle delivery numbers and progress in AI-driven autonomous driving technology. Analysts are noting that 82% of all companies included in the S&P 500 index, that have already reported quarterly results, have beaten the market expectations.
Alongside strong earnings reports, recent advancements in U.S. trade negotiations have contributed to market gains. Earlier this week, President Donald Trump announced a significant trade agreement with Japan, which includes a 15% reciprocal tariff arrangement—an important step toward redefining trade terms between the two nations. Additionally, the U.S. and Indonesia have reportedly reached a framework agreement for a trade deal, reflecting a broader U.S. effort to strengthen and stabilize trade partnerships in Asia. On Friday, President Trump expressed confidence that more trade agreements will be finalized ahead of the August 1 deadline for new tariffs. One of these possible deals involves the European Union. Investors have welcomed these developments, as they help reduce tariff-related uncertainties and ease concerns about escalating trade disputes that could disrupt global supply chains and impact corporate earnings.
The week ahead brings a bunch of important macro data for the U.S. as well as the FOMC meeting, where Fed members will discuss a potential change in interest rates. Markets are currently not expecting that the Fed will make a move at this meeting. Certainly, with JOLTs, NFP, PCE data in combination with the FOMC meeting, the week ahead might bring back some higher volatility in the US equity markets, in case of any unexpected news.
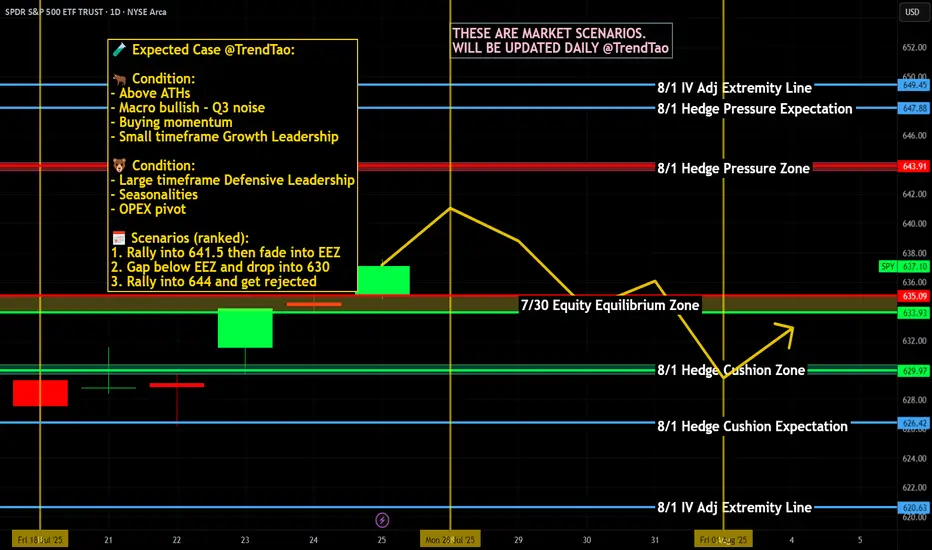
Weekly $SPY / $SPX Scenarios for July 28–August 1, 2025🔮 Weekly AMEX:SPY / SP:SPX Scenarios for July 28–August 1, 2025 🔮
🌍 Market‑Moving News 🌍
🏦 Fed Holds Steady, Faces Political Pressure
The Federal Reserve is expected to keep rates at 4.25%–4.50% during its FOMC meeting midweek. While rates are unchanged, political pressure from President Trump continues as calls intensify for rate cuts and questions arise over the Fed’s independence—including dissent from Governors Waller and Bowman.
📦 Trade Truce Extends & New Deal With EU
A new trade framework with the EU reduces tariffs to 15%, easing tensions. Meanwhile, U.S. and Chinese trade teams begin talks in Stockholm on Monday aiming to avoid an early-August tariff deadline.
💻 Tech and Mega-Cap Earnings Spotlight
This week features earnings from tech giants including Meta, Microsoft (Wednesday), followed by Amazon and Apple (Thursday). Markets will prioritize forward guidance around AI investments, capital expenditures, and sales trends.
📊 Key Data Releases & Events 📊
📅 Monday, July 28
No major releases
📅 Tuesday, July 29
Chicago PMI (July flash) – early indicator of regional manufacturing trends.
Global PMIs – flash readings for Europe and Asia gauge economic health.
📅 Wednesday, July 30
FOMC Rate Decision & Powell Press Conference – investors will scrutinize tone, forward guidance on rates, labor markets, and inflation.
Q2 U.S. GDP (Advance Estimate) – expected at ~1.9%, signaling rebound after Q1 contraction.
📅 Thursday, July 31
June PCE & Core PCE Indexes – Fed’s preferred inflation measure. Core PCE expected at ~2.7% YoY.
Consumer Confidence (July) – key for household spending trends.
Trade Balance (June) – provides data on U.S. import/export dynamics.
📅 Friday, August 1
July Nonfarm Payrolls, Unemployment & Wage Data – forecast for ~102,000 new jobs and ~4.2% unemployment; markets await for labor-market cooling signs.
Tariff Deadline – new tariffs loom unless trade agreements with EU, Canada, China etc. materialize by today’s cutoff.
⚠️ Disclaimer:
This summary is educational and informational only. It is not financial advice. Always consult a licensed financial advisor before making any investment decisions.
📌 #trading #stockmarket #economy #Fed #earnings #inflation #tariffs #GDP #PCE #jobs #technicalanalysis
Are you ready for this scenario?? BUY THE NEXT BOTTOM!!!Spx is gonna drop hard, are you ready to buy the next bottom?
I expect SPX to reach 4,440 atleast... NASDAQ, BITCOIN are gonna drop hard too...
BUY EVERYTHING IN 2026/2027 AND ENJOY THE NEXT CYCLE.

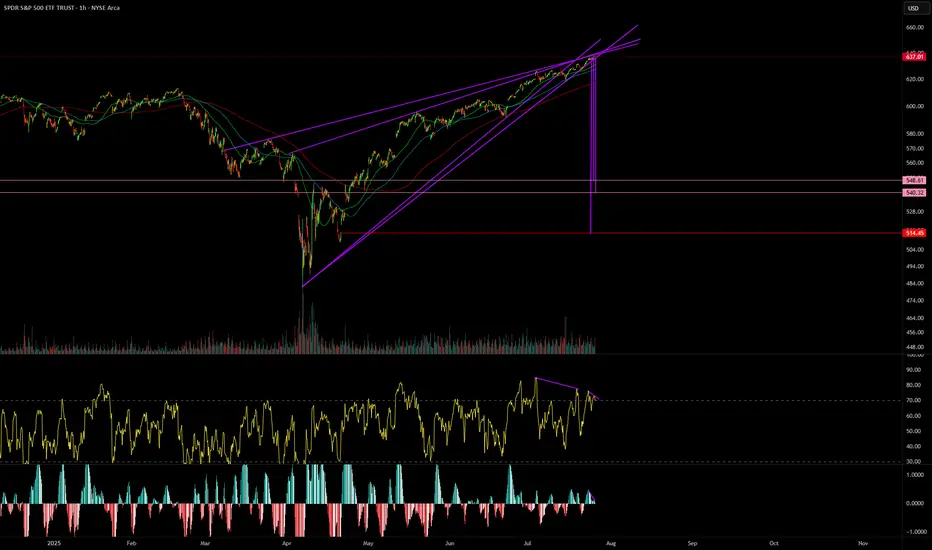
SPY Imagine the SmellImagine the smell from the Bulls if the $514 gap is filled.
Bearish divergence galore.
Not a matter of if this wedge breaks.
Its when.
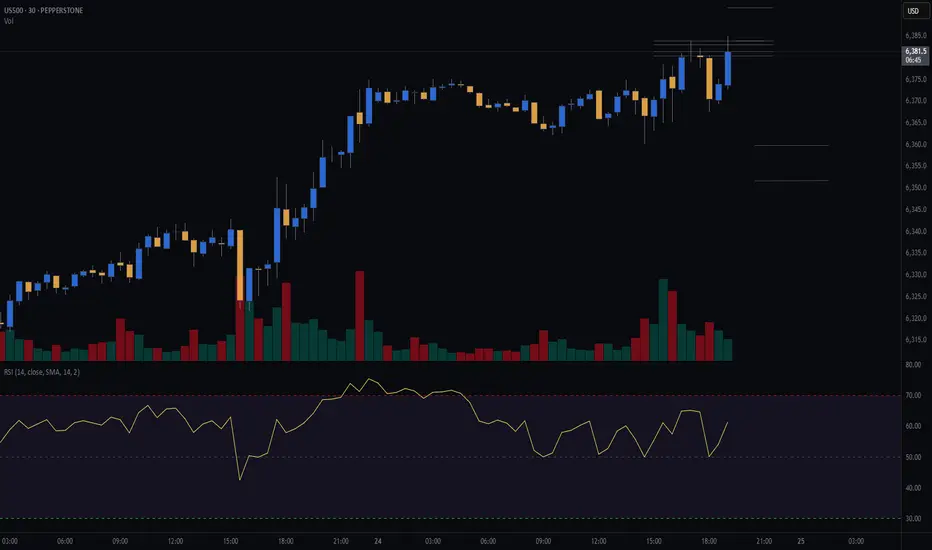
S&P 500 Counter-Trend Setup After Bullish Week US500Currently watching the S&P 500 (US500) closely 👀. The index has been in a strong bullish trend 📈, but I’m now evaluating a potential counter-trend opportunity.
Given the strength we’ve seen this week — possibly a “foolish rally” — there’s a chance we’ve either printed or are close to printing the high of the week 🧱. That opens the door for a retracement setup, particularly as we head into Monday’s open 🗓️.
🧠 Trade idea: If we get a bearish market structure break, I’ll be looking to enter short — targeting a 1R take profit initially, and holding a portion for a 2R–3R extension 🎯.
Friday sessions, especially after strong trends, often present clean intraday pullbacks — and when Monday’s low is set early, it can trap late buyers and fuel the move 📉.
⚠️ This is not financial advice — just sharing my thought process and trade plan.

Bulls and Bears zone for 07-28-2025Last week 4 out of 5 sessions S&P 500 made new ATH. However they were all trading within a tight range.
Level to watch: 6434---6436

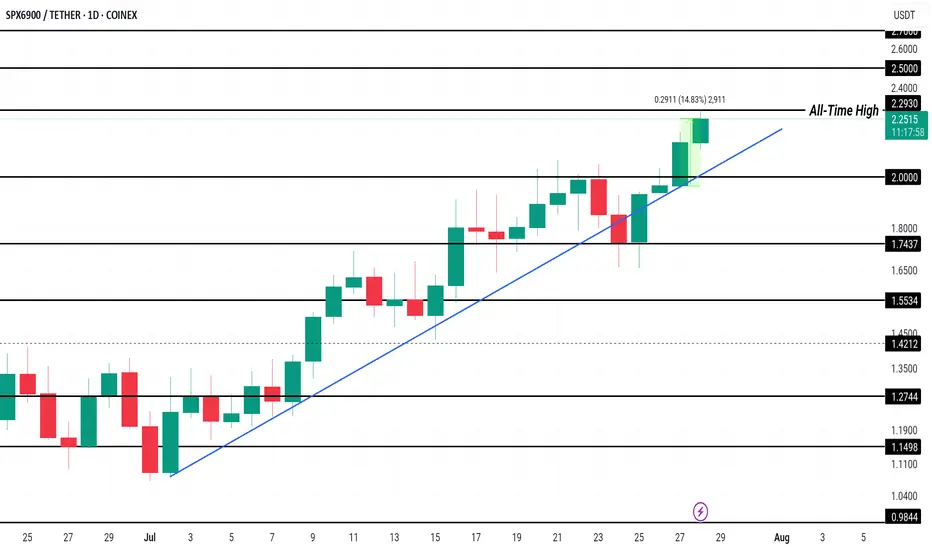
SPX Price Hits New All-Time High, $2.50 Up NextCOINEX:SPXUSDT has been experiencing a consistent uptrend since the beginning of the month, leading to the formation of multiple all-time highs, including one today at $2.27 . This price action reflects strong investor interest, pushing the altcoin to new levels and generating a positive market sentiment.
Currently trading at $2.23, COINEX:SPXUSDT has gained 14% in the past 24 hours . The Ichimoku Cloud, acting as support, signals bullish momentum. This suggests that SPX could rise further, with the potential to reach $2.50 or higher if market conditions remain favorable and investor confidence persists.
However, if selling pressure intensifies, COINEX:SPXUSDT could experience a reversal . A dip below the $2.00 support could push the altcoin toward $1.74 or lower, invalidating the bullish outlook.
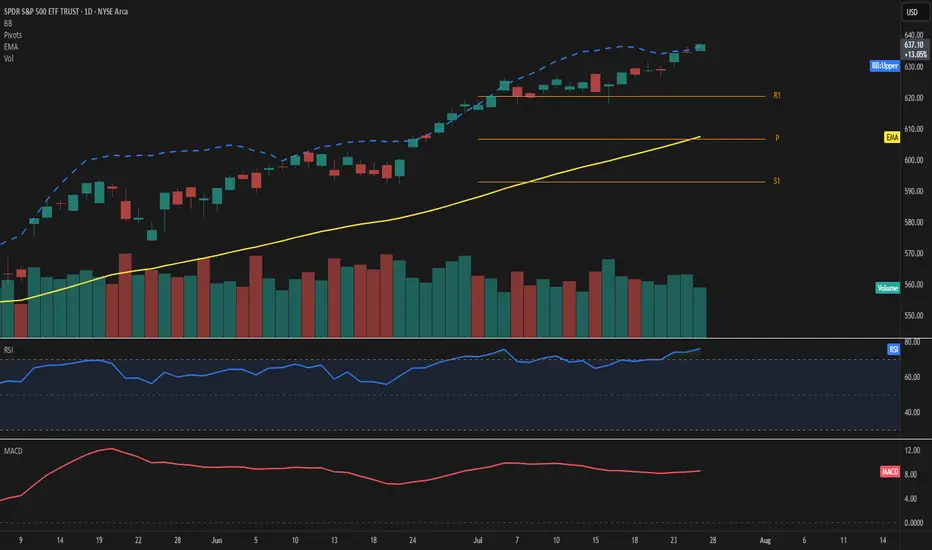
SPY – Explosive strength above resistancePrice extends well above the 50-day EMA and pierces through the upper Bollinger Band, highlighting strong bullish momentum. RSI stands at 76, confirming overbought conditions, while MACD remains firmly positive.
The ongoing move leaves the EMA50 at 608 and the Fibonacci pivot at 607—both now acting as key support levels. With R1 at 620 already surpassed, the next potential resistance zone lies in uncharted territory beyond 636.
Volume has decreased by over 20%, which tempers the move slightly and should be monitored closely.
As long as price holds above 620, the bullish scenario remains valid.
Watch for any sudden spike in volume or a drop back below 636 as a possible shift signal.
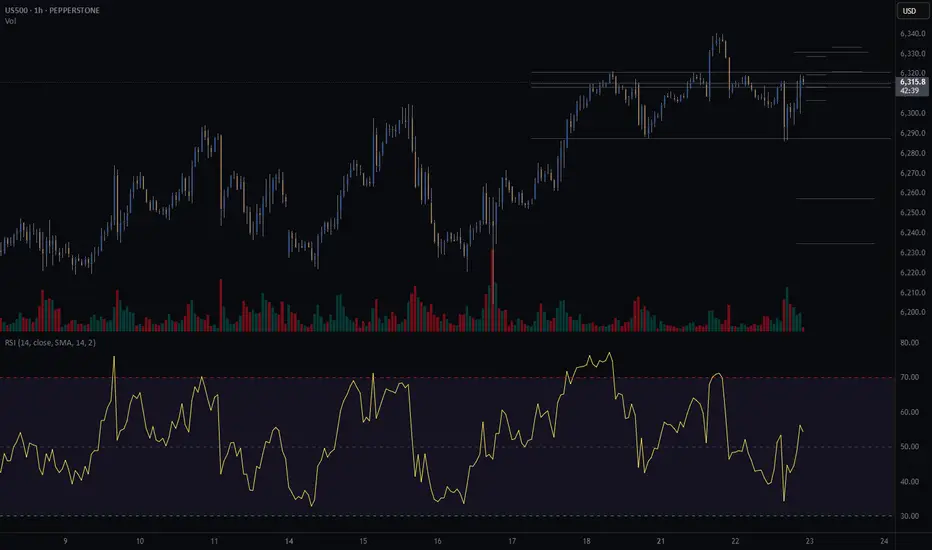
S&P 500 (CASH500) - Double Top H1Risk/reward = 2.7
Entry price = 6388.4
Stop loss price = 6399.7
Take profit level 1 (50%) = 6360.4
Take profit level 2 (50%) = 6352
Also, waiting on confirmation on some variables

S&P500 (CASH500) SHORT - head and shoulders 30minRisk/reward = 4.1
Entry price = 6378
Stop loss price = 6385.9
Take profit level 1 (50%) = 6349.2
Take profit level 2 (50%) = 6337.2
Still waiting on confirmation of a few variables at close of this 30min candle at 17.00

Can the S&P 500's Ascent Continue?The S&P 500 recently achieved unprecedented highs, reflecting a multifaceted market surge. This remarkable performance stems primarily from a robust corporate earnings season. A significant majority of S&P 500 companies surpassed earnings expectations, indicating strong underlying financial health. The Communication Services and Information Technology sectors, in particular, demonstrated impressive growth, reinforcing investor confidence in the broader market's strength.
Geopolitical and geostrategic developments have also played a crucial role in bolstering market sentiment. Recent "massive" trade agreements, notably with Japan and a framework deal with Indonesia, have introduced greater predictability and positive economic exchanges. These deals, characterized by reciprocal tariffs and substantial investment commitments, have eased global trade tensions and fostered a more stable international economic environment, directly contributing to market optimism. Ongoing progress in trade discussions with the European Union further supports this positive trend.
Furthermore, resilient macroeconomic indicators underscore the market's upward trajectory. Despite a recent dip in existing home sales, key data points like stable interest rates, decreasing unemployment claims, and a rising manufacturing PMI collectively suggest an enduring economic strength. While technology and high-tech sectors, driven by AI advancements and strong earnings from industry leaders like Alphabet, remain primary growth engines, some segments, such as auto-related chipmakers, face challenges.
The S&P 500's climb is a testament to the powerful confluence of strong corporate performance, favorable geopolitical shifts, and a resilient economic backdrop. While the immediate rally wasn't directly driven by recent cybersecurity events, scientific breakthroughs, or patent analyses, these factors remain critical for long-term market stability and innovation. Investors continue to monitor these evolving dynamics to gauge the sustainability of the current market momentum.
S&P (CASH500) SHORT - Double top 30minRisk/reward = 2.7
Entry price = 6384
Stop loss price = 6393.8
Take profit level 1 (50%) = 6359.8
Take profit level 2 (50%) = 6351.8
Will get confirmation of remaining variables at close of this 30min candle at 19.30.
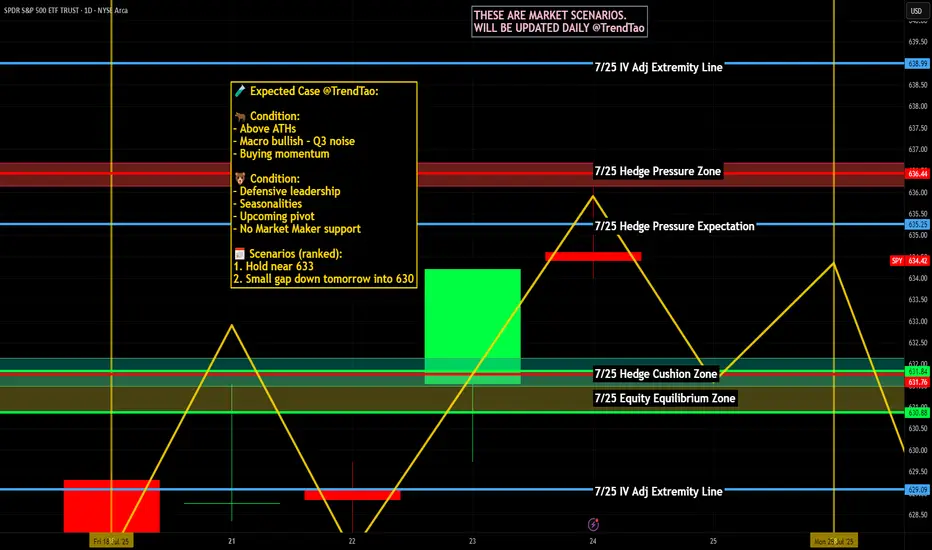
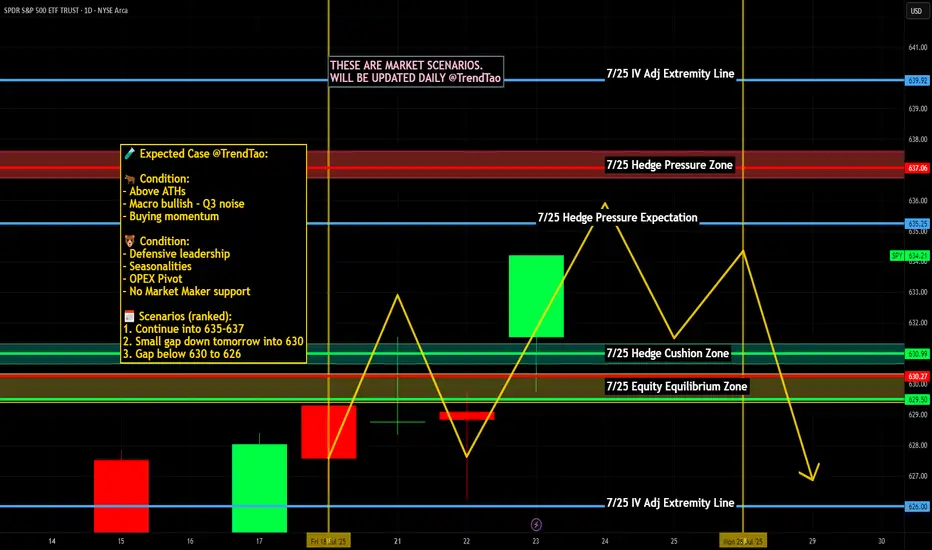
Nightly $SPY / $SPX Scenarios for July 25, 2025🔮 Nightly AMEX:SPY / CBOE:SPX Scenarios for July 25, 2025 🔮
🌍 Market‑Moving News 🌍
🏔️ Copper Market Flashpoint
Following President Trump’s announcement of steep copper tariffs (15–50% range), U.S. copper futures surged, then sharply reversed. Inventory arbitrage between CME and LME markets surged, distorting pricing dynamics and triggering concern over metal market stability.
🇪🇺 EU–China Summit Signals Trade Reset
EU leaders concluded their 25th summit with China, fostering deeper economic and strategic ties. Observers expect follow-up on mutual trade agreements, particularly regarding tech and sustainability sectors.
🌍 EM Equity Rally Consolidates Gains
Emerging markets continue to outperform global equities in 2025—with MSCI EM up ~18% vs. S&P 500. Analysts highlight strong opportunities in AI/fintech stocks in China and Latin America, suggesting further rotations out of U.S. markets.
📊 Key Data Releases & Events 📊
📅 Friday, July 25:
8:30 AM ET – Durable Goods Orders (June):
Forecast shows a sharp drop (~–10%), following a ~16% gain in May—signaling possible cooling in business-related equipment purchases.
10:00 AM ET – U.S. Imports of Steel Products (June):
Trade-data release monitoring steel flows amid evolving tariff frameworks.
All Day – Corporate Earnings Reports:
Companies such as First Financial Bancorp (FFBC), HCA, AON, Charter, and others report earnings. Outlooks may influence small- to mid-cap sentiment.
⚠️ Disclaimer:
This report is for educational and informational purposes only—not financial advice. Always consult a licensed financial advisor before making investment decisions.
📌 #trading #stockmarket #economy #data #earnings #commodities #EM #technicalanalysis
Bitcoin, SPX, Ethereum, Tesla: Whats Next? BTC appears to be showing distribution signs.
I do believe BTC local top is in, but alt coins like Ethereum can still push a bit higher.
Ethereum short around 3900-4000 looks promising
Tesla fell sharply on the back of cash flow burn and expenditures.
Investors are also fearful of sales decline and loss of EV credits.
SPX hit major long term resistance today. Coupling this with a depressed Vix we are likely setting up for a pullback in the market.
Small caps saw distribution today on the back of rising yields. A failed breakout observed on IWM chart.

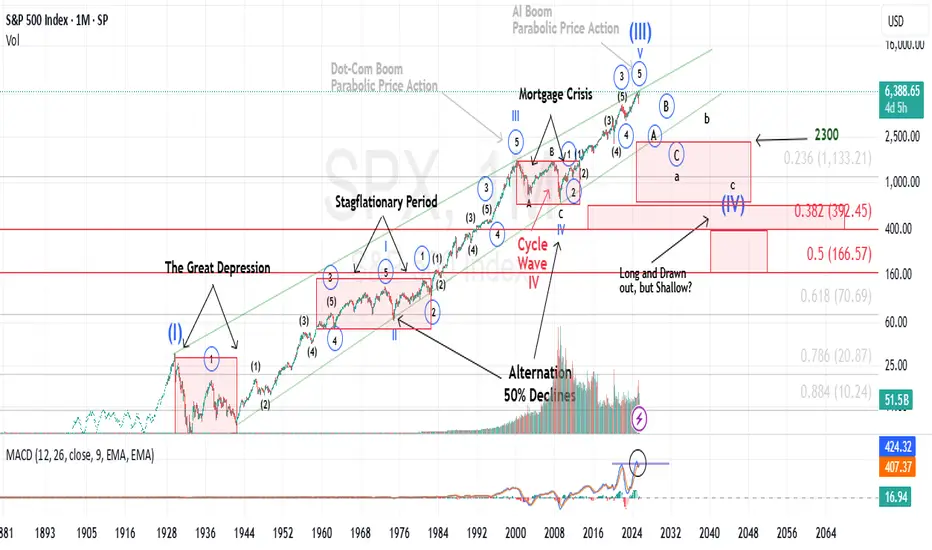
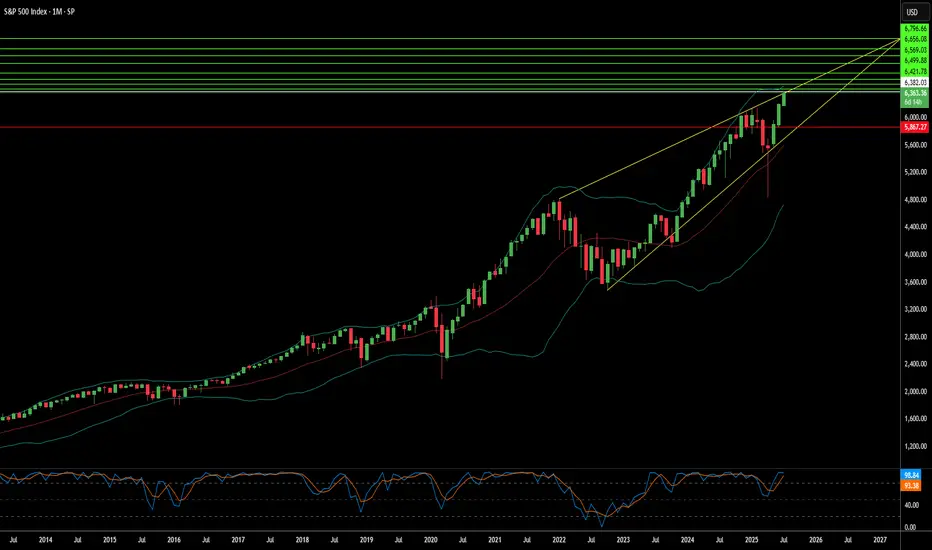
S&P500 This is why every CORRECTION is a GIFT.The S&P500 index (SPX) has been steadily rising since the April bottom to new All Time Highs (ATH). On the grand 100 year scale, the February - March tariff fueled correction, has been nothing significant. The last true technical correction has been the 2022 Inflation Crisis because it touched, and instantly rebounded on, the 1M MA50 (blue trend-line).
This is not the first time we bring forward our multi-decade perspective on stock and in particular this chart. But it serves well, keeping us into the meaningful long-term outlook of the market. This suggests that since the Great Depression and the first signs of recovery after the 1935 - 1941 Bear Cycle, the market has entered a multi-decade Channel Up, which is divided into long-term aggressive expansion periods (Bull Cycles) and shorter term depressions (Bear Cycles).
During a Bull Cycle, every test of the 1M MA50 is a instant cyclical buy opportunity and in fact that isn't presented very often. During a Bear Cycle, the market makes an initial aggressive correction below the 1M MA50, turns increasingly volatile for 5-7 years, trading sideways within the Channel Up with its second peak resulting into a 2nd correction that eventually breaks below the 1M MA200 (orange trend-line).
That is what we call a 'generational buy opportunity' as in the past 80 years, it has only been taken place 2 times.
Right now (again this is not something we mention for the first time), the market is at the start of the A.I. Bubble, with incredibly strong similarities with the Internet Bubble of the 1990s.
In fact, relative to the Internet Bubble, it appears that we are on a stage similar to 1993 - 1994, before the market turned parabolic to the eventual Dotcom Bust of 2000.
As a result, from a technical perspective, every 'small' correction such as the one we had this year, is a blessing in disguise (buy opportunity). As the index grew by 5 times during the Internet Bubble (300 to 1500), it is also very possible to see it approach this feat going from roughly 3500 (late 2022) to 14000 (by late 2032) and touch the top of the multi-decade Channel Up.
Are you willing to miss out on this generational wealth creation opportunity?
-------------------------------------------------------------------------------
** Please LIKE 👍, FOLLOW ✅, SHARE 🙌 and COMMENT ✍ if you enjoy this idea! Also share your ideas and charts in the comments section below! This is best way to keep it relevant, support us, keep the content here free and allow the idea to reach as many people as possible. **
-------------------------------------------------------------------------------
💸💸💸💸💸💸
👇 👇 👇 👇 👇 👇

Extended rally off April lows should be completing imminentlyEvery so often, a market move defies conventional expectations of retracement—and the rally off the Liberation Day lows is exactly that. It’s extended longer and climbed higher than even the most bullish forecasts imagined in early April. No one remembers the calls for an imminent recession by most large Wall Street firms.
Now, we're pushing into yet another all-time high—despite glaring negative MACD divergence and a financial media landscape that’s nothing short of euphoric.
The narratives being pushed? Honestly, it’s hard to write them with a straight face:
Tariffs are no longer inflationary. Apparently, I wasted time and tuition learning international trade theory and macroeconomics. Who knew deficits and trade imbalances didn’t matter anymore? Who pays tariffs again? ...never mind.
Weak momentum since mid-May signals not exhaustion—but an “unhealthy absence” of institutional selling, which apparently means the retail trader is in full control now. Because that always ends well... right?
S&P 500 (CASH 500) SHORT - Double top H8Risk/reward = 4.1
Entry price = 6343.3
Stop loss price = 6365.3
Take profit level 1 (50%) = 6268.1
Take profit level 2 (50%) = 6232.1
Still waiting on some variables on checklist to be confirmed before I enter the trade.

Nightly $SPY / $SPX Scenarios for July 24, 2025🔮 Nightly AMEX:SPY / SP:SPX Scenarios for July 24, 2025 🔮
🌍 Market-Moving News 🌍
🤝 U.S.–EU & U.S.–Japan Trade Optimism Lifts Sentiment
The S&P 500 and Nasdaq hit record-high closes on July 23, fueled by optimism over a potential U.S.–EU trade deal mirroring the U.S.–Japan framework, with the EU-set tariff on autos potentially halved to 15%
💵 Dollar Retreats, Yields Climb
As markets shifted toward risk assets, U.S. Treasury yields increased and gold softened, while the dollar eased—highlighting growing confidence in trade-driven growth news
🏦 Fed Independence Under Pressure—But No July Cut Expected
A Reuters poll shows economists see heightened political pressure on the Fed jeopardizing its independence, though the consensus remains that rates will stay unchanged this month
📊 Key Data Releases & Events 📊
📅 Thursday, July 24:
8:30 AM ET – Initial Jobless Claims
Weekly tally of new unemployment benefit applications—key indicator of labor-market conditions.
10:00 AM ET – New Residential Sales (June)
Tracks signed contracts for new homes, offering insight into housing demand under tightening mortgage rates.
All Day – Trade Headlines & Fed Watch
Continued focus on U.S.–EU trade developments and any follow-up to Fed independence concerns from policy circles.
⚠️ Disclaimer:
This information is for educational and informational purposes only—not financial advice. Please consult a licensed financial advisor before making investment decisions.
📌 #trading #stockmarket #trade #economy #Fed #housing #jobs #technicalanalysis
S&P500 (CASH500) SHORT - Head and shoulders Risk/reward = 5.8
Entry price = 6321.1
Stop loss price = 6333.5
Take profit level 1 (50%) = 6257.3
Take profit level 2 (50%) = 6234.9
Still waiting for confirmation on a few variables before I enter the trade.