April 17, 2025 - Powell, Japan & TrumpHello everyone, it’s April 17, 2025. Yesterday’s U.S. trading was pure market carnage. Semiconductors ( NASDAQ:NVDA , NASDAQ:AMD , NASDAQ:ASML ) were steamrolled as AI chip bans to China kicked in and Trump dropped another tariff bomb, hiking duties to 245%. That wiped $200 billion off Nvidia alone.
In Chicago, Powell stoked the flames, warning tariffs will fuel inflation and choke growth, and insisted he’s in no rush to cut rates. The CME_MINI:NQ1! tumbled 3%, the CME_MINI:SOX1! lost 4.1%, and bond futures plunged.
This morning, U.S. futures are up about 0.75% on headlines that Trump’s talks with Japanese negotiators are “going very well,” sparking rallies across Asia: Nikkei +1%, Hong Kong +2.7%, Shanghai +1%. It seems even a whiff of détente with Japan sends everyone scrambling back into risk assets.
On commodities, BLACKBULL:WTI jumps to $63.35 amid fresh U.S. sanctions on Iran and OPEC output cuts; OANDA:XAUUSD rockets to $3,352 /oz; INDEX:BTCUSD hovers near $83,500.
Today watch the ECB’s rate cut, Powell’s next speech, Philly Fed and jobless claims before the Good Friday shutdown. With Trump’s erratic tariff theatrics and Powell’s warning of higher inflation and slower growth, volatility is set to reign supreme. Buckle up.
SPX (S&P 500 Index)

Nightly $SPY / $SPX Scenarios for April 17, 2025🔮 🔮
🌍 Market-Moving News 🌍:
🇪🇺 ECB Expected to Cut Rates Amid Trade Pressures: The European Central Bank is anticipated to reduce its deposit rate by 25 basis points to 2.25% during its meeting on April 17. This expected move aims to counteract the economic impact of recent U.S. tariffs and a strengthening euro, which have contributed to disinflationary pressures in the eurozone.
📉 German Inflation Decline Supports Easing: Germany's inflation rate fell more than expected in March, dropping to 2.3% from 2.6% in February. This decline, driven by falling oil prices and a sluggish economy, bolsters the case for further interest rate cuts by the ECB.
🤖 AI Enhances ECB Policy Predictions: A study by the German Institute for Economic Research indicates that artificial intelligence significantly improves the accuracy of forecasting ECB monetary policy decisions. By analyzing ECB communications, AI models can better anticipate policy shifts.
📊 Key Data Releases 📊
📅 Thursday, April 17:
🏠 Housing Starts (8:30 AM ET):
Forecast: 1.420 million
Previous: 1.501 million
Indicates the number of new residential construction projects begun, reflecting housing market strength.
🏭 Philadelphia Fed Manufacturing Survey (8:30 AM ET):
Forecast: 3.7
Previous: 12.5
Measures manufacturing activity in the Philadelphia region, providing insights into sector health.
📈 Initial Jobless Claims (8:30 AM ET):
Forecast: 223,000
Previous: 223,000
Reports the number of individuals filing for unemployment benefits for the first time, reflecting labor market conditions.
⚠️ Disclaimer: This information is for educational and informational purposes only and should not be construed as financial advice. Always consult a licensed financial advisor before making investment decisions.
📌 #trading #stockmarket #economy #news #trendtao #charting #technicalanalysis


Bulls and Bears zone for 04-16-2025Earlier this week S&P 500 has formed a Death Cross which could be significant or not only time will tell.
Any test of yesterday's Close could provide direction for the day.
Level to watch: 5354 --- 5356
Reports to watch:
U.S. Housing Market Index at 10:00AM EST
U.S. Jerome Powell Speaks at 1:30PM EST

A Wolfe Wave? Maybe. Another Win? Definitely. | SPX Analysis 16 What do you call it when you wake up, sip your tea, and realise the market is exactly where you thought it would be?
Answer: another day following the damn plan.
Yesterday’s price action? Snooze city. But tucked away inside that inside day was a lovely little income win, all thanks to those glorious GEX levels we’ve had our eyes glued to for weeks. 5400/5425 was once again the no-go zone. SPX tiptoed up, chickened out, and reversed politely on cue.
While retail traders yawned or second-guessed, we quietly hit our numbers. Again.
And while the surface was calm, beneath the charts... something’s stirring.
---
🎯 "Same Setup. Same Result."
Some traders chase action. We wait for systematic decision-making framework.
While the masses complained about a boring market day, we snagged another payday. The setup was textbook: resistance at 5400/5425, backed by GEX, ADD extremes, and the ol’ "...oh and..." wedge-in-the-making.
Throw in a mechanical bear Tag 'n Turn and we were go for launch.
The overnight futures have started to crack the two-day range. One of the perks of short-dated expirations? You don't need massive moves - just a push in your direction, and the premium does the work for you.
And here's a wildcard for your "...oh and..." notebook:
👀 Possible Wolfe Wave forming. If valid, we could be looking at a gravity slide down to 5000.
Is it the holy grail? Nah. But if it lines up with pulse bars and structure, I’ll be ready.
---
GEX Analysis Update
5425 again
🎓 Expert Insight – "Pattern First, Prediction Later"
Common Trading Mistake: Jumping on a trade just because the news made your pulse spike.
Fix It: Let your levels do the talking. GEX, ADD, Tag 'n Turns… the market leaves breadcrumbs. Follow those, not the headlines.
Don’t predict. React with structure.
Trade setups, not emotions.
Repeat winners are born from repeatable processes.
---
🤓 Fun Market Fact
The Wolfe Wave pattern is named after Bill Wolfe and is often misunderstood as some esoteric mystery. But really? It’s just a glorified channel break with attitude.
It projects a reversal target based on converging trendlines, often in five-wave structures. The magic? The final wave usually slams to a specific line, called the EPA/ETA - and can happen quickly if volatility kicks in.
Most people don’t spot it until it’s too late. But if you know what to look for, it becomes a spicy tool in the AntiVestor arsenal. 🐺📉
Happy trading,
Phil
Less Brain, More Gain
…and may your trades be smoother than a cashmere codpiece

SPY Weekly Options Trade Plan 2025-04-15AMEX:SPY SPY Weekly Analysis Summary (2025-04-15)
Below is an integrated view of the models’ findings:
─────────────────────────────
SUMMARY OF MODEL KEY POINTS
• Grok/xAI noted that on very short timeframes the price is a bit below key 5‑minute EMAs and near lower Bollinger Bands—with RSI and MACD giving mixed signals—but on the daily chart some bullish features (price above the 10‑EMA, a slight MACD bullish grace, and a max pain level at $549) hint at a potential mean reversion. Their “if forced” ramp suggested a call at the $549 strike, though overall confidence was low (≈55%).
• Gemini/Google’s report highlighted conflicting technical readings – the M5 setup looked bearish while the daily chart showed a little bullishness. Their integration of high but falling VIX and options open‑interest levels led to an overall neutral/unclear reading. Their recommendation was to refrain from entering a directional trade at open.
• Llama/Meta leaned toward a moderately bearish reading based on the short‐term indicators (price below key EMAs, bearish MACD on both charts) despite some daily support. They specifically recommended buying the $537 put option (even though the premium is higher than the “ideal” $0.30–$0.60 range) with a target profit roughly 50% above the cost and a stop when SPY breaches an upper resistance level—backed by a 70% confidence level.
• DeepSeek also synthesized mixed timeframes – pointing out that while the market holds some daily support, the intraday picture is muddled by technical conflict, expensive premium costs for the moves required, and time decay factors. Their view was to wait rather than initiate a new position.
─────────────────────────────
2. AREAS OF AGREEMENT AND DISAGREEMENT
• Agreement: All reports recognize that SPY (about $537.61) is trading near key short‑term support levels with significant options OI clustering. The falling VIX is universally noted as a positive sign for reducing fear even though overall volatility remains high.
• Disagreement:
– Grok’s report and to some extent the daily charts hint at a slight bias to the upside (supported by max pain at $549), suggesting a potential call wing trade.
– In contrast, Llama/Meta’s analysis and the very short‐term indicators (M5, lower Bollinger band, bearish MACD) point toward a bearish bias, recommending a put trade.
– Both Gemini/Google and DeepSeek, however, find the technical signals too mixed to have high confidence in initiating any naked single‑leg weekly option trade at open.
─────────────────────────────
3. CLEAR CONCLUSION
• Overall Market Direction Consensus:
The models collectively paint a picture of uncertainty. There is no clear, high‑conviction directional bias at the open. The short‑term (intraday) technicals lean bearish or at best neutral, while the daily chart and max pain argument hint at a potential slight mean reversion. Given these conflicting signals, the overall market direction remains neutral/unclear.
• Recommended Trade:
Based on the clash in opinions—only one model (Llama/Meta) would go short (with puts) while two models (Grok/xAI and Llama/Meta) suggest if forced a trade—and given that the majority (Gemini/Google and DeepSeek) advise against trading in the current conditions, the consensus is not to enter a new weekly options position at the market open.
– Strategy: Single‐leg, naked options (calls or puts)
– Expiration: Weekly options only (expiry April 17, 2025)
– Premium: Trading ideal premium range is $0.30–$0.60, but neither candidate in the call nor put space meets all our criteria with high conviction
– Entry Timing: At open would be the plan if a trade were to be placed
– Confidence: Overall confidence in any trade is low (<60%)
• Key Risks and Considerations:
– The short‑term technical indicators (lower EMAs, bearish M5 MACD, tight Bollinger bands) could trigger a whipsaw if SPY moves sideways or reverses abruptly.
– The high but falling VIX signals that although volatility is subsiding, levels remain elevated.
– Time decay (theta) on weekly options is significant at the open, and the probability of a strong directional move is diminished without further confirmation during the session.
– Conflicting signals between daily trend (some bullish pointers) and intraday behavior reduce the reliability of a directional play.
─────────────────────────────
4. FINAL RECOMMENDATION
Given the model consensus with mixed and conflicting signals, the recommendation is to NOT trade weekly SPY options at market open today.
─────────────────────────────
TRADE_DETAILS (JSON Format)
{
"instrument": null,
"direction": null,
"strike": null,
"expiry": null,
"confidence": null,
"profit_target": null,
"stop_loss": null,
"size": null,
"entry_price": null,
"entry_timing": null
}
Disclaimer: This newsletter is not trading or investment advice but for general informational purposes only. This newsletter represents my personal opinions based on proprietary research which I am sharing publicly as my personal blog. Futures, stocks, and options trading of any kind involves a lot of risk. No guarantee of any profit whatsoever is made. In fact, you may lose everything you have. So be very careful. I guarantee no profit whatsoever, You assume the entire cost and risk of any trading or investing activities you choose to undertake. You are solely responsible for making your own investment decisions. Owners/authors of this newsletter, its representatives, its principals, its moderators, and its members, are NOT registered as securities broker-dealers or investment advisors either with the U.S. Securities and Exchange Commission, CFTC, or with any other securities/regulatory authority. Consult with a registered investment advisor, broker-dealer, and/or financial advisor. By reading and using this newsletter or any of my publications, you are agreeing to these terms. Any screenshots used here are courtesy of TradingView. I am just an end user with no affiliations with them. Information and quotes shared in this blog can be 100% wrong. Markets are risky and can go to 0 at any time. Furthermore, you will not share or copy any content in this blog as it is the authors' IP. By reading this blog, you accept these terms of conditions and acknowledge I am sharing this blog as my personal trading journal, nothing more.

DXY Bounce Should Yield a Great Buy in Metalsestimated time frame 1-2 weeks to begin a ~1 month correction to a level we have not seen in a while

Nightly $SPY / $SPX Scenarios for April 16, 2025🔮 🔮
🌍 Market-Moving News 🌍:
🗣️ Federal Reserve Speeches: Federal Reserve Chair Jerome Powell is scheduled to speak at 1:30 PM ET, providing insights into the economic outlook and potential monetary policy adjustments. Additionally, Cleveland Fed President Loretta Mester will speak at 12:00 PM ET, and Kansas City Fed President Jeffrey Schmid and Dallas Fed President Lorie Logan will speak at 7:00 PM ET.
📊 Key Data Releases 📊
📅 Wednesday, April 16:
🛍️ Retail Sales (8:30 AM ET):
Forecast: +1.2%
Previous: +0.2%
Measures the total receipts of retail stores, reflecting consumer spending trends.
🏭 Industrial Production (9:15 AM ET):
Forecast: -0.1%
Previous: +0.7%
Indicates the output of the nation's factories, mines, and utilities.
🏠 Homebuilder Confidence Index (10:00 AM ET):
Forecast: 37
Previous: 39
Assesses the confidence of homebuilders in the market for newly built single-family homes.
⚠️ Disclaimer: This information is for educational and informational purposes only and should not be construed as financial advice. Always consult a licensed financial advisor before making investment decisions.
📌 #trading #stockmarket #economy #news #trendtao #charting #technicalanalysis

April 15th Trade Journal & Stock Market AnalysisEOD accountability report: +940
Sleep: 8 hour, Overall health: Good
**Daily Trade Recap based on VX Algo System **
9:30 AM Market Structure flipped bullish on VX Algo X3! - easy money
10:10 AM VXAlgo ES X1 Sell Signal - easy money
1:02 PM Market Structure flipped bearish on VX Algo X3! - easy money
1:40 PM VXAlgo ES X1 Buy signal (triple signal) -a bit tuff but still work out
3:30 PM VXAlgo ES X1 Sell Signal (double signal) - a bit tuff but still work out
**Wed plan: ** Watch for 48M support or 195M support to tag around 5200-5300s.

S&P500 1D Death Cross formed! Market COLLAPSE or Bear TRAP? The S&P500 index (SPX) is attempting to recover from the April 07 2025 market low, following the 90-day Tariff pause.
Last Thursday however it formed a Death Cross on the 1D time-frame, he first since May 11 2022, which was during the last Inflation Crisis correction. That was nothing like the current crash though as it was a technical 1-year Bear Cycle in contrast to today which is a flash crash inflicted by Trump's tariffs.
What looks though most similar to today is the 2020 COVID crash. Equally fast and brutal, that sell-off also took place under an extreme pressure environment of uncertainty (economic lockdowns) which the world has never seen, similar to today's tariffs that admittedly have put (for the moment) an end to the U.S. - China trade.
The COVID crash phase also formed a 1D Death Cross just 4 days after the March 23 2020 bottom. Last Thursday's 1D Death Cross came also just 3 days after the April 07 2025 Low. If this pattern of extreme market shock is a repetitive model under such fundamental events, then the stock market has bottomed. And if it follows the exact same recovery pattern as post-COVID, then it may reach the 1.1 Fibonacci extension at 6300 in a little over 5 months (162 days).
-------------------------------------------------------------------------------
** Please LIKE 👍, FOLLOW ✅, SHARE 🙌 and COMMENT ✍ if you enjoy this idea! Also share your ideas and charts in the comments section below! This is best way to keep it relevant, support us, keep the content here free and allow the idea to reach as many people as possible. **
-------------------------------------------------------------------------------
Disclosure: I am part of Trade Nation's Influencer program and receive a monthly fee for using their TradingView charts in my analysis.
💸💸💸💸💸💸
👇 👇 👇 👇 👇 👇

Historical co-relation of VIX and SPXWhen VIX hit all time high and retraced below 35, it is a good indicator of the start of a bull run

Nightly $SPY / $SPX Scenarios for April 15, 2025🔮 🔮
🌍 Market-Moving News 🌍:
🏦 Major Bank Earnings: Bank of America (BAC) and Citigroup (C) are set to report Q1 earnings before the market opens. BAC is expected to post an EPS of $0.81, while Citigroup anticipates $1.84. Investors will closely watch these reports for insights into the financial sector's health amid ongoing market volatility.
💊 Healthcare and Consumer Goods Reports: Johnson & Johnson (JNJ) is also scheduled to release its earnings, with forecasts indicating an EPS of $2.57. These results will provide a glimpse into the performance of the healthcare and consumer goods sectors.
📊 Key Data Releases 📊
📅 Tuesday, April 15:
📈 Import Price Index (8:30 AM ET):
Forecast: +0.1%
Previous: +0.4%
Measures the change in the price of imported goods, indicating inflationary pressures.
🏭 Empire State Manufacturing Survey (8:30 AM ET):
Forecast: -10.0
Previous: -20.0
Assesses manufacturing activity in New York State, providing early insights into industrial performance.
🗣️ Fed Governor Lisa Cook Speaks (7:10 PM ET):
Remarks may offer perspectives on economic developments and policy considerations.
⚠️ Disclaimer: This information is for educational and informational purposes only and should not be construed as financial advice. Always consult a licensed financial advisor before making investment decisions.
📌 #trading #stockmarket #economy #news #trendtao #charting #technicalanalysis

April 14th Trade Journal & Market AnalysisApril 14th Trade Journal & Market Analysis
EOD accountability report: +565
Sleep: 6 hour, Overall health: recovering, cant seem to get over 6 hour sleep.
**Daily Trade Recap based on VX Algo System **
9:30 AM VXAlgo ES X1 Sell Signal (triple sell signal)
9:41 AM Market Structure flipped bearish on VX Algo X3
11:02 AM Market Structure flipped bullish on VX Algo X3!
12:20 PM VXAlgo ES X1 Buy signal (Triple buy signal)
2:11 PM Market Structure flipped bullish on VX Algo X3!
3:20 PM VXAlgo ES X1 Sell Signal (triple sell again)
Today traded inside the zone, tested the 10min MA from the other day, held very well and bounced strong.
Bot alerts were on fire today.
Tuesday plan: Look for a backtest to support again on 48 min and push up to the MOB.

S&P500: Bottom is in. 5,800 Target imminent.S&P500 is almost neutral on its 1D technical outlook (RSI = 44.927, MACD = -131.940, ADX = 29.116) as it has recovered from the tariff selloff, finding support a little over the 1W MA200. The 1D RSI made a double bottom and is much like the October 27th 2023 bottom. Both DB bullish divergences in contrast to the LL of the price. The immediate target on the rebound that followed in 2023 was the R1 level. Trade: long, TP = 5,800.
## If you like our free content follow our profile to get more daily ideas. ##
## Comments and likes are greatly appreciated. ##

SPX Fractal Expansion: New Highs Ahead Despite FearAs of April 14, 2025, the CBOE:SPX is exhibiting a clear fractal expansion, suggesting the beginning of a new bullish leg. The recent correction, which caused widespread panic, appears to have completed a fractal cycle reset, with price respecting historical support near 4704 and forming a new fractal edge around 5300.
Despite the fear-driven selloff, momentum indicators like RSI and MACD show signs of bottoming, and volume surged on rebound days, confirming strong institutional buying. The price is now testing temporary resistance at 5878, with a path open to reclaim all-time highs (6100+).
Global & Technical Tailwinds
Technical momentum is recovering across timeframes, with positive divergence on stochastic oscillators.
Breadth is improving: More stocks are participating in the rally, reflecting internal strength.
Sentiment has flipped: The VIX has cooled from panic levels (above 45), and investor fear is easing.
Macro support: Inflation is declining, and central banks are signaling potential rate cuts by late 2025.
Earnings outlook remains solid, and analysts forecast SPX to end 2025 around 6500–7100.
🔍Conclusion
The SPX is carving out a fractal mirror of past bullish reversals, reinforced by strong macro and technical context. Barring unexpected shocks, the index is likely to break above resistance and push toward new highs, even as residual fear lingers. The setup favors buying dips within this emerging structure.

SPY LONG SET UP(BUY THE DIP)Entry 1 $500.00
Entry 2 $460.00
Stop loss $440.00
Take profit 1- $550.00
(Close 25%)
Take profit 2- $600.00
(Close 50%)
Take profit 3-$650.00
(Close 75%)
Take profit 4-$700.00
(Close 100%)

14/04/25 Weekly OutlookLast weeks high: $86,116.94
Last weeks low: $74,520.92
Midpoint: $80.318.93
Did we truly think it would be easy? As Trump targets China the markets panicked in a huge de-risking event that sent BTC down to $74,500, fully retracing the Us election pump 6 months ago. After a double bottom and a tariff pause for 90 days on those countries that played ball, BTC reclaimed the previous weeks bottom and steadily climbed back toward major resistance at $86,000.
Clearly the focus has primarily been on traditional markets like the SPX & DJI, on the SPX the 1D 200 EMA tagged and as usual gave huge support, this is very often a local bottom and so far that is the case. BTC has very quietly flipped the 4H 200 EMA after the 10th time of trying, staying above the $84,000 level would be a confirmed reclaim if the trend can follow and flip bullish. If that is the case then it would seem the flush we've all been dreading is over, however, if Trump escalates the trade war once again then TA takes a back seat to FA once again.
This week I would like to see strong support at 0.75 line, a wick down to that level and a reclaim of the 4H 200 EMA would give me confidence that BTC can target the $91K mini range top. A loss of the 0.75 line and acceptance below I would then target weekly lows once again for a triple bottom.

Tariff Exemptions Stir the Bounce | SPX Analysis 14 April 2025It’s Monday… and the markets are once again dancing like a puppet on a tweet-fuelled string.
One minute, tariff fears.
The next, selective exemptions for “favourites.”
Now the weekend’s over and futures are bouncing higher like none of it happened.
SPX looks set to test – or break – the 5400 bull trigger, and if you’ve been following the last few newsletters, you’ll know that’s a big one.
We’ve mapped it.
We’ve rejected it.
Now we’re staring it down… again.
---
The 5400 Line Returns
Let’s back up.
5400 has been my bull/bear trigger for weeks.
When we’re below it, I’m hunting bear swings.
Above? I start reassessing bullish setups, GEX bulls-eye trades, and pullback long entries.
This week, the GEX flip is also sitting around 5400.
That’s no coincidence.
It’s now more than just a price level –
It’s the emotional fault line between headline-driven panic and headline-driven hope.
So… do we flip bullish?
Not so fast.
Strategy: Structure First, Narrative Second
Just because futures are up doesn’t mean momentum is back.
We’ve seen far too many fakeouts, tweet-spikes, and algorithm blinks to trust the first move on a Monday.
That’s why my plan is simple this week:
✔️ 5400 is still the decision line
✔️ No aggressive trades until price confirms
✔️ Will adapt only if structure shifts – not just sentiment
This week isn’t about swinging for the fences.
It’s about precision. Patience. And setup clarity.
Behind the Charts: Tinkering, Rebuilding, Refining
While the markets work out their next identity crisis, I’m taking the time to:
Optimise my new charting layout
Tweak + update my indicator codebases
Re-align my tools for speed and efficiency
Because if the market wants to act like a circus,
I’ll tighten the tent and sharpen the knives.
---
Expert Insight – Don’t Rush the Flip
Common mistake:
Flipping long just because futures are green.
Fix:
Use anchored levels like 5400 as your decision points – and only flip bias when structure confirms.
GEX flips, pulse bars, and price action matter.
Tweets do not.
---
Fun Fact
Did you know?
In 2023–2024, over 60% of intraday SPX rallies over 1.5% failed to hold past 2 days when triggered by political headlines.
Translation?
Headline rallies are easy to sell into – unless they’re confirmed by price.

$SPX: Rising WedgeSPX looking a bit tight, possibly a rising wedge?
Tariff news has been such a wash up. Tariffs on/Tariffs off. A lot of moving pieces and indecision. If the news is false regarding electronics not included, then markets can possibly take a downturn.
Green ray is my entry, I’m looking for a short. But tbh, any one word “positive” said can move things up and fill the gap above.
I’m going to bias short. Let’s see what the week brings.
SP:SPX AMEX:SPY NASDAQ:TSLA NASDAQ:NVDA

MARA Holdings, Inc.: Your Altcoin ChoiceThis is obviously not an Altcoin but it was requested in the Altcoin Choice session that we did recently, so here is the analysis.
MARA Holdings, Inc. (MARA) . It looks good.
A long-term higher low has been established. MARA produced a low first in October 2023. This was followed by a series of swings and waves. Reaching the later part of 2024, the action turned full bearish and now in April 2025 MARA Holdings seems to be ready to go bullish again. And here the stock printed a higher low.
A long-term higher low will lead to a long-term higher high. The last peak happened in February 2024 at 34.09. The next higher high at 42.86 is an easy one and should happen in 2025. It can definitely go higher but I am no stocks expert so can't dig any deeper for you.
In support of these signals, I looked for the RSI and found a small bullish divergence. It is only a month old but it is still a bullish divergence and it is valid. The reading on the RSI is also good and supports a new wave of growth. It seems Crypto and the stock market are now one.
Trading volume is standard and average and does not support our bullish bias, but it doesn't negate either. Average volume with no change on the upside or downside supports a neutral market. A market on autopilot. If there was a bearish move this bearish move is not strong as it is not supported by volume. So the early reversal signals can be good as there is nothing to hold the bearish wave. Things can change, but we are not talking about that, we are looking at the chart and what it currently says.
The chart is saying that MARA can start to grow in the coming weeks and days. If this growth develops, it can last months and end up in a new high, a higher high based on the long-term.
Thank you for reading and for your continued support.
Namaste.

Weekly $SPY / $SPX Scenarios for April 14–17, 2025🔮 🔮
🌍 Market-Moving News 🌍:
🏦 Major Financial Earnings Reports: This week, investors will focus on earnings from prominent financial institutions, including Goldman Sachs, Bank of America, and Citigroup. These reports will provide insights into the financial sector's health amid recent market volatility.
📺 Tech and Healthcare Earnings: Key tech and healthcare companies such as Netflix, TSMC, and UnitedHealth Group are also scheduled to release earnings. Analysts will scrutinize these reports for indications of sector performance and future outlooks.
🏠 Housing Market Indicators: The release of housing starts data and a homebuilder confidence survey will shed light on the housing sector's response to recent economic conditions and tariff implementations.
🇪🇺 European Central Bank Meeting (April 17): The ECB is expected to address recent tariff developments and may announce interest rate decisions in response to economic pressures.
📊 Key Data Releases 📊
📅 Monday, April 14:
🗣️ Philadelphia Fed President Patrick Harker Speaks (6:00 PM ET): Insights into regional economic conditions and monetary policy perspectives may be provided.
🗣️ Atlanta Fed President Raphael Bostic Speaks (7:40 PM ET): Remarks may offer perspectives on economic developments and policy considerations.
📅 Tuesday, April 15:
📈 Import Price Index (8:30 AM ET):
Forecast: +0.1%
Previous: +0.4%
Measures the change in the price of imported goods, indicating inflationary pressures.
🏭 Empire State Manufacturing Survey (8:30 AM ET):
Forecast: -10.0
Previous: -20.0
Assesses manufacturing activity in New York State, providing early insights into industrial performance.
📅 Wednesday, April 16:
🛍️ Retail Sales (8:30 AM ET):
Forecast: +1.2%
Previous: +0.2%
Indicates consumer spending trends, a primary driver of economic growth.
🏭 Industrial Production (9:15 AM ET):
Forecast: -0.2%
Previous: +0.7%
Measures the output of factories, mines, and utilities, reflecting industrial sector health.
🏠 Homebuilder Confidence Index (10:00 AM ET):
Forecast: 38
Previous: 39
Gauges builder sentiment in the housing market, indicating construction activity trends.
📅 Thursday, April 17:
📈 Initial Jobless Claims (8:30 AM ET):
Forecast: 223,000
Previous: --
Reports the number of individuals filing for unemployment benefits for the first time, reflecting labor market conditions.
🏠 Housing Starts (8:30 AM ET):
Forecast: 1.41 million
Previous: 1.5 million
Tracks the number of new residential construction projects begun, indicating housing market strength.
🏭 Philadelphia Fed Manufacturing Survey (8:30 AM ET):
Forecast: 3.7
Previous: 12.5
Measures manufacturing activity in the Philadelphia region, providing insights into sector health.
🏦 European Central Bank Interest Rate Decision: The ECB will announce its interest rate decision, with markets anticipating a potential cut in response to tariff impacts.
⚠️ Disclaimer: This information is for educational and informational purposes only and should not be construed as financial advice. Always consult a licensed financial advisor before making investment decisions.
📌 #trading #stockmarket #economy #news #trendtao #charting #technicalanalysi

SPX: the absurdity of tariffsTariffs-narrative continues to shape the sentiment of investors on the US equity markets. The high volatility continues to be the predominant way of price movements, ranging from deep pessimism to higher optimism. The reality is that no one is sure what to trade and in which direction. Markets are extremely unhappy in times of high uncertainty, like the tariff-time currently is. Another week with extreme moves is behind the market. The S&P 500 reached the lowest weekly level at 4.840, but soon realized that this might be too low for current conditions of the US economy. Then the news hit the market that US tariffs will be delayed for the majority of countries for up to 90 days, and the market suddenly entered into an optimistic mood, reaching the highest weekly level at 5.480. This occurred at Wednesday's trading session, where S&P 500 gained around 10% within one day. For the S&P 500 this could be treated as highly extreme movement, but it shows how much nervousness is within investors at this moment.
One of few reactions on the extreme volatility of US equity markets came from Susan Collins, head of the Boston Fed, who noted that “markets are continuing to function well” and that the Fed would be prepared to address chaotic conditions on the market, if needed. However, there is no indication that the Fed will react at this moment, and whether current developments will have any effect on their decision on rate cuts during the course of this year. The next FOMC meeting is scheduled for May 6-7th.
At this moment, the long term investors should not be worried, as this absurdity will come to pass one day, and US equities will continue to follow the growth of the US economy. Short term investors and traders will find this period of time as highly challenging. This sentiment will, unfortunately, continue for some time in the future, until the final tariffs-deal is set or dismissed.

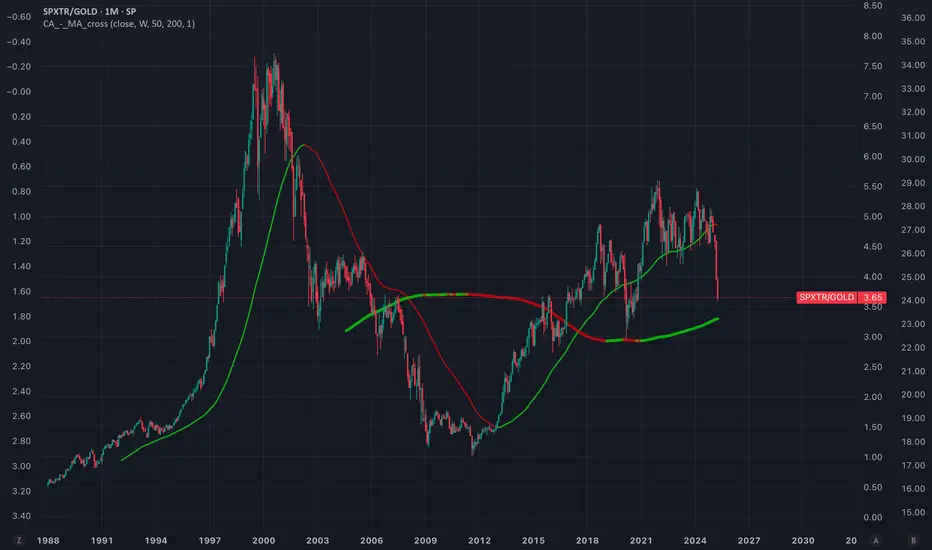
SPX/GOLD ratio near to key supportcrossing below moving average of 200 months could trigger a secular movement in favour of gold.
Potential global debt colapse and lack of confidence in USD + high valuation, mag-7 concentration and high growths expectations on AI are macro/fundamental facts that supports this idea.