Retests, Rallies, and Bear Swings LoadingYou know what’s better than nailing a trade?
Not having to flip, flop, hedge, unhedge, reverse, scalp, and do the full Hokey Cokey just to survive.
Today was one of those days – the kind where the plan just works.
Futures? Wild.
Down 143, up 188, then back to flat - all before most traders finished their first sip of coffee.
But while price whipsaws, I’m not chasing shadows.
I’ve got my line out.
My bear swing is on.
And I’m just waiting for the exit alert to ding.
---
Let’s break down what happened:
Yesterday’s tariff chaos acted like a Mr. Miyagi market prank.
“Tariff on.”
“Wait, just kidding.”
“Tariff off.”
The move up?
Landed exactly at Monday's news spike and the days 5250 gamma flip level – which we had marked and mapped.
Perfect resistance.
Retest. Rejection.
Bear pulse bars triggered.
And now the swing is on.
Trade location: Dialled in.
Directional bias: still bearish under 5400.
Execution: GEX levels + pulse bar structure.
Retests, Not Reversals
Tuesdays action also gave us something sneaky:
An intraday retest of the recent lows.
Now, if you’ve been around since the 2020 V-turn era, you’ve seen this before.
Panic sell.
Sharp bounce.
Retest the low to check for real conviction.
Then make the real move.
This retest could be the prelude to a bull thesis - but not yet.
Structure comes first. Bias second.
Until we break clean above 5400, I stay bear-biased.
---
Expert Insights: Don’t Trade Like You’re in a Dance-Off
The Mistake:
Overtrading volatility. Flipping bias every 15 minutes. Trading like it’s a talent show.
The Fix:
Pick your structure. Define your invalidation.
Enter once, scale in if needed, and let it play out.
No need to “turn around and shake it all about.”
Leave the Hokey Cokey for weddings.
---
Fun Fact
During the 2015–2020 bull run, the average false breakout-to-retest cycle happened within 3 sessions after a panic reversal.
Translation?
Markets often retest panic lows before deciding the next big move.
This isn’t new. It’s just noisy. And totally tradable.
...Another fun fact
Did you know?
The 104% tariff imposed by the U.S. on Chinese imports is among the highest in modern history, reminiscent of protectionist measures not seen since the early 20th century.
SPX (S&P 500 Index)

Navigating the Correction using SPX, Platinum, and DXYLikely levels that all sectors tend to bottom at using Fibonacci retracement, measuring likely degrees of magnitude on falling knife bounces, as well as determining the PM sector bottom via platinum price, and looking at ratios.

Nightly $SPY / $SPX Scenarios for April 9, 2025🔮 🔮
🌍 Market-Moving News 🌍:
🇺🇸📈 Implementation of New U.S. Tariffs: As of April 9, the U.S. has imposed a 104% tariff on Chinese goods, escalating trade tensions and raising concerns about a potential global economic slowdown.
🛢️📉 Oil Prices Decline Sharply: In response to escalating trade tensions, oil prices have fallen nearly 4%, reaching their lowest levels since early 2021. Brent crude dropped to $60.69 per barrel, while West Texas Intermediate (WTI) declined to $57.22.
📊 Key Data Releases 📊
📅 Wednesday, April 9:
📦 Wholesale Inventories (10:00 AM ET):
Forecast: 0.3%
Previous: 0.8%
Indicates the change in the total value of goods held in inventory by wholesalers, reflecting supply chain dynamics.
🗣️ Richmond Fed President Tom Barkin Speaks (11:00 AM ET):
Remarks may shed light on economic conditions and policy perspectives.
📝 FOMC Meeting Minutes Release (2:00 PM ET):
Provides detailed insights into the Federal Reserve's monetary policy deliberations from the March meeting.
⚠️ Disclaimer: This information is for educational and informational purposes only and should not be construed as financial advice. Always consult a licensed financial advisor before making investment decisions.
📌 #trading #stockmarket #economy #news #trendtao #charting #technicalanalysis
[S&P500] 2008-Style Collapse in MotionI believe we are witnessing the early stages of a 2008-style crash, though this one will unfold more swiftly and catch many by surprise. The crash will likely test the COVID-era lows, and once the panic subsides, a recovery toward new highs will follow.
FUNDAMENTAL REASONS
After the COVID-crash recovery, the market became significantly overbought, and a pullback was inevitable—such is the nature of markets. Trump’s tariffs have provided a convenient excuse for profit-taking. While the tariffs didn’t directly cause the crash, they served as a much-needed catalyst. What might have been a typical bull market pullback, however, could escalate into full-blown panic.
Why? Index funds.
For the past decade, there has been near-religious advocacy for investing solely in low-cost index funds. This extraordinary delusion has overtaken investors’ collective consciousness—the belief that no one can beat the S&P 500, nor should they try. The most rational choice, then, becomes focusing on your career or business and parking your money in index funds. After all, if the game can’t be beaten, why bother playing? This logic resonates with rational index fund buyers—many of whom lack market experience and have never been tested in the trenches of a downturn. They assume they’re in it for the long haul, unbothered by pullbacks, confident they can hold through volatility. It’s a sound and logical stance.
But will they hold? It’s easy to stay committed when the market is rising. When losses mount, however, the limbic system overrides rational thought, thrusting you into survival mode. You begin calculating how many years of work you’ve “lost,” lamenting that you could have bought a house if you’d sold at the peak, or watching your children’s college fund evaporate. Sleepless nights follow, compounded by a barrage of negative news. Eventually, exhaustion sets in, and in a desperate bid to salvage what remains, you hit the sell button.
With so many unsophisticated investors—who have never endured a true market panic—holding portfolios dominated by index funds, a negative feedback loop emerges. The further the market falls, the more people question their strategy and sell. This cycle intensifies until the panic is overdone, weak hands are shaken out, and the market stabilizes. It’s a tale as old as markets themselves, though today’s index fund evangelists have yet to experience it firsthand.
TECHNICAL REASONS
On the monthly chart, a clear and potent triple RSI divergence stands out. This indicates the market is severely overbought and has been struggling to make new highs.
While technical analysis rarely delivers definitive signals and can often be ambiguous, a triple RSI divergence on a monthly chart is as strong as it gets. Monthly charts of high-market-cap indices are immune to manipulation and short-term noise—it would take an infinite amount of capital to artificially “draw” such a pattern.
The 2021-2022 pullback was an Elliott Wave impulsive wave down (a Leading Diagonal). In Elliott Wave Theory, impulsive waves mark either the final leg of a correction or the first wave of a new trend. A Leading Diagonal almost always signals the latter—meaning another impulsive wave in the same direction is likely to follow.
The 2022-2025 bull market, meanwhile, has proven to be an ABC corrective wave up within the broader trend. This suggests the bull run wasn’t a continuation of the prior uptrend but rather an extended correction that pushed to new highs.
Thus, the leading diagonal down foreshadows another impulsive wave lower, and the corrective wave up confirms this trajectory. Since March 2025, the market has entered free-fall mode—precisely what one would expect following an upward corrective wave.
This sets the stage for a high-probability Elliott Wave Expanding Flat pattern. What’s unfolding now is an impulsive wave down that should, at minimum, retest the 2022 low. If panic takes hold, however, the decline won’t find a floor until it hits a major support level—namely, the 200-month moving average (MA200 Monthly), which sits precisely at the COVID bottom. Should that occur, the magnitude of the drop would rival the 2008 crash.

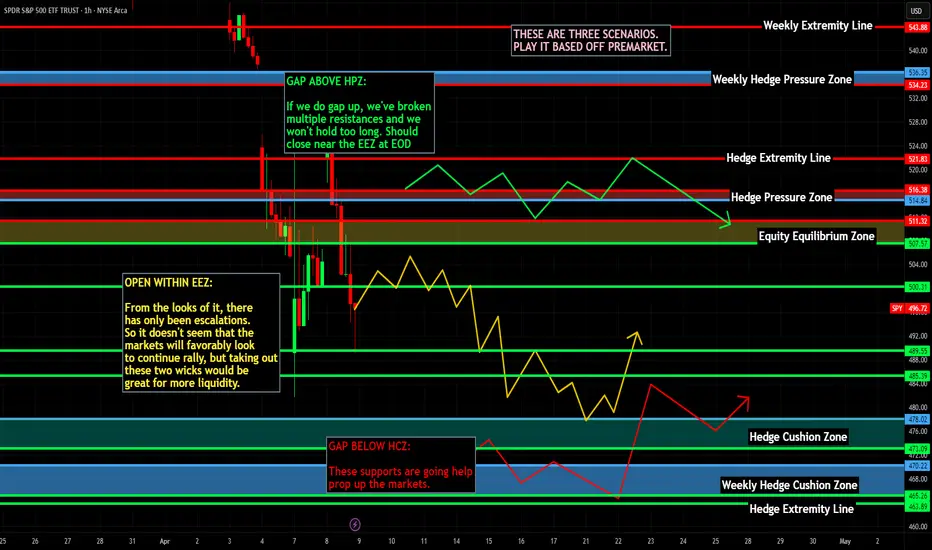
Island Bottom CONFIRMED on $SPY IF we GAP up tomorrow!Island Bottom CONFIRMED on AMEX:SPY SP:SPX IF we GAP up tomorrow!
I only believe we can GAP up tomorrow if there is news of China coming to the negotiation table with the U.S. after they raise the Reciprocal Tariffs to 104%.
If this doesn't happen, then this isn't confirmed, and we see a retest of $482, IMO!
I'm not playing this as a trade until we get confirmation! Too dangerous!
Not financial advice

Apparatchik Trump Says 'No.. More Pain' Ahead of Amazon EarningsPresident Trump's new tariffs have had a significant negative impact on Amazon's stock performance, revenue, and earnings, primarily due to increased costs and supply chain disruptions.
Here below is a detailed analysis of these effects.
Impact on Amazon's Stock Performance
Amazon's stock has seen substantial declines following the announcement of Trump's tariff plan. The company's shares dropped nearly 7% within two days of the announcement and are down nearly 21% year-to-date. These tariffs have exacerbated existing challenges for Amazon, which was already struggling in early 2025 with a 13% decline in stock value during the first quarter. The broader market also suffered, with technology stocks experiencing sharp declines as investors reacted to fears of higher costs and inflation.
Revenue Challenges
Amazon's reliance on Chinese suppliers for merchandise has made it particularly vulnerable to the newly imposed tariffs. Over 50% of Amazon's top third-party sellers are based in China, and many of their products are subject to hefty import taxes, including a 34% tariff on Chinese goods. These tariffs increase landed costs for a significant portion of Amazon's inventory, forcing sellers to either absorb the additional expenses or pass them on to consumers through higher prices. This could lead to reduced consumer demand, as higher prices may deter shoppers from purchasing goods on Amazon's platform.
Additionally, the elimination of duty exemptions on minor imports—previously advantageous for discount platforms such as Temu and Shein—has disrupted Amazon's competitive pricing strategy. While this change may level the playing field among e-commerce platforms, it also raises operational costs for Amazon's marketplace vendors who had relied on these exemptions.
Earnings Pressure
The tariffs are projected to slash Amazon's annual operating profits by $5 billion to $10 billion due to increased merchandise costs. Goldman Sachs estimates that these costs could rise by 15% to 20%, further straining profitability. While Amazon has historically maintained lower prices compared to competitors, absorbing these increased expenses without raising prices significantly may be unsustainable in the long term.
Moreover, fears of inflation resurgence due to Trump's trade policies could further dampen consumer purchasing power. This would likely lead to lower sales volumes and additional pressure on profit margins across Amazon's retail operations.
Potential Mitigation Strategies
To counteract these challenges, Amazon may implement several measures:
Vendor Negotiations. The company could negotiate with suppliers to share the burden of increased input costs rather than bearing them entirely.
Price Adjustments. Selective price increases on certain products may help offset rising costs without alienating customers entirely.
Supply Chain Diversification. Shifting sourcing away from heavily tariffed regions like China or focusing more on domestic suppliers could reduce exposure to trade disruptions.
Focus on Services. Amazon’s cloud division, AWS, contributes significantly to its operating income (58% in Q4 2024) and remains largely unaffected by tariffs. Increased emphasis on AWS could help mitigate losses from retail operations.
Technical challenge
The main technical graph indicates on Bearish market in development, with nearly 30% potential to further decline, down to major 10-year average support.
Conclusion
Trump’s tariffs have created substantial headwinds for Amazon by driving up costs and disrupting its supply chain. These challenges have led to stock declines, reduced revenue potential, and significant earnings pressure. While Amazon is exploring mitigation strategies such as vendor negotiations and diversification, the long-term impact will depend on how effectively the company adapts its operations amidst ongoing trade tensions.
--
Best 'Apparatchik' wishes,
PandorraResearch Team 😎

Has SPX formed a bottom?SPX500USD - 24h expiry
Price action looks to be forming a bottom.
A Doji style candle has been posted from the base.
Setbacks should be limited to yesterday's low.
We look to buy dips.
Risk/Reward would be poor to call a buy from current levels.
We look to Buy at 4900.5 (stop at 4767.5)
Our profit targets will be 5295.5 and 5365.5
Resistance: 5219.6 / 5350.0 / 5500.0
Support: 5100.0 / 5000.0 / 4812.2
Risk Disclaimer
The trade ideas beyond this page are for informational purposes only and do not constitute investment advice or a solicitation to trade. This information is provided by Signal Centre, a third-party unaffiliated with OANDA, and is intended for general circulation only. OANDA does not guarantee the accuracy of this information and assumes no responsibilities for the information provided by the third party. The information does not take into account the specific investment objectives, financial situation, or particular needs of any particular person. You should take into account your specific investment objectives, financial situation, and particular needs before making a commitment to trade, including seeking advice from an independent financial adviser regarding the suitability of the investment, under a separate engagement, as you deem fit.
You accept that you assume all risks in independently viewing the contents and selecting a chosen strategy.
Where the research is distributed in Singapore to a person who is not an Accredited Investor, Expert Investor or an Institutional Investor, Oanda Asia Pacific Pte Ltd (“OAP“) accepts legal responsibility for the contents of the report to such persons only to the extent required by law. Singapore customers should contact OAP at 6579 8289 for matters arising from, or in connection with, the information/research distributed.

SPX bounce is dueSPX RSI hasn't been so oversold since the Corona crash, plus bouncing from the 2022 ATH
Relief is due

S&P500 Dead Cat Bounce or V-shaped Recovery?The S&P500 index (SPX) saw a remarkable turnaround yesterday after the Wall Street opening. The early futures sell-off came very close to the 1W MA200 (orange trend-line), which has been the ultimate Support level since the March 2009 Housing Crisis bottom (the last major Bear Cycle).
It supported the 2022 Inflation Crisis, the 2018 U.S. - China Trade War, the 2015 E.U./ Oil Crisis and 2011 correction. It only broke during the irregularity of the March 2020 COVID flash crash.
Note that the 1W RSI hitting 27.30 has only happened during the COVID crash and the actual March 2009 Housing Crisis Bottom. At the same time, the index reached the All Time High (ATH) trend-line (dashed0 of the High before the 2022 Inflation Crisis (previous correction phase). As this chart shows, previous ATH trend-lines have never been broken during the correction phases that followed them.
In any case, the million dollar question is of course this: Was yesterday a Dead Cat Bounce inside the new Bear Cycle or we are ahead of a V-shaped recovery? Well technically it depends on the 1W MA200 (the market needs 1W candles to close above it) while fundamentally if depends on potential trade deals and of course the Fed (the market needs rate cut assurances).
If this is a V-shaped Recovery indeed, there is no reason not to expect the market to follow all previous rebounds of 1W MA200 corrections that weren't Bear Cycles (Bear Cycles on this chart are 2008 and 2022).
As you can see, all rebounds have been sharp, indeed V-shaped recoveries, ranging from 20 to 27 weeks (140 - 189 days) until they broke their previous High. So this indicates that technically, SPX should make new ATH by October 13 2025 the latest (and September 02 earliest). Of course this is just a projection, this time we have no COVID shutdowns, no Grexits or Brexits, no Oil crises, it is all due to one fact, the tariffs and if deals are reached and the Fed delivers the much needed rat cuts, the recovery may be even faster, as sharp as the correction has been.
The facts are on the historic data on the chart. The conclusions are yours.
-------------------------------------------------------------------------------
** Please LIKE 👍, FOLLOW ✅, SHARE 🙌 and COMMENT ✍ if you enjoy this idea! Also share your ideas and charts in the comments section below! This is best way to keep it relevant, support us, keep the content here free and allow the idea to reach as many people as possible. **
-------------------------------------------------------------------------------
💸💸💸💸💸💸
👇 👇 👇 👇 👇 👇

Bulls are not of the woods, not by far1. What happened yesterday?
In my weekend analysis covering US indices , I mentioned that US500 (SP500) could drop and test the ascending trend line starting back at the pandemic low. This line is confluent with the horizontal support level given by January 2022 ATH, offering a good opportunity for traders to open long positions.
Indeed, at least on CFDs and futures, this trend line was touched, and the price rebounded strongly from there.
2. Key Question:
Will we have a full V-shape recovery, or will the price drop back below 5k in the coming sessions?
3. Why I expect a continuation of the correction:
🔸 Strong Resistance: The US500 has established a robust ceiling around the 5350-5400 zone(also a gap there)
🔸 Lack of Building Momentum on Support: There's no clear indication that this resistance will be broken anytime soon with the lack of accumulation under 5k
🔸 Potential for Further Decline: Given the current market structure, a drop below 5k remains a realistic possibility in the upcoming sessions.
4. Trading Plan:
🎯 My Strategy: Playing the range.
✅ Buy near the 4800 support.
✅ Sell into the resistance zone between 5350 and 5400.
5. Conclusion:
I’m watching for market confirmations and will continue applying this range strategy until there’s a clear directional change. 🚀
Disclosure: I am part of Trade Nation's Influencer program and receive a monthly fee for using their TradingView charts in my analyses and educational articles.

$SPY short term top downside from $521 to $481AMEX:SPY is looking like it put in a short term top here. I originally only thought that we had the potential to fall to $545 or so, but now looking at the chart, I think we have the possibility of falling farther.
The two targets that I'm looking for on the downside are $524.35 and 481.18.
Let's see if they get hit over the coming weeks.
If they hit, it'll be the ultimate buying opp as I think from there, we're likely to see SPY over $700 in the coming year or two.

Nightly $SPY / $SPX Scenarios for April 8, 2025🔮 🔮
🌍 Market-Moving News 🌍:
🇺🇸📊 NFIB Small Business Optimism Index Release: The National Federation of Independent Business (NFIB) will release its Small Business Optimism Index for March at 6:00 AM ET. This index provides insights into the health and outlook of small businesses, which are vital to the U.S. economy.
🗣️ Federal Reserve Speeches:
San Francisco Fed President Mary Daly is scheduled to speak at 8:00 AM ET.
Chicago Fed President Austan Goolsbee will deliver remarks at 7:00 PM ET.
📊 Key Data Releases 📊
📅 Tuesday, April 8:
📈 NFIB Small Business Optimism Index (6:00 AM ET):
Forecast: 100.7
Previous: 102.8
Assesses the health and outlook of small businesses, which are vital to the economy.
⚠️ Disclaimer: This information is for educational and informational purposes only and should not be construed as financial advice. Always consult a licensed financial advisor before making investment decisions.
📌 #trading #stockmarket #economy #news #trendtao #charting #technicalanalysis

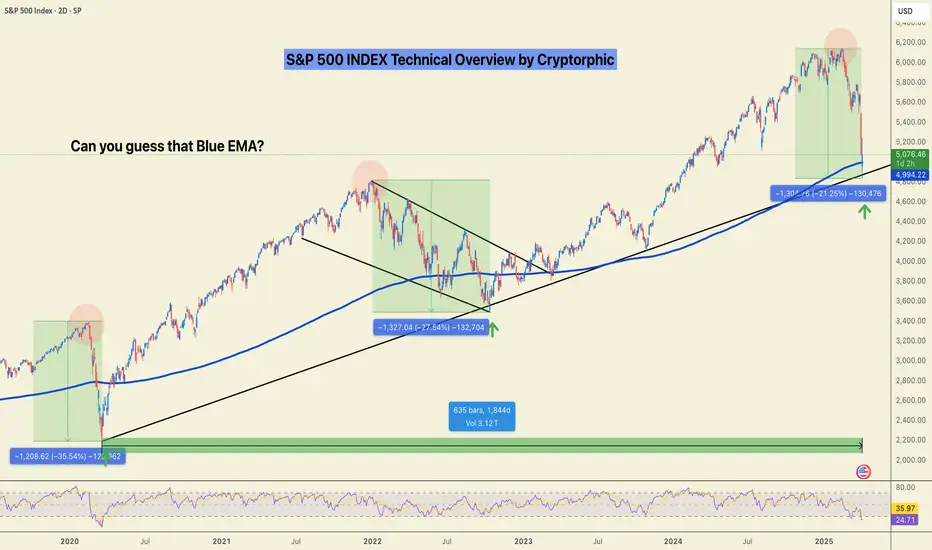
S&P 500: Valuation Correction or the Start of a Breakdown?Valuation Correction or the Start of a Breakdown?
Zoom out. Clear the noise.
We might still sweep the lows, but when viewed on the weekly timeframe, this current S&P 500 move looks more like a healthy valuation correction than a structural breakdown.
Let’s break it down by the numbers using fractal analysis:
🟩 March 2020 (COVID Crash):
▪️~35% drop
▪️V-shaped recovery
▪️Oversold RSI bounce
🟨 2022 Bear Market:
▪️~27% correction
▪️Multi-month wedge consolidation
▪️Eventually led to an upside breakout
🟦 Now (2025):
▪️~21% correction so far
▪️Retesting long-term trendline
▪️RSI in familiar oversold zone
📊 Fractal Math:
- From 35% to 27% = 22.86% decrease
- From 27% to 21% = 22.22% decrease
Both legs show a consistent ~22% drop in correction depth suggesting bearish momentum is weakening with each cycle. Currently bouncing off the1844 days of support.
Is this the bottom? Will there be relief?
🔁 If this pattern holds:
- We could see a short-term sweep or deviation under recent lows.
- But structure favours a potential recovery from this zone, unless the trendline breaks decisively.
📌 Watch levels closely. Timing matters.
🧠 What’s your take, is this another “buy the dip” moment?
Do hit the like button if you liked this update and share your views in the comment section.
$SPX Flirting With a Bear Market alongside $QQQ NASDAQ fell another 4% touching down 26%
S&P 500 walking a tight rope falling 21% to play with the idea of a Bear Market, but has rebounded a bit.
NASDAQ:QQQ did have a stronger response from buyers than SP:SPX
Nonetheless, we would need several WEEKLY closes sub 20% losses to enter a textbook Bear Market.

$SPX Recap of Last Week A historic week with unprecedented tariffs not seen since right before the great depression.
SP:SPX We broke many supports and are looking for Support
Stay Tuned - Today's Trading Range is coming out.
Don't rush into a trader just to trade - But also, if you see a great opportunity take it.

Great Depression SituationAn idea suggesting that current actions by trump have induced a massive sell off situation
With losses coming in comparable to that of the 1920 depression
I think we are very over extended a pull back is necessary
Yearly chart

SPX POSSIBLE RECOVERY UP TO 7000-7500first quarter wasn't bright for spx. but it can recover at moderate phase.

$QQQ Has Officially Entered a Bear Market $SPX is CloseNASDAQ HAS OFFICIALLY ENTERED A BEAR MARKET, DOWN ~22%
NASDAQ:QQQ 2022 Bear Market bottomed ~37%
just below the 200WMA
S&P 500 is not quite there yet, down only ~17.5%
SP:SPX 2022 Bear Market bottomed ~27% a tick below the 200WMA

SPX500 & Nasdaq: Confluence! Confluence! Confluence!With consumer confidence off at circuit breaking levels, the market, technically, has reached extreme levels of support. Let's look at it:
Technicals:
(1) Horizontal Levels of support
(2) 50%/61.8% fib confluence
(3) exDiv1
(4) extreme indicators
(5) Chikou span testing cloud support
(6) 28% drop is SPX
All of these levels are lining up around the same location. And just like in real estate "Location! Location! Location!" is the adage; in markets, "Confluence! Confluence! Confluence!" is the adage!

Weekly $SPY / $SPX Scenarios for April 7–11, 2025🔮 🔮
🌍 Market-Moving News 🌍:
🇺🇸📈 New U.S. Tariffs Begin April 9: Trump’s “Liberation Day” tariffs — 10% on all imports, 25%+ on key sectors — could stir volatility.
🇨🇳📦 China Retaliates April 10: A 34% retaliatory tariff on U.S. goods raises trade war fears and inflation concerns.
🏦💰 Big Bank Earnings Kick Off: JPMorgan, Wells Fargo, and BlackRock will report. Markets will watch closely for financial health signals.
📉📊 March CPI Report Coming April 10: Inflation data could sway the Fed’s rate path. Forecasts call for a 0.1% increase.
⚠️ Volatility Alert: Piper Sandler projects a possible 5.6% move in the S&P 500 this week — up or down.
📊 Key Data Releases 📊
📅 Monday, April 7:
🗣️ Fed Gov. Kugler Speaks (10:30 AM ET)
💳 Consumer Credit (3:00 PM ET) — Forecast: $15.5B | Prev: $18.1B
📅 Tuesday, April 8:
📈 NFIB Small Biz Optimism (6:00 AM ET) — Forecast: 100.7
🗣️ Fed’s Mary Daly Speaks (8:00 AM ET)
📅 Wednesday, April 9:
📦 Wholesale Inventories (10:00 AM ET) — Forecast: 0.4% | Prev: 0.8%
🗣️ Fed’s Barkin Speaks (11:00 AM ET)
📝 FOMC Minutes (2:00 PM ET)
📅 Thursday, April 10:
📉 Jobless Claims (8:30 AM ET) — Forecast: 219K
📊 CPI (8:30 AM ET) — Forecast: 0.1% | Prev: 0.2%
🗣️ Fed Gov. Bowman Testifies (10:00 AM ET)
📅 Friday, April 11:
🏭 PPI (8:30 AM ET) — Forecast: 0.2% | Prev: 0.0%
🗣️ Fed’s Musalem Speaks (10:00 AM ET)
⚠️ Disclaimer: This information is for educational and informational purposes only and should not be construed as financial advice. Always consult a licensed financial advisor before making investment decisions.
📌 #trading #stockmarket #economy #news #trendtao #charting #technicalanalysis

SPY w/ 2022 Fibonacci levels. The chart is the SPY with FIB levels from the 2022 bottom or close to give you an idea of where we might find support levels.

SPX500: The trendline show a bottom in Sept 2025 at 4700 We're being magnetically pulled toward the trendline bottom around 4700.
Based on the current MACD and RSI signals, the bearish scenario could continue until September–October 2025. This correction is very similar to the one from 2022.
There will be some dead cats bounces, but do not be fooled, the MACD is reseting hard.
Stay sharp. Be ready.
DYOR.

SNP500 / SPX🔍 SPX/USDT Analysis: Daily Timeframe 📉
SELL IT!
The SPX chart on a daily timeframe highlights significant upcoming dates where price movements may present trading opportunities. These should be analyzed in conjunction with higher timeframes for a comprehensive market view.
• September 3, 2024 - Red Line: This date marks a potential local peak. Traders might consider this as a moment to take profits or reduce exposure, as the price could encounter resistance or a downturn.
• December 6, 2024 - Red Line: This date is another potential local peak, signaling a possible moment to exit positions before a downturn.
When working with this daily timeframe, remember to evaluate these movements within the context of the broader market trend, considering higher timeframes for a more global perspective.
Note: The exact timing of these phases can vary by +/- a few days. All times are based on UTC-7 (Los Angeles).
