Welcome to the real world Uncle Sam!The market can withstand a lot of pressure.
It can handle:
the dawn of "fake news" and outright "lying"
the pollution and "enshitification" of social media
imperialist ideas of a Gaza takeover
partnering with a Russian totalitarian state
overhyping of AI and Nvidia's overpricing
populist politics
unworldly valuations of tech stocks
What it cannot handle is:
Upsetting the world order
Undermining of NATO, Europe, and allies
Starting trade wars with your best friends
Establishing tariffs which will harm the US economy
I love the US stock market, and US animal spirits, it's the best in the world.
But when risk rises, then secure investments like bonds/treasuries become the smart money move. Stocks become "risk off"
Risk is rising, tariffs will pressure inflation, inflation kills economies and markets.
The European defense industry will benefit, the US consumer will pay higher prices.
Higher risk, could mean a lack of confidence, and confidence powers the stock market.
Batton Down the Hatches.
Trading Note: I sold all my US holdings on Tuesday, at the break of the double top neckline (see chart).
My target price is the 2021 high, before the one-year bear market. Its a big drop, I give it a 60-70% chance.
RSI & ROC Negative Medium-term divergences
Of course this could all change if Trump backtracks on trade wars, tariffs and imperialist rhetoric.
But until then, enjoy the ride.
SPX (S&P 500 Index)

S&P500 6th time in 14 years that this buy signal flashes.S&P500 is sinking under its MA50 (1w) and is headed straight to the next support level, the MA100 (1w).
Last time it touched this level was in October 30th 2023 and that's alone a great buy signal.
It's the RSI (1w) you should be paying attention to as it is approaching the 33.00 level, which since August 2011 it has given 5 buy signals that all touched the MA100 (1w).
Obviously in 2022 we had a bear market, March 2020 was the COVID Black Swan and December 2018 the peak of the U.S.-China trade wars.
Trading Plan:
1. Buy on the MA100 (1w).
Targets:
1. 6500.
Tips:
1. This is a long term trade and it is all about your approach to risk. If you can handle unexpected dips below the MA100 (1w), then you will be greatly rewarded by the end of 2025.
Please like, follow and comment!!

Opening (IRA): SPX May 16th 5130/5160/5850/5880 Iron Condor... for a 10.20 credit.
Comments: High IVR/IV >21. Hesitant to add more long delta here, so going delta neutral in SPX and structuring the trade such that I receive one-third the width of the wings (30) in credit.
Metrics:
Buying Power Effect: 19.80
Max Profit: 10.20
ROC at Max: 51.52%
50% Max: 5.10
ROC at 50% Max: 25.8%
Will generally look to take profit at 50% max, rolling down oppositional side on side test, but won't hesitate to take profit quickly if IV crushes in dramatically post "Liberation Day."

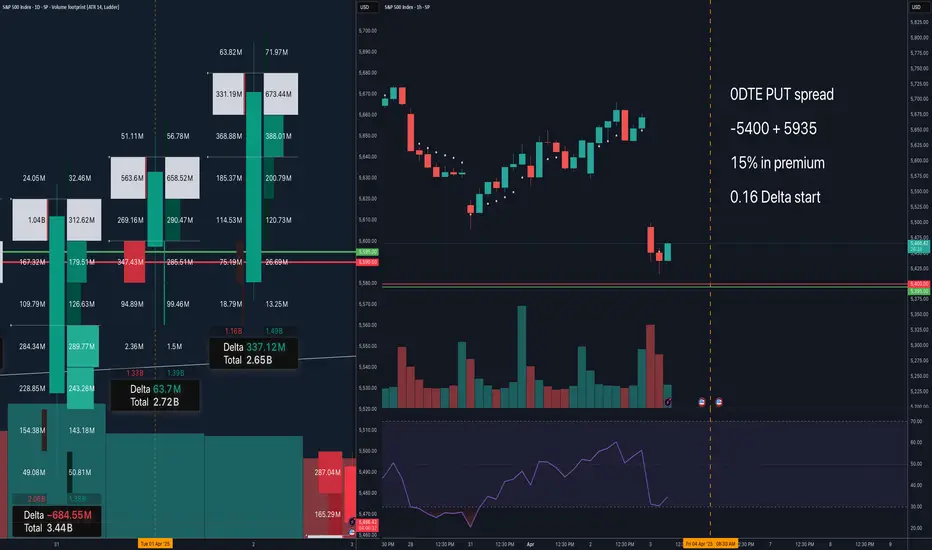
Aggressive 0 DTE PUT spreadPlaying the bounce / recovery on a big drop for SPX today, short term 0 DTE.
-5400 +5395 15% gain in premium
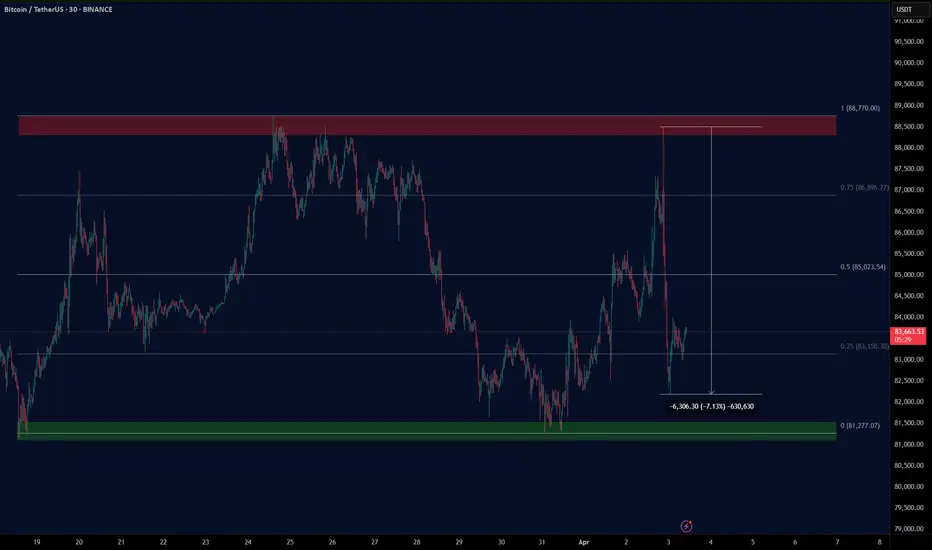
BTC TARIFF TALKAs President Trump steps up on the stage to deliver his tariff plan BTC had a steady price rise going into the talk, a nice HH & HL LTF structure up into range high/ last weeks high, then as the speech began all of the progress made throughout the day wiped in less than 2 hours to reset BTC's price to Tuesdays low.
In the end the news event gave volatility as expected but ultimately the structure remains the same, rangebound. As the Tax year comes to an end it would be a hard ask for this choppy price action to shift bullish when institutions are going to be window dressing their portfolios for the next financial year.
In essence A continued LTF range with an overall HTF bearish trend looks to continue, this is compounded by yet another failed attempt at the 4H 200 EMA which had temporarily been broken but sent back below by the tariff announcements.
The SPX, DJI & NASDAQ Futures pre-market is looks dreadful so a revisit on the range low is probable on the cards at some stage today.
Hellena | SPX500 (4H): LONG to resistance area of 5788.8.Dear colleagues, I am still counting on an upward movement. It seems that the sellers have not lost their strength yet and I see that an update of the low in the area of 5445 is possible. Then I expect a resumption of the upward movement with a target to reach the 5788.8 area.
As usual there are 2 possible entry options:
1) Market entry
2) Entry by pending limit orders if the price starts a small downward movement.
Manage your capital correctly and competently! Only enter trades based on reliable patterns!

SPX developing a wedge similar to 2022As I write this futures are sharply down to 5440 and ViX is at 40. I expect to see a short technical bounce to about 5550, being at major trendline. The wedge formation is similar to 2022. A breakout from Wedge would be sharp either way. If it holds at this level for a couple of weeks then I expect to see a bounce to 5775.I had said earlier in my vix analysis we are in 2022 mode.
Market could see a relief rally only to realise that there are still many unknowns.
The impact on labour market due to immigration policies, retaliation of other countries and negotiation results thereof, impact on consumer sentiments and extent of inflations due to tariff. Weakening of US dollar will only add to inflation pressure. Trump has only accelerated BRICS agenda of moving away from USD
Citadel,Millennium and many other hedge fund are having liquidity problems and FED is been asked to setup a bailout fund for these crooks. They are the highest leveraged entities. A weaker market will precipitate another financial crisis. So far the financial sector hasn't been devalued liketh tech and semi's. I think their turn will come once the market have finished dealing with tech valuations. Once market gets this, it will see a sharp selloff, which is better than slow grind down over months as far as I am concerned
When trump says, he doesn't care about the stock market, I think he knows it is overvalued, just like Warren Buffet did last year and sold off most his positions and now sitting on largest cash in history, waiting for it to come to his level of expectation which to to my mind cant be just 10%
bat rather like 30% write off in the en, to entice savvy investors like Buffet and Michael Burry to re-enter and clean out the garbage investors like the hedge funds

Daily Trade Recap based on VX Algo System EOD accountability report: +$2,337.50
Sleep: 5 hour, Overall health: not gud
**
Daily Trade Recap based on VX Algo System **
9:36 AM VXAlgo NQ 48M Buy Signal,
9:44 AM Market Structure flipped bullish on VX Algo X3!
11:13 AM VXAlgo ES 10M Sell Signal (lost $525 on this play)
1:21 PM VXAlgo ES 10M Sell Signal
2:05 PM VXAlgo NQ 48M Sell Signal
2:40 PM VXAlgo ES 10M Buy signal (triple signal)
Overall a pretty wild day, I'm extremely glad that we have a system that works and reads the MM very well.
The only thing we need to do is be extremely disciplined and pull the trigger without hesitation.

Nightly $SPY / $SPX Scenarios for April 3, 2025🔮 🔮
🌍 Market-Moving News 🌍:
🇺🇸📈 President Trump's 'Liberation Day' Tariffs Implemented: On April 2, President Donald Trump announced a series of new tariffs, referred to as "Liberation Day" tariffs, aiming to address trade imbalances. These include a baseline 10% tariff on all imports, with higher rates for specific countries: 34% on Chinese goods, 20% on European Union products, and 25% on all foreign-made automobiles. The administration asserts these measures will revitalize domestic industries, though critics warn of potential price increases for consumers and possible retaliatory actions from affected nations.
📊 Key Data Releases 📊
📅 Thursday, April 3:
📉 Initial Jobless Claims (8:30 AM ET):
Forecast: 225,000
Previous: 224,000
Measures the number of individuals filing for unemployment benefits for the first time during the past week, providing insight into the labor market's health.
📈 Trade Balance (8:30 AM ET):
Forecast: -$76.0 billion
Previous: -$131.4 billion
Indicates the difference in value between imported and exported goods and services, reflecting the nation's trade activity.
🏢 ISM Services PMI (10:00 AM ET):
Forecast: 53.0
Previous: 53.5
Assesses the performance of the services sector; a reading above 50 suggests expansion.
⚠️ Disclaimer: This information is for educational and informational purposes only and should not be construed as financial advice. Always consult a licensed financial advisor before making investment decisions.
📌 #trading #stockmarket #economy #news #trendtao #charting #technicalanalysis

S&P500: Recovery has started and the next stop is the 1D MA50.S&P500 is marginally neutral on its 1D technical outlook (RSI = 45.213, MACD = -61.280, ADX = 30.163) as it's recovered from Friday's bearish sentiment and already crossed above the 0.236 Fibonacci level. This rebound made Monday's low a Double Bottom and since the 1D RSI is on a HL bullish divergence, we expect a strong 1 month rally to start. The first target is the 1D MA50 slightly over the 0.5 Fib mark (TP1 = 5,835) and after a small correction, the 0.786 Fib (TP2 = 6,000), which is also the top of the 5 month Bull Flag.
## If you like our free content follow our profile to get more daily ideas. ##
## Comments and likes are greatly appreciated. ##

COMPLEX WAVE STRUCTURE FORMING WITHIN WAVE B or 2 HIGH RISKThe chart posted is the updated sp 500 pattern that is forming .I have thought we would see a simple wave structure form as the spiral cycles topped 2/19 and bottom3/13 in perfect timing since the two bottom I have gone long twice and shorted twice at both tops . I now am forced the go to cash and wait for the wave structure to form the next wave The issue is the HIGH VIX and the formation on 15 min and 5 min charts . So being in cash is the best .Best of trades WAVETIMER ! we must hold 5444 /5388 for wave B 1.272 and 1.382 of wave A

Wall Street vs GoldZilla. The End of 'Irrational Exuberance' Era"Irrational exuberance" is the phrase used by the then-Federal Reserve Board chairman, Alan Greenspan, in a speech given at the American Enterprise Institute during the dot-com bubble of the 1990s. The phrase was interpreted as a warning that the stock market might be overvalued.
Origin
Greenspan's comment was made during a televised speech on December 5, 1996 (emphasis added in excerpt)
Clearly, sustained low inflation implies less uncertainty about the future, and lower risk premiums imply higher prices of stocks and other earning assets. We can see that in the inverse relationship exhibited by price/earnings ratios and the rate of inflation in the past. But how do we know when irrational exuberance has unduly escalated asset values, which then become subject to unexpected and prolonged contractions as they have in Japan over the past decade?
Greenspan wrote in his 2008 book that the phrase occurred to him in the bathtub while he was writing a speech.
The irony of the phrase and its aftermath lies in Greenspan's widely held reputation as the most artful practitioner of Fedspeak, often known as Greenspeak, in the modern televised era. The speech coincided with the rise of dedicated financial TV channels around the world that would broadcast his comments live, such as CNBC. Greenspan's idea was to obfuscate his true opinion in long complex sentences with obscure words so as to intentionally mute any strong market response.
The phrase was also used by Yale professor Robert J. Shiller, who was reportedly Greenspan's source for the phrase. Shiller used it as the title of his book, Irrational Exuberance, first published in 2000, where Shiller states:
Irrational exuberance is the psychological basis of a speculative bubble. I define a speculative bubble as a situation in which news of price increases spurs investor enthusiasm, which spreads by psychological contagion from person to person, in the process amplifying stories that might justify the price increases, and bringing in a larger and larger class of investors who, despite doubts about the real value of an investment, are drawn to it partly by envy of others' successes and partly through a gamblers' excitement.
The main technical graph represents a value of S&P500 Index in Gold troy ounces (current value 1.81 at time of writing this article), indicates that effusive Bull stock market goes collapsing.
--
Best wishes,
Your Beloved @PandorraResearch Team 😎

#SPX - 2 Apr#SPX pulled back nicely to PZ yesterday before rallying 70 points, going back to resistance zone.
Overall, price action looks toppish. Could see a move down to 5525/55 but will be looking for a turn at that level for a long. If level does not hold, next strong support below is at 5400.
Today is Tariff day. Trade safe.

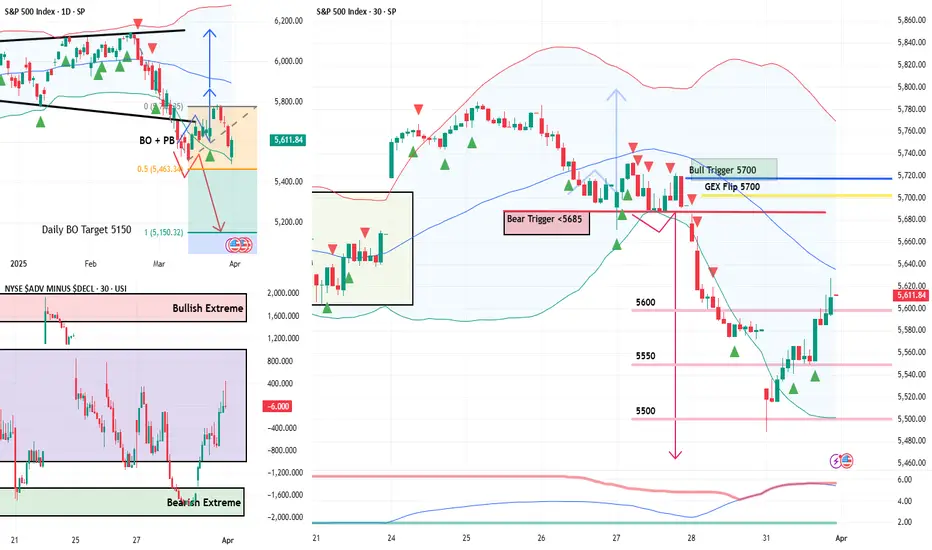
March Was Boring. April Could BiteMarch Was Boring. April Could Bite | SPX Analysis 02 April 2025
At the risk of sounding like a scratched CD (or whatever the Spotify kids call repetition), yes – I’m still bearish.
Some might say I’m stubborn.
I say I just know a pattern when I see one.
And while March was about as exciting as watching paint dry in slow motion on a frozen chart... April's already teased a shift. Tuesday’s 0-DTE win added a bit of grease to the gears – finally. Movement. Profit. Action.
But I’m not celebrating yet.
My stance is clear: bullish above 5700, bearish below. Until we break out, I’m scanning for pulse bar setups, especially if price cracks below 5500 – that’s where things get spicy.
And with Friday’s NFP looming on the calendar, the market may be about to wake up and pick a direction.
I know which way I’m leaning.
Bear slippers are still on.
---
Why April Could Be a Whole New Beast
Here’s the rundown:
March = sideways snoozefest.
April = already triggered a 0-DTE win.
My trigger line for flipping bull remains 5700 – it’s the GEX flip, flag failure, and no-go zone.
I’m watching for bearish pulse bars, ideally on:
Morning setups
Under 5500
With volatility in play
Should we crack those levels with strong momentum, I’ll look to compound into existing bear swings, leaning on the mechanical setups that’ve done the job before.
This week’s X-factor?
Friday’s Non-Farm Payroll report.
Could be a nothing-burger.
Could be the matchstick that lights the whole thing up.
Either way, I’ll be ready.
---
Expert Insights – Don’t Let Boredom Trade for You
One of the most common trader traps?
Forcing trades when the market isn’t doing anything.
Here’s how to avoid it:
✅ Patience is a position.
Waiting for clarity is a valid strategy.
I didn’t force anything through March – and I’m better for it.
✅ Setups still work – just less frequently.
Your system isn’t broken… the market was just asleep.
✅ The pros aren’t hunting trades every day – they’re waiting for the ones worth taking.
That’s how the SPX Income System works – clear triggers, no second-guessing.
---
Fun Fact - April: Historically Strong… Unless March Fails First
The month of April is historically one of the strongest for the S&P 500, averaging gains of 1.5% since 1950.
But guess what?
Most of that strength happens after a strong March.
When March is slow or bearish… April tends to flip the script.
So don’t be surprised if volatility roars back this week – just be ready.
---
Video & Audio Podcast
Coming Soon on main blog...
Happy trading,
Phil
Less Brain, More Gain
…and may your trades be smoother than a cashmere codpiece
---
p.s. Ready to stop scratching your head and start stacking profits?
If you want to trade with clarity – not confusion – then it’s time to get serious about structure.
Join the Fast Forward Mentorship – trade live, twice a week, with me and the crew. PLUS Monthly on-demand 1-2-1's
Or watch the free training to see the SPX Income System in action.
No fluff. Just profits, pulse bars, and patterns that actually work.
Links In Bio

Nightly $SPY / $SPX Scenarios for April 2, 2025 🔮 🔮
🌍 Market-Moving News 🌍:
🇺🇸📈 President Trump’s 'Liberation Day' Tariff Announcement: President Donald Trump is set to announce new reciprocal tariffs on April 2, aiming to align U.S. import duties with those imposed by other countries on American goods. This move is expected to impact various sectors, including automotive and manufacturing, and may lead to market volatility as investors react to potential shifts in trade policies.
📊 Key Data Releases 📊
📅 Wednesday, April 2:
🏭 Factory Orders (10:00 AM ET):
Forecast: 0.6%
Previous: 1.7%
Indicates the dollar level of new orders for both durable and non-durable goods, reflecting manufacturing demand.
⚠️ Disclaimer: This information is for educational and informational purposes only and should not be construed as financial advice. Always consult a licensed financial advisor before making investment decisions.
📌 #trading #stockmarket #economy #news #trendtao #charting #technicalanalysis

Daily Trade Recap based on VX Algo SystemEOD accountability report: +$446.25
Sleep: 10 hour, Overall health: Meh
**Daily Trade Recap based on VX Algo System **
9:30 AMVXAlgo ES 10M Sell Signal
2:57 PM VXAlgo NQ 10M Buy Signal

S&P500 Last time it made that bottom was 18 months ago.S&P500 / US500 is trading inside a multi year Channel Up that goes back to October 2022.
The index almost hit the Channel bottom this week and immediately we see a rebound attempt.
It may be under the 1week MA50 but this is not disastrous as the patterns last bottom was formed exactly under it on October 23rd 2023, 18 months ago.
On top of that, the 1week RSI was exactly where it is now, on the 40.00 Support, bearish enough to call for a long term buy.
In addition, the both bearish waved leading to both bottoms were almost -11%. This high symmetry potential suggests that the bullish wave that will follow may be of a similar +28.34% rise.
This is a unique opportunity to buy and target 7000.
Follow us, like the idea and leave a comment below!!

I spy an Evening Star Doji on SPXso alot is going on. when we gapped up and ran nonstop 3/25-3/26, i decided to look for reversal signals. tues was a tight range. it formed a doji; which was suspect. the move below the open print today was the second. and now i see we are up on a tweet and a prayer. this 3 candlestick pattern confirms that. however... the higher timeframes are in a wide range. so, if we reverse the bearish candlestick >5720 i believe we can retrace a bit... maybe revisit the sell fell off area.
***to invalidate the sell trigger, we need to bet above the doji.
***if we do keep rocking and rolling... note this area. it is an unfilled gap as of now. if it gaps down, wait to see how 1st 15-30mins react. looks like ES-emini gapped down a bit. that may be it, but this is an A+ set up for a trip back to take out short term lows at least. tootles!
For more on the pattern... I love the breakdown/visual provided here:
alchemymarkets.com

Don’t Let a Green Candle Fool YouDon’t Let a Green Candle Fool You | SPX Analysis 01 April 2025
We got the “boing” – but not the bounce that changes anything meaningful.
Monday opened like a trap door - gap down, quick poke near 5500, and then a full day of rallying that had CNBC anchors high-fiving like they just called the bottom of the century.
Except… they didn’t.
We’ve seen this act before. One-day rallies that puff up like a balloon, then vanish. And just like before, I’m not chasing a single green candle or headline optimism. I’m not a bull until 5700 is reclaimed - simple as that. That’s the bear flag failure point, the GEX pivot, and my personal line in the sand.
So while the crowd celebrates a maybe-double-bottom, I’m keeping my slippers firmly on the bear side of the wardrobe. And if Monday proved anything, it’s this…
Sometimes, the trades you forget about end up being the ones that pay.
This Bounce Doesn’t Fool Me – Here's Why I’m Still Short
Let’s call it what it is: a rally inside a bearish structure. Until we break the top of that structure, it’s just noise.
Here’s what really matters:
Monday gapped down, dropped toward 5500, and then staged a rally.
Everyone’s calling “double bottom!” - but I’ve seen more convincing bottoms on a bowling ball.
These reversal days have been common lately – I counted five in the last six weeks.
We’re still under 5700, which is the GEX flip, the flag failure, and the bullish invalidation.
That means I’m still riding:
Bear Swing #1 – opened last week, still on.
New aggressive shorts – 10-min bearish Tag ‘n Turn below 5500 only.
Bonus: A Forgotten Trade Hit Target on Monday
You’ll love this.
I had a bearish swing from around 20 March. Honestly, I forgot about it. Wrote it off. It was gathering dust in the corner of my options book.
Then, boom – Monday open… "Order Filled".
Target hit. Gap did the job. Payout in the pocket.
It’s a reminder every trader needs:
“It ain’t over until expiration… and sometimes not even then.”
GEX Analysis Update
Whole and half numbers acting as support and resistance
Expert Insights: Avoid These Rookie Mistakes
❌ Mistake #1: Getting Sucked Into Green Candles
Just because the market bounced doesn’t mean it’s time to flip bull. Watch the levels, not your feelings.
❌ Mistake #2: Cancelling Too Early
The Trade’s Not Over Just Because You’re Bored
Most traders kill good trades because they get impatient.
They cancel too soon. They “manage the trade” to death. Or worse, they chase a green candle and flip bias on a whim.
Here’s what Monday reminded us:
✅ Let the trade breathe.
That bear swing from 20 March? Forgotten. Ignored. Hit target anyway.
✅ Stick to your plan, not your mood.
The market rallied. But did it change the structure? No. Still below 5700. Still bearish bias.
✅ A good trade doesn’t need your babysitting.
Set the rules. Place the trade. Walk away. Check back later with a smile.
The traders who win are the ones who stop trying to outsmart their own system.
---
Fun Fact
In 1999, a 15-year-old stock trader named Jonathan Lebed made over $800,000 pumping penny stocks from his bedroom... before the SEC came knocking.
Moral of the story? Markets will always reward confidence, consistency, and a little bit of cunning – but it’s the trader who sticks to a rule-based system who lasts beyond the headlines.
Nightly $SPY / $SPX Scenarios for April 1, 2025🔮 🔮
🌍 Market-Moving News 🌍:
🇺🇸📈 ISM Manufacturing PMI Release: The Institute for Supply Management (ISM) will release its Manufacturing Purchasing Managers' Index (PMI) for March. A reading below 50 indicates contraction in the manufacturing sector, which could influence market sentiment.
🇺🇸🏗️ Construction Spending Data: The U.S. Census Bureau will report on February's construction spending, providing insights into the health of the construction industry and potential impacts on related sectors.
🇺🇸📄 Job Openings Report: The Job Openings and Labor Turnover Survey (JOLTS) for February will be released, offering a view into labor demand and potential implications for wage growth and consumer spending.
📊 Key Data Releases 📊
📅 Tuesday, April 1:
🏭 ISM Manufacturing PMI (10:00 AM ET):
Forecast: 49.5%
Previous: 50.3%
Assesses the health of the manufacturing sector; a reading below 50% suggests contraction.
🏗️ Construction Spending (10:00 AM ET):
Forecast: 0.3%
Previous: -0.2%
Measures the total value of construction work done; indicates trends in the construction industry.
📄 Job Openings (10:00 AM ET):
Forecast: 7.7 million
Previous: 7.7 million
Provides insight into labor market demand by reporting the number of job vacancies.
⚠️ Disclaimer: This information is for educational and informational purposes only and should not be construed as financial advice. Always consult a licensed financial advisor before making investment decisions.
📌 #trading #stockmarket #economy #news #trendtao #charting #technicalanalysis

ES1 2025-03-31 SPOOZ 15minOBHello everyone, I hope you won, stayed out, or learned something form the market today 😂.
Today was a easy grab.
Drawdown: 17. Tics
TP: 111. Tics Grabbed (out of 438)
Spooz Open Manipulation,
Broke near high,
Retraced to 15min Order Block,
TP Hit at 3 equal Highs (volume).
If you found this inciteful, join our group discussion! (link in bio)

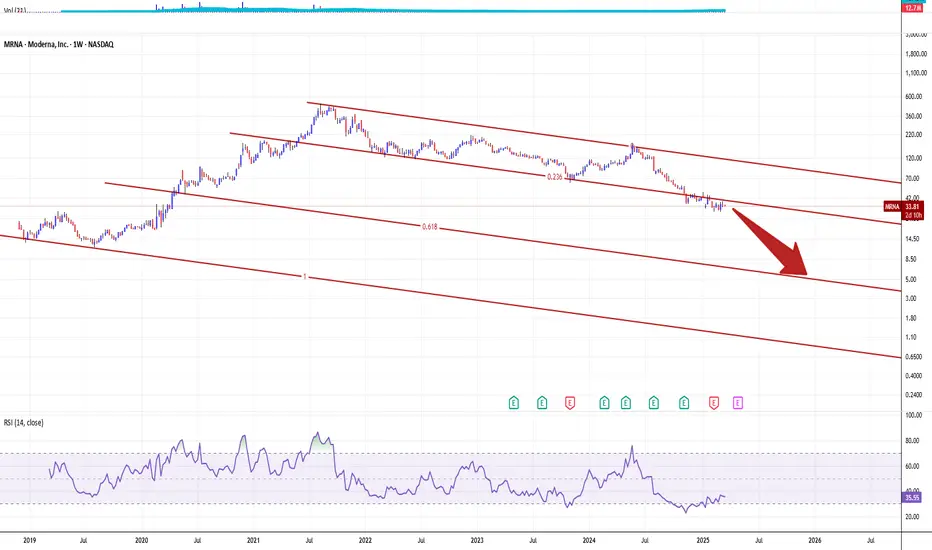
Moderna. Why Anti-Covid19 Juggernaut Goes 'The Bloodmachine'It's gone 5 years or so... (Duh..? 5 years, really? 🥴) since everyone was talking about COVID-19 pandemic, vaccines, "world will never be the same again", and so on.
- And now?..
- It's gone. It's absolutely gone..! Since nothing last forever and no one should chase a feather, or dust in the wind.
This is why we at our 💖Super-Duper Beloved @PandorraResearch Team decided to build this idea, as a educational idea to learn, even this story is about single Moderna stock, and we have reasonable considerations about fundamental, technical and price movement perspectives.
Well.. Let's the story begin...
Over the past few years, Moderna's stock has experienced a significant decline, primarily due to several key factors.
Here's a detailed explanation of why Moderna's stock has been moving downward:
1. Declining Demand for COVID-19 Vaccine
The primary reason for Moderna's stock decline is the waning demand for COVID-19 vaccines. During the pandemic, Moderna's mRNA-based vaccine was one of the first and most widely used, leading to a surge in sales and profitability. However, as the pandemic transitioned into an endemic phase, demand for vaccines decreased substantially. This shift has resulted in declining sales for Moderna, impacting its revenue and profitability.
2. Sales Guidance and Performance
In recent years, Moderna has faced challenges in meeting sales expectations. For instance, in 2025, the company forecasted sales between $1.5 billion and $2.5 billion, which was significantly lower than analysts' expectations of around $2.9 billion. This discrepancy led to a sharp decline in stock prices as investors became increasingly pessimistic about the company's future growth prospects.
3. Cost-Cutting Measures
To mitigate the impact of declining sales, Moderna has implemented cost-cutting measures. The company plans to reduce its cash operating costs by $1 billion in 2025 and an additional $500 million in 2026. While these efforts aim to improve profitability, they also reflect the challenges Moderna faces in maintaining its financial health without strong vaccine sales.
4. Competition in New Market s
Moderna is expanding into new markets, such as the respiratory syncytial virus (RSV) vaccine space, with its product mResvia. However, this market is highly competitive, with established players like Pfizer and GSK already present. The competition and uncertainty about market share have contributed to investor skepticism about Moderna's ability to drive growth through new products.
5. Delayed Break-Even Point
Initially, Moderna aimed to break even on an operating cash cost basis by 2026. However, this goal has been pushed back to 2028, indicating a slower-than-expected transition to profitability. This delay has further eroded investor confidence in the company's ability to execute its strategic plans effectively.
6. Valuation and Market Performance
Moderna's stock has underperformed both the industry and the broader market. The stock trades below its 200-day and 50-day moving averages, reflecting a lack of momentum. Additionally, Moderna's price-to-sales ratio is lower than the industry average, which might suggest undervaluation but also indicates a lack of investor enthusiasm for the stock.
7. Analyst Sentiment and Profitability Forecasts
Analysts have become increasingly pessimistic about Moderna's prospects, with many not expecting the company to turn profitable again until at least 2029. This negative outlook has contributed to the downward pressure on the stock. Furthermore, estimates for loss per share have increased, reinforcing the bearish sentiment among investors.
In summary, Moderna's stock decline is primarily driven by declining vaccine demand, missed sales expectations, increased competition in new markets, delayed profitability, and negative analyst sentiment. While the company is taking steps to adapt to these challenges, the path to recovery remains uncertain, contributing to ongoing investor skepticism.
--
Best 'No more Covid' wishes,
@PandorraResearch Team 😎
S&P500 during TRUMP's 2018 vs 2025 TRADE WAR.The S&P500 index (SPX) has started off the year in disappointing fashion as since mid-February the market has corrected by over -10% and of course almost all of it is attributed to the trade tariffs imposed by President Trump. As you know, this is not the first time Trump goes into a Trade War. The 1st has started in January 2018 when the first tariff announcements were made against China.
We can say that Trump's 2nd Trade War officially started on March 03 2025, with tariff implementations against Mexico, Canada and China. As you can see, the build up to both Trade Wars has been identical both in structural price count and in 1W RSI terms.
By the week of February 05 2018, the index has dropped by a little over -11%, hit the 1W MA50 (blue trend-line) and the 0.236 Fibonacci retracement level and rebounded, while the 1W RSI formed a Lower Low. We can claim that this are roughly the levels we are now. That drop started a Megaphone pattern, which ran through all of 2018. The ultimate bottom for this Megaphone Trade War pattern came in December 24 2018 on the 1W MA200 (orange trend-line).
Right now, the 1W RSI is almost on Lower Lows while crossing below its 1W MA50 and what remains to be seen is if it will hit its 0.236 Fib to form the bottom of the Megaphone or will rebound now.
Do you think Trump's 2nd Trade War will keep the market highly volatile within a Megaphone or will plunge it even more?
-------------------------------------------------------------------------------
** Please LIKE 👍, FOLLOW ✅, SHARE 🙌 and COMMENT ✍ if you enjoy this idea! Also share your ideas and charts in the comments section below! This is best way to keep it relevant, support us, keep the content here free and allow the idea to reach as many people as possible. **
-------------------------------------------------------------------------------
💸💸💸💸💸💸
👇 👇 👇 👇 👇 👇
