2024-11-28 - priceactiontds - daily update - sp500Good Evening and I hope you are well.
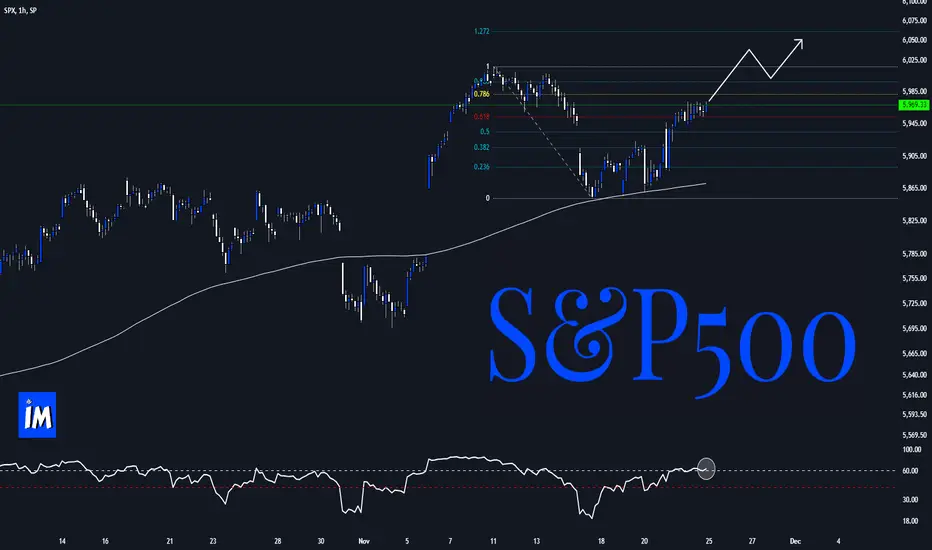
sp500 e-mini futures - Same as for dax. Retest of yesterday’s open price and bears could only correct sideways and biggest dip was 5 points. Big bull trend line was support and we are on our way up. I expect 6040 and probably higher. If not tomorrow then next month. We have a perfect channel upwards which leads 6100+. I don’t think bears can even get below 6015 again. If they do, 6000 has to hold or we could have seen the highs.
comment: Not much difference to my dax outlook. Relentless buying today, ath in sight and a decent channel upwards. Bears need something below 6000 to make bulls cover. Big bullish bias for me. Possible that we stay around 6000-6050 for November, to then do the Santa rally somewhere in December. Closing 2024 above 6000 would be amazing for bulls.
current market cycle: bull trend
key levels: 6000 - 6050 (above 6050 comes 6100 in play)
bull case : Higher lows and higher highs. Clear invalidation price given and big resistance above. I doubt bears can get this below 6010/6015 tomorrow. Only longs for me. If we stall around 6040, you should have a tight stop and from a r:r perspective, new longs above 6040 are bad.
Invalidation is below 6010.
bear case: Bears need something below 6000. That’s it. How likely is that? Look at the daily chart. Is there any bearishness in there?
Invalidation is above 6050.
short term : Bullish.
medium-long term - Update from 2024-11-16: So the top definitely qualifies as a blow-off top but the question if we continue further up, is still valid. It is possible that we are already inside the correction and if we continue below 5860, I highly doubt bulls can get above 6000 again. Given the current market structure, I won’t turn bear because the risk of another retest of the highs or even higher ones are just too big.
current swing trade: Nope
trade of the day: Could have bought pretty much anywhere.
SPX (S&P 500 Index)

S&P 500: A +0.2% Gain Following a Day of DeclineS&P 500: A +0.2% Gain Following a Day of Decline
The S&P 500 rebounded with a modest 0.2% gain today, recovering some ground after yesterday’s 0.5% decline. The market’s move reflects ongoing digestion of mixed US economic data, supportive seasonality, and cautious optimism among investors.
US Economic Data Highlights
Yesterday’s data provided a mixed snapshot of the US economy, contributing to the market’s recent fluctuations:
- **EIA Crude Oil Inventories:** Fell by -1.844M barrels, exceeding the forecast of -1M, signaling tighter supply conditions.
- **US GDP Growth (Q3, Second Estimate):** Steady at 2.8%, unchanged from the previous estimate, highlighting consistent economic expansion.
- **Personal Consumption and Spending:** October’s real personal consumption rose by just 0.1% (forecast: 0.2%), while consumer spending grew by 0.4%, meeting expectations but showing a slowdown from revised data of 0.6%.
- **Durable Goods Orders:** Increased by 0.2%, falling short of the 0.5% forecast, reflecting weaker demand for long-term goods.
- **PCE Price Index (YoY):** Increased to 2.3%, matching expectations but higher than the prior 2.1%, indicating persistent inflationary pressures.
Market Sentiment and Seasonality
Seasonality continues to work in favor of the S&P 500, as historical trends during this period often support equities. The **Fear & Greed Index**, currently at **64 points**, reflects moderate optimism and a "Greed" sentiment, which typically aligns with risk-on behavior in the markets.
Rate Cut Expectations
Markets remain focused on the Federal Reserve’s upcoming meeting on **December 18th**, with a **66,3%% probability** currently priced in for a **25 basis-point rate cut**. Such a move could provide additional support for equities by easing financial conditions, though its long-term impact remains uncertain.
Geopolitical Risks
While market sentiment has improved slightly, risks remain in the background. The ongoing war in Ukraine continues to pose threats to global stability, with potential knock-on effects on energy prices, supply chains, and economic performance.
Long-Term Trend Intact, but Volatility Likely
The S&P 500’s long-term upward trend remains intact, bolstered by supportive seasonality, stable GDP growth, and investor optimism. However, the current environment of mixed economic data and rising policy uncertainty suggests that market volatility could persist in the short term.
Broader Context
Yesterday’s data underscored a steady but moderating US economy, while forward-looking risks remain:
- **Global Economic Outlook:** The S&P Global forecast anticipates global GDP growth of approximately 3% by 2025, with US growth slowing to below 2% next year and China toward 4%.
- **US Policy Risks:** Potential policy shifts under the new administration could elevate inflation pressures and tighten financial conditions, introducing further uncertainty for equity markets.
Implications for S&P 500
Today’s modest gain shows resilience in the face of mixed signals from economic data and global risks. With supportive seasonality and a strong likelihood of a December rate cut, the S&P 500 may find short-term support. However, investors should remain vigilant, as volatility is likely to persist amid policy uncertainties and geopolitical risks.
What’s your outlook for the S&P 500 after today’s rebound? Can the market sustain its gains, or will headwinds from mixed data and global risks take over? Share your thoughts in the comments!

Thanksgiving Thoughts on SPXHoliday Idea: I spy a two bar pattern for the last two weeks; Piercing Candlestick Pattern. A slight pullback may be possible. Above this week's close, I will target the previous week's open/high. A caution is that I see this on the weekly chart near ATH. A flip would be a break and close below last week's candle (5850). If we gap down Monday due to the location of that close, I'll wait to see if we get back above 5850. So I'm resting and betting on my understanding.
Google Homework: piercing line candlestick pattern

$SPY Trade Alert from 11/25 (Update) | 31% ROI TodayOur AMEX:SPY range trading strategy is in full-effect.
We talked on livestream about trading the upside to $600 (from $598) and that trade paid out handsomely.
I think we could expect $605 tomorrow if price action continues to the upside.
I will continue to update as these trades play out, week after week!

S&P500 Don't expect the rally to stop now.Our last S&P500 (SPX) analysis (November 18, see chart below) gave us the ideal buy entry on the 0.5 Fibonacci retracement level, with the price immediately responding with a rebound:
The rebound took place on the 4H MA200 (orange trend-line) and we are now even past the 4H MA50 (blue trend-line). Despite the strong uptrend, this rally is far from over technically, as not only is the 4H RSI below the (70.00) overbought barrier where it has given the first bearish signs near the two previous Higher Highs, but also significantly lower than the top (Higher Highs trend-line) of the September 06 Channel Up.
As a result we expect a continuation of the current Bullish Leg. The previous one peaked on the 1.786 Fibonacci extension, so our Target is now just below it at 6150.
-------------------------------------------------------------------------------
** Please LIKE 👍, FOLLOW ✅, SHARE 🙌 and COMMENT ✍ if you enjoy this idea! Also share your ideas and charts in the comments section below! This is best way to keep it relevant, support us, keep the content here free and allow the idea to reach as many people as possible. **
-------------------------------------------------------------------------------
💸💸💸💸💸💸
👇 👇 👇 👇 👇 👇

Custom Crash Index Indicates Global Markets Are PanickingI believe the global markets are panicking related to Trump's pending inauguration and the fact that the US Fed may have to keep interest rates elevated through a US austerity process.
If you understand what this means, you'll clearly see why the US Dollar is trading above 106 and why Gold/Silver have moved downward recently.
The process of the US moving into smaller government with potentially $1.?T in excess capital means the US would move into a dynamic BEAST of a global economy. Able to pay down debt, restructure government agencies to become more efficient and lean, while pushing global economies closer and closer to having to clean up their own mess.
This is what I call the Predatory Fed.. and will likely prompt some very big price moves over the next 4-5+ years.
Get some.
#trading #research #investing #tradingalgos #tradingsignals #cycles #fibonacci #elliotwave #modelingsystems #stocks #bitcoin #btcusd #cryptos #spy #es #nq #gold

Daily Leading Indicators looking to turnaround PReviouslyly posted about the Bearish outlook for the Weekly :Leading Indicators... now it appears that Monday is giving the Daily Leading Indicators a new outlook.
A possible Bullish turnaround...
Breakdowns and Breakouts observed.

SPX to new ATH till next CPIThe correction is over and now SPX is looking at new ATH till Dec 11. Invalidated if breaks below the green line.

SPY 11/22 PlanUntil we are able to break above the trendline, We will continue to chop
Look at where they closed yesterday, right at it, and rejected.
We have to be patient, the move will come...
One thing to notice though was the retest of the trendline, as of now the retest was able to close above the trendline, but we need to see volume coming in for this move to happen.
If we go below 592 again, i believe we retest 589 fast.

S&P 500 Technical Analysis Ascending Triangle vs Rising Wedge I've identified two potential patterns on the S&P 500 SP:SPX chart:
Ascending Triangle (blue trendlines): Higher lows and flat highs, with breakout potential above the flat top or a breakdown below the higher lows. Indicated by blue arrows.
Rising Wedge Developing (red trend lines and arrows): Higher highs and higher lows, with a potential bearish breakout below the lower trend line or a less common bullish breakout above the upper trend line. Red arrows highlight the touch points on the rising wedge pattern.
Pattern Rules:
For a valid pattern, the following rules apply:
Ascending Triangle:
At least two higher lows
Flat highs
Decreasing volume
Breakout above the flat top or breakdown below the higher lows
Rising Wedge:
At least three touch points on each trend line (I will use as few as 2)
Higher highs and higher lows
Decreasing volume
Breakout below the lower trend line or above the upper trend line (less common)
Quick Review for Beginners:
New to chart patterns? Here's a quick rundown:
Higher lows: A series of lows that are higher than the previous ones.
Flat highs: A series of highs that are roughly the same level.
Decreasing volume: The trading volume decreases as the pattern forms.
Breakout: When the price moves above or below the pattern's boundary.
Trend lines: Lines drawn to connect the highs or lows of a pattern.
Keep in mind that chart patterns are not a guarantee of future price movements, but rather a tool to help identify potential trends and trading opportunities.

S&P 500 Weekly Recap: A Struggle to RecoverLast week’s market action reflected the ongoing struggle for recovery after the previous week’s sell-off. The market opened cautiously, with buyers stepping in to regain ground lost during the prior downturn. Despite early hesitation, bulls managed to push prices higher, eventually filling the gap created by the earlier sell-off. However, this recovery faced significant resistance from sellers, resulting in minimal upward progression in daily closes.
Strength in the recovery was primarily driven by Financials (XLF), which set a new all-time high. Other sectors, however, remained subdued, aligning with the broader market's hesitant tone. While this selectivity isn’t necessarily negative on its own, when combined with other signals, it may indicate growing risk aversion and a lack of conviction among market participants.
It is also worth zooming into the lower timeframes.
The 584 level provided key support but was retested multiple times during the week, which is not a good sign for buyers. Persistent tests of support typically indicate weakening demand, and bulls should be cautious of this development. Additionally, it was remarkable to observe how the rally went precisely to the Value Area Low ( 596 ) of the previous consolidation zone. Buyers should note that the market failed to push higher and close within the value area, signaling potential exhaustion of the current recovery attempt.
The immediate objective for the bulls is to push above 596 , reclaiming the previous value area, which would provide stronger validation for the recovery. On the other hand, bears will be focused on taking down the 584 level, where there is likely big liquidity pool.
Next week is rich in terms of key events.
The FOMC minutes are scheduled for release on Tuesday, preceded by significant economic data on Wednesday. These releases will be closely scrutinized as investors remain deeply concerned about the possibility of a recession. Any signals pointing toward a slowing economy could spark fear and trigger increased volatility.
While the long-term market trend remains intact, the warning signs outlined above suggest that investors should hold off on adding to their positions for the time being.
P.S. ES futures are currently rising in the pre-market session. If this momentum doesn't transform into a sell-off after the bell, it will certainly be a positive sign for the buyers.

Es/SPX Morning Update Nov25thBuyers let patience pay off. Last week (and the week before) had formed a 2-week bull flag with 5980 resistance. Mentioned that if 6002 clears if could give us momentum to 6017. Buyers gapped up over night and now we are sitting exact at 6017.
As of now: Let runners ride if you have them. 6009 (weak) and 6002 are supports. Holding above keeps 6027-32, 6046+ in play. A failure at 6002 could lead to a gap fill lower.

S&P 500: Gains Driven by Data, Eyes on Key Events Next WeekS&P 500: Gains Driven by Data, Eyes on Key Events Next Week
The S&P 500 ended the week on a positive note, buoyed by strong economic data, robust corporate earnings, and supportive seasonality. However, investors are shifting their focus to critical upcoming events: the FOMC meeting on Tuesday and the PCE inflation report on Wednesday. These events have the potential to set the tone for the markets for the remainder of the year.
Mixed Economic Data
The past week brought a blend of economic data, with some encouraging signals and a few disappointments:
Initial Jobless Claims (Nov. 16): At 213K, the result came in better than the 220K consensus, underscoring the resilience of the labor market and reducing recession fears.
Philadelphia Fed Manufacturing Index (Nov.): Disappointed at -5.5 against expectations of 8, reflecting continued weakness in the manufacturing sector.
Michigan Consumer Sentiment Final (Nov.): Came in at 71.8, below the 73.7 forecast, indicating a slight dip in consumer confidence.
S&P Global Services PMI Flash (Nov.): Surprised to the upside with a reading of 57.0, exceeding the expected 55.2, highlighting the strength of the services sector.
Nvidia Shines Bright
Corporate earnings added to the bullish sentiment, led by Nvidia's impressive Q3 results. The company reported revenue of 35.08 billion dollars, significantly above the consensus estimate of 33.17 billion dollars. As a leader in AI-related technology and semiconductors, Nvidia's results lifted the broader tech sector and contributed to the S&P 500’s gains.
Market Sentiment and Seasonality
The Fear & Greed Index currently stands at 61, in the "Greed" zone, indicating a risk-on environment as investors show confidence in equities. Seasonality also plays a crucial role. Historically, the S&P 500 benefits from end-of-year trends, especially in an election year, when policymakers often aim to maintain market stability.
Challenges Ahead
While the current momentum is positive, the market faces significant tests next week with two major events:
FOMC Meeting (Tuesday): The Federal Reserve’s policy decisions and commentary will be in the spotlight. Investors will look for signals on whether the Fed plans to pause or keep the door open for further rate hikes in 2024.
PCE Inflation Report (Wednesday): The core PCE inflation data, the Fed's preferred measure of price pressures, could shape expectations for monetary policy. A higher-than-expected reading might increase concerns about further tightening, while a lower figure would reinforce the soft landing narrative.
Lingering Risks
In addition to the upcoming macroeconomic events, investors remain wary of:
Trade Policy: Former President Donald Trump’s proposed tariffs on imported goods could stoke inflation and weigh on economic growth.
Geopolitics: The ongoing risk of escalation in the Ukraine conflict continues to loom over global markets.
Soft Landing: The Baseline Scenario
Looking at the current data, the S&P 500 appears to be on the path to a soft landing, supported by a strong labor market and robust technology sector performance. Favorable seasonality—both year-end trends and election-year dynamics—further bolsters the case for continued gains, which remains the baseline scenario for now.
Conclusion
The S&P 500 has shown strength, but next week’s FOMC meeting and PCE inflation report could reshape market dynamics. The key question is whether the data will support the soft landing narrative or signal a need for further monetary tightening.
What are your thoughts on the S&P 500’s outlook given the upcoming Fed meeting and inflation data? Will the index sustain its rally, or are we in for increased volatility? Share your insights in the comments.

SPX 25 Nov 2024 Bullish and Bearish ZonesBullish zone is above 5977
Bearish Zone is below 5961.5
Note: This is an opinion based on analysis, This is not a buy/sell call. Use stop loss.

Gold Spot intraday setup. The Pushmi - Pullyu animalRemember Dr. Dolittle? He was a vet who could talk to animals. One of the rarest was the “pushmi-pullyu,” a llama with two heads (one head was where the ass ought to be).
The pushmi-pullyu was a gentle creature that did not like to be stared at. And yet the other animals in Africa convinced him to go with the good Dr., and be put on display in Europe, because Dr. Dolittle was a kind soul who needed money to look after all the animals in his “care”.
It's gone a bit since Gold explosion last week, due to Biden's gaffe to authorize the yellow/blues regime use US-made missiles inside Russia's legal area, while the rods of Russia's retribution hanged like the sword of Damocles over all of Europe, on the basis of reciprocity.
Last week Gold spot added +153 US Dollars just in 5 Days. That was the best in history ever 1-week return, since January, 1980. Additionally, in percentage points Gold spot added +5.97 percent in a week. It was the 3rd best 1-week return over past decade.
Gold spot in Euro OANDA:XAUEUR at the same time continues its gain 11th straight month in a row.
The main intraday graph is for Gold spot OANDA:XAUUSD , and it indicates that Gold has retraced a bit to its key $2670 level (that was discussed in earlier published ideas), and ready to take Adv. again, since Trump-a-rally rolled out into the all-the-world fart.

#202447 - priceactiontds - weekly update - sp500 e-mini futuresGood Evening and I hope you are well.
tl;dr
sp500 e-mini futures: Bullish. 5 consecutive days where bears tried and bulls closed at the highs. Buy signals do not get better than this. Above 6000 we see 6050 and most likely an acceleration up to new highs. 6100 and 6150 the obvious next targets. Bears need a daily close below 5850 and would still have a bigger bull trend line to break there so the downside is likely limited.
Quote from last week:
comment: 50% retracement hit and market closed above it on Friday. My preferred path for next week is a huge bull reversal higher. Is this likely after 2 strong bear days? No it’s not, so I have to wait for either side to show a clear new direction or continuation. If this goes to 5800 without me, so be it. I think after such a big rally with follow through buying above 6000, a retracement to 50% is a buy and not a sell.
comment : Bullish bias I had, bullish it was. Market looks like it wants up bad. Every dip is bought heavily on increasing volume. Time is now to get above 6100 or we won’t get it at all. Market is beyond overvalued, overbought and the poor late bulls are just arriving. Guess who will be left holding the bags again.
current market cycle: Bull trend
key levels : 5850 - 6150 (maybe even 6200)
bull case: Last hurrah. 6100 is my first target but can absolutely go beyond 6200. Anything below 5800 would be the end of this. I don’t feel the need to explain this further. The chart is crystal clear. I have written about this blow-off top for many weeks. Just don’t forget to take profits before this turns badly. I do think the odds of this closing 2024 below 6000 are low but can absolutely happen. These bullish profits since August are outrageous and once the run for the exits begins, it will be ruthless.
Invalidation is below 5800.
bear case: Bears gave up on Friday. If they can’t get below 5900 on Monday, we will see a meltup. No bear will come around big time before 6050 and even then I think they will let the bulls show signs of exhaustion before they be aggressive.
Invalidation is above 5800.
outlook last week:
short term: I want to join the bulls again. Need strong confirmation first though. Still no interest in selling as of now.
→ Last Sunday we traded 5896 and now we are at 5987. Perfect outlook. Hope you made some.
short term: Bullish all the way. If market closes below 5900 I would turn neutral and daily close below 5800 would probably be the end of my bullish thesis and I turn bear.
medium-long term - Update from 2024-11-24: 6100+ are my last targets for the bulls before this bubble begins to pop or at least deflate.
current swing trade: None
chart update: Added potential bullish 5-wave series.

SPX: back on a trackTwo weeks ago markets passed through sort of a short term stress, related mostly to new names in the US administration, but it did not take too much time until the initial fear passed away. Markets were back on a track during the previous week. The S&P 500 made a move from 5.865 up to 5.969, where the index is ending the week.
Interestingly, tech companies were not the one to shine this week, however, the market switched attention toward the industrial and consumer sectors. In this sense, market favorite Nvidia lost 3,2%, while Alphabet dropped by 1,7%. Analysts are commenting that such a trend might continue till the year-end, as investors are turning their attention toward the more cyclical sectors. On the other hand, analysts from Swiss UBS bank commented that they continued to stay bullish on tech companies, especially those related to AI. Analysts specifically mentioned NVDA. Still, they are pointing toward the potential risk in the year 2025, which are related to “the product transition and tariff-related uncertainties”.

Full Game Plan for Monday Nov 25thPlan for Monday’s Session
Supports:
• Major: 5972, 5945, 5933, 5908, 5899, 5884-5882, 5869, 5855, 5845, 5828, 5818, 5802, 5782, 5760, 5752, 5731, 5709-11, 5691, 5683.
• Minor: 5980, 5967, 5961, 5957, 5948, 5944, 5928, 5922, 5914, 5904, 5893, 5878, 5865, 5850, 5839, 5835, 5812, 5806, 5793, 5777, 5740, 5721, 5702, 5695.
Resistances:
• Major: 5988, 6002, 6017, 6027, 6032, 6050, 6070, 6082, 6093, 6111-13, 6132, 6138, 6172, 6189.
• Minor: 5993, 5998, 6009, 6023, 6038, 6046, 6056, 6062, 6075, 6101, 6117, 6146, 6156, 6165, 6178.
**Context and Strategy:**
ES is coming off a strong Friday close at 5988, right at a key resistance zone. Price action remains in a clear uptrend, but with no major pullbacks or basing structure formed, actionable setups for Monday will require patience. Those who have been here should know what I'm going to say. My absolute least favorite time to trade is days after trend leg. My job is to get in before these big moves. After they play out, my job is done, and I just need to sit and wait for the next setup to appear. This requires one of two things 1) A sharp pullback or 2) Structure (basing to form). If we just keep trending up, there is nothing for me other than holding my runners and letting them do the work. Patients will be verified on Monday.
**Key Levels for Monday:**
1. First Support at 5972: A dip and recovery here could provide a solid base for continuation higher.
2. Major Support at 5945: If 5972 fails, 5945 becomes the next key level. This area has been well-tested and could provide a reaction or bounce, but the cleanest trade would come from a failed breakdown here.
3. Resistance at 6002: A breakout above this level opens the door for higher targets, including 6017 and 6027.
**Bull Case for Monday:**
• Hold Above 5972: Bulls maintain control as long as price holds 5972. A flag or consolidation at this level would create a strong base for a push higher.
• Breakout Through 6002: Reclaiming 6002 and holding above it could fuel momentum toward 6017 and 6027.
• Structure Above 5988: Building a base above 5988 and below 6002 creates a launchpad for further upside.
**Bear Case for Monday:**
• Breakdown Below 5972: A failure at 5972 would likely lead to a test of 5945. I’d need to see a good bounce attempt here and/or failed breakdown (something like test 5967 then recover 72). After this, I’d short below wherever the lows are (probably something like 5964).
• Failed Breakdown at 5945: As always, breakdown trades carry higher risk. Same drill at a 5972 short...A dip below 5945 that recovers quickly could signal a trap for shorts. Wait for confirmation (e.g., a bounce that pays out buyers and then a loss of the lows) before entering.
• Exhaustion at Resistance: Bears can also look for sell reactions at key resistances (6002, 6017) to test lower supports. I never short resistances. Win rate is too low for my liking
**Summary for Monday:**
• Bullish Lean: As long as 5972 holds, the short-term trend remains intact. Watch for opportunities to break out above 6002, targeting 6017 and 6027.
• Bearish Lean: Bears need to break below 5972 or 5945 to regain control and push the market lower toward 5933 and 5908. Failed breakdown setups, however, remain the safer option for entering long positions.
Reminder:
Patience is critical. It’s safer to wait for failed breakdown setups than longing after direct tests, especially at key supports, and confirm with volume before entering long positions if you want to be super precise. Avoid chasing momentum and let the market come to you.

S&P 500: Gains Driven by Data, Eyes on Key Events Next WeekS&P 500: Gains Driven by Data, Eyes on Key Events Next Week
The S&P 500 ended the week on a positive note, buoyed by strong economic data, robust corporate earnings, and supportive seasonality. However, investors are shifting their focus to critical upcoming events: the FOMC meeting on Tuesday and the PCE inflation report on Wednesday. These events have the potential to set the tone for the markets for the remainder of the year.
Mixed Economic Data
The past week brought a blend of economic data, with some encouraging signals and a few disappointments:
Initial Jobless Claims (Nov. 16): At 213K, the result came in better than the 220K consensus, underscoring the resilience of the labor market and reducing recession fears.
Philadelphia Fed Manufacturing Index (Nov.): Disappointed at -5.5 against expectations of 8, reflecting continued weakness in the manufacturing sector.
Michigan Consumer Sentiment Final (Nov.): Came in at 71.8, below the 73.7 forecast, indicating a slight dip in consumer confidence.
S&P Global Services PMI Flash (Nov.): Surprised to the upside with a reading of 57.0, exceeding the expected 55.2, highlighting the strength of the services sector.
Nvidia Shines Bright
Corporate earnings added to the bullish sentiment, led by Nvidia's impressive Q3 results. The company reported revenue of 35.08 billion dollars, significantly above the consensus estimate of 33.17 billion dollars. As a leader in AI-related technology and semiconductors, Nvidia's results lifted the broader tech sector and contributed to the S&P 500’s gains.
Market Sentiment and Seasonality
The Fear & Greed Index currently stands at 61, in the "Greed" zone, indicating a risk-on environment as investors show confidence in equities. Seasonality also plays a crucial role. Historically, the S&P 500 benefits from end-of-year trends, especially in an election year, when policymakers often aim to maintain market stability.
Challenges Ahead
While the current momentum is positive, the market faces significant tests next week with two major events:
FOMC Meeting (Tuesday): The Federal Reserve’s policy decisions and commentary will be in the spotlight. Investors will look for signals on whether the Fed plans to pause or keep the door open for further rate hikes in 2024.
PCE Inflation Report (Wednesday): The core PCE inflation data, the Fed's preferred measure of price pressures, could shape expectations for monetary policy. A higher-than-expected reading might increase concerns about further tightening, while a lower figure would reinforce the soft landing narrative.
Lingering Risks
In addition to the upcoming macroeconomic events, investors remain wary of:
Trade Policy: Former President Donald Trump’s proposed tariffs on imported goods could stoke inflation and weigh on economic growth.
Geopolitics: The ongoing risk of escalation in the Ukraine conflict continues to loom over global markets.
Soft Landing: The Baseline Scenario
Looking at the current data, the S&P 500 appears to be on the path to a soft landing, supported by a strong labor market and robust technology sector performance. Favorable seasonality—both year-end trends and election-year dynamics—further bolsters the case for continued gains, which remains the baseline scenario for now.
Conclusion
The S&P 500 has shown strength, but next week’s FOMC meeting and PCE inflation report could reshape market dynamics. The key question is whether the data will support the soft landing narrative or signal a need for further monetary tightening.
What are your thoughts on the S&P 500’s outlook given the upcoming Fed meeting and inflation data? Will the index sustain its rally, or are we in for increased volatility? Share your insights in the comments.

S&P 500 index short term outlookThe S&P 500 Index (SPX) is trading within an ascending channel on its daily chart, signaling a continuation of the bullish trend. This structure is defined by parallel rising trendlines connecting higher highs and higher lows, indicating strong buyer interest and sustained momentum.
Recent price action shows a breakout above minor resistance near the 5,900 level, confirming bullish sentiment. The index is currently moving toward the midpoint of the channel, with potential to test the upper boundary near 6,100. The lower trendline offers solid support, maintaining the channel's integrity.
Volume will be crucial in validating any further upward moves. Increased volume during an advance toward the upper boundary would strengthen the bullish case, while declining volume may indicate consolidation or a pause in the trend.
For traders, entering a long position while the index remains in the channel could be a viable strategy. A breakout above the upper boundary could present additional upside potential, with profit targets based on the channel's height projected upward. Stop-loss orders can be placed below the lower trendline or the most recent swing low near the 5,800 level to manage risk.
This setup suggests the SPX is poised for continued gains, provided the channel remains intact. However, a break below the lower trendline could signal a reversal, requiring caution and adjustment of trading strategies.

BRIEFING Week #47 : Caution Till 2025Here's your weekly update ! Brought to you each weekend with years of track-record history..
Don't forget to hit the like/follow button if you feel like this post deserves it ;)
That's the best way to support me and help pushing this content to other users.
Kindly,
Phil

S&P 500: Gains Driven by Data, Eyes on Key Events Next WeekThe S&P 500 ended the week on a positive note, buoyed by strong economic data, robust corporate earnings, and supportive seasonality. However, investors are shifting their focus to critical upcoming events: the FOMC meeting on Tuesday and the PCE inflation report on Wednesday. These events have the potential to set the tone for the markets for the remainder of the year.
Mixed Economic Data
The past week brought a blend of economic data, with some encouraging signals and a few disappointments:
Initial Jobless Claims (Nov. 16): At 213K, the result came in better than the 220K consensus, underscoring the resilience of the labor market and reducing recession fears.
Philadelphia Fed Manufacturing Index (Nov.): Disappointed at -5.5 against expectations of 8, reflecting continued weakness in the manufacturing sector.
Michigan Consumer Sentiment Final (Nov.): Came in at 71.8, below the 73.7 forecast, indicating a slight dip in consumer confidence.
S&P Global Services PMI Flash (Nov.): Surprised to the upside with a reading of 57.0, exceeding the expected 55.2, highlighting the strength of the services sector.
Nvidia Shines Bright
Corporate earnings added to the bullish sentiment, led by Nvidia's impressive Q3 results. The company reported revenue of 35.08 billion dollars, significantly above the consensus estimate of 33.17 billion dollars. As a leader in AI-related technology and semiconductors, Nvidia's results lifted the broader tech sector and contributed to the S&P 500’s gains.
Market Sentiment and Seasonality
The Fear & Greed Index currently stands at 61, in the "Greed" zone, indicating a risk-on environment as investors show confidence in equities. Seasonality also plays a crucial role. Historically, the S&P 500 benefits from end-of-year trends, especially in an election year, when policymakers often aim to maintain market stability.
Challenges Ahead
While the current momentum is positive, the market faces significant tests next week with two major events:
FOMC Meeting (Tuesday): The Federal Reserve’s policy decisions and commentary will be in the spotlight. Investors will look for signals on whether the Fed plans to pause or keep the door open for further rate hikes in 2024.
PCE Inflation Report (Wednesday): The core PCE inflation data, the Fed's preferred measure of price pressures, could shape expectations for monetary policy. A higher-than-expected reading might increase concerns about further tightening, while a lower figure would reinforce the soft landing narrative.
Lingering Risks
In addition to the upcoming macroeconomic events, investors remain wary of:
Trade Policy: Former President Donald Trump’s proposed tariffs on imported goods could stoke inflation and weigh on economic growth.
Geopolitics: The ongoing risk of escalation in the Ukraine conflict continues to loom over global markets.
Soft Landing: The Baseline Scenario
Looking at the current data, the S&P 500 appears to be on the path to a soft landing, supported by a strong labor market and robust technology sector performance. Favorable seasonality—both year-end trends and election-year dynamics—further bolsters the case for continued gains, which remains the baseline scenario for now.
Conclusion
The S&P 500 has shown strength, but next week’s FOMC meeting and PCE inflation report could reshape market dynamics. The key question is whether the data will support the soft landing narrative or signal a need for further monetary tightening.
What are your thoughts on the S&P 500’s outlook given the upcoming Fed meeting and inflation data? Will the index sustain its rally, or are we in for increased volatility? Share your insights in the comments.
Beautiful $SPX price action, ascending triangleLONG TERM TREND: Neutral/Bearish
TIMEFRAME: Intraday
What a textbook ascending triangle pattern we're witnessing on SP:SPX today! 👀
Price action has been absolutely pristine, giving us multiple touches on both the ascending support trendline and the horizontal resistance. Each bounce off support has been getting progressively higher, while sellers continue defending that key overhead level - classic ascending triangle behavior.
The swings within this pattern have been a trader's dream - offering clean entries and exits for those playing the range. We've seen buyers step in with conviction at each test of the rising support, leading to predictable bounces.
However, there's a concerning development here... While ascending triangles are typically considered bullish continuation patterns, the momentum on each bounce is getting noticeably weaker. Volume has been declining throughout the pattern formation (a bearish divergence), and the last two tests of resistance showed significant rejection wicks.
If this declining momentum continues, watch for a break below the ascending support line. Such a break would likely trigger a cascade of stops and could lead to an accelerated move lower. Key levels to watch would be 5950, 5940 and ultimately 5925.
Remember to always manage risk and size positions appropriately. No pattern is guaranteed to play out as expected.
What are your thoughts on this setup?
#SPX #TechnicalAnalysis #ChartPatterns
