S&P 500 Futures Hold Ground After Tariffs Take EffectS&P 500 Futures Rise After New Tariffs Kick In
President Trump's sweeping tariffs officially took effect just after midnight, escalating trade tensions with dozens of countries. While negotiations are ongoing behind the scenes to secure exemptions and reduce tariff rates, market reactions are already underway.
Technical Outlook
S&P 500 Futures continue to show bullish momentum as long as price trades above 6289, with the potential to retest the All-Time High (ATH).
To confirm a move toward 6453, price must close above 6437 on the 1H chart.
🔻 However, if the price stabilizes below 6389, a correction toward 6365 becomes more likely.
Key Levels:
🔹 Resistance: 6424 – 6453
🔹 Support: 6365 – 6341
S&P 500 (SPX500)

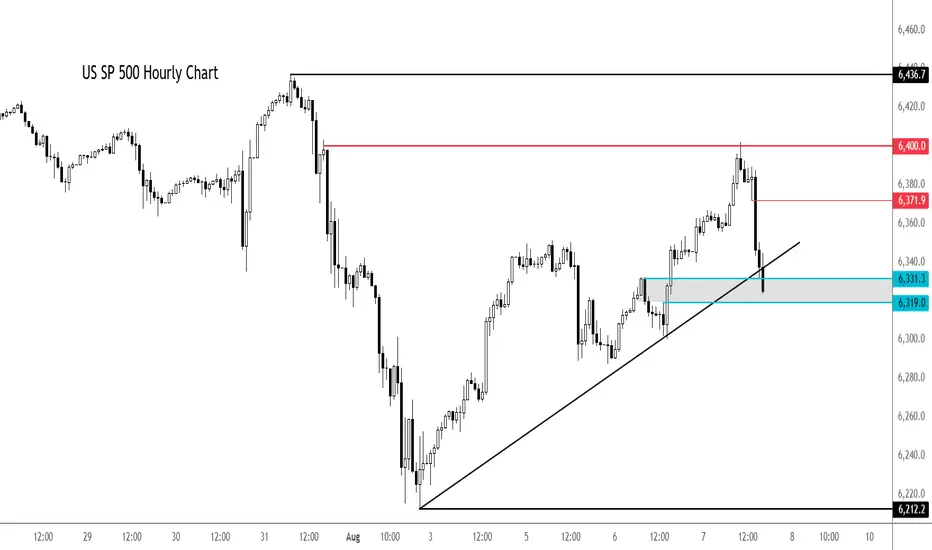
S&P 500 extends drop - can dip buyers come to rescue again?After a decent rally earlier in the day, the major indices and futures started to ease off around mid-morning London trade, before easing further lower in the last couple of hours.
At the time of writing, the S&P was testing its session lows. Here it was probing support and a short-term bullish trend line in the 6319-6331 range. This area needs to hold to keep the bulls happy and in charge. Break this and we could see a bigger correction in the days ahead.
Resistance now comes in at 6372 followed by 6,400.
By Fawad Razaqzada, markets analyst with FOREX>com
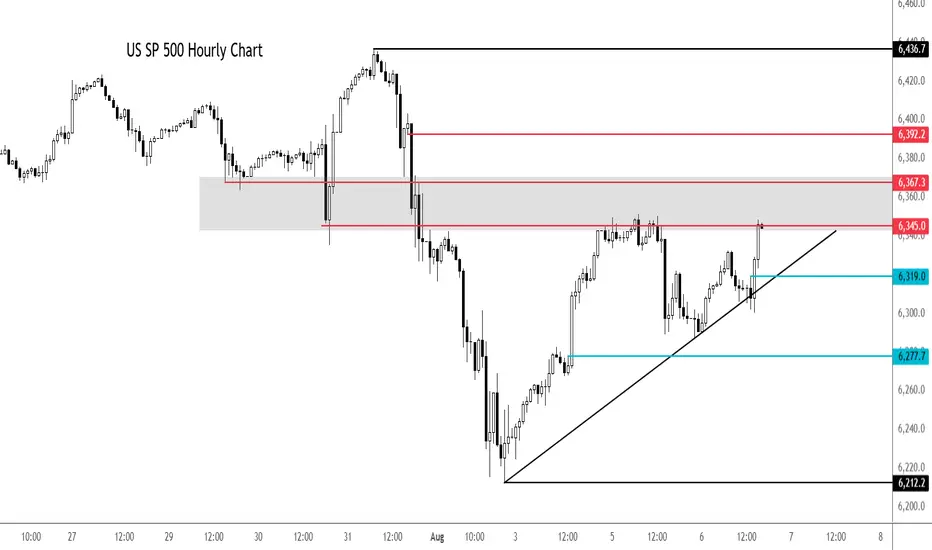
S&P 500 extends rally despite macro concernsThe 5% Apple rally aside, it is all about rate cut bets vs. strong earnings. So far, the latter has helped to keep US markets supported near all-time highs. But if macro concerns increase further, investors' perception about future earnings growth will weaken. And with that, we could see some cracks in expensive stocks.
Looking at the hourly chart of the SPX500, the US benchmark was testing a potential resistance zone in the shaded region between 6345 to 6367, an area which was previously support. Above this zone, 6392 is the next level of potential resistance and then the all-time high of 6436 comes into focus next.
earlier, the index bounced after a failed breakdown below the trend line shown on the chart. Another potential test of the trendline could see the index break lower. Short-term support is seen around 6319 then 6277.
By Fawad Razaqzada, market analyst with FOREX.com
SPX500 at Key Pivot – Bearish Below 6365, Bullish AboveSPX500 – Market Overview
U.S. stock index futures rose on Friday after President Donald Trump’s temporary pick for a Federal Reserve governor boosted expectations for a more dovish central bank board.
Technical Outlook
Stability below 6365, we expect a move down toward 6341.
A 1H close below 6321 would likely extend the bearish trend toward 6301.
A 1H close above 6365 could trigger a push toward 6389.
A confirmed break above 6389 would shift the bias to bullish, targeting 6425 and 6453.
Pivot Line: 6365
Resistance: 6389 – 6425 – 6453
Support: 6341 – 6321 – 6301

Day 4 — Trading Only S&P Futures — +$207, Patience Pays OffWelcome to Day 4 of Trading Only S&P Futures!
After two tough losing days, I took a morning yoga session to clear my mind and approach the market calmly. I started trading late but found a strong A+ setup near 6355, aligned with a major gamma zone and RSI signals, which led to a $200+ profit.
📈 What you’ll learn
The importance of mindset and mental clarity in trading
How to identify strong setups using market structure and gamma zones
Reading RSI on multiple timeframes for confirmation
Managing risk and knowing when to call it a day
⏰ Timestamps
0:00 — Intro & Day 4 Overview
0:30 — Mindset Reset & Trade Recap
1:30 — VX Algo Signal Recap & Setup Breakdown
3:00 — Market News & Impact
3:30 — Key Levels for Tomorrow
4:00 — Closing Thoughts & Next Steps
🔔 VX Algo Signals (9:30am – 2pm EST)
9:39 AM Market Structure flipped bullish on VX Algo X3!
11:20 AM VXAlgo ES X1 Buy signal (triple buy)
11:52 AM VXAlgo ES X1 Buy signal
12:40 PM VXAlgo ES X1 Sell signal
📰 News Highlights
U.S. jobless claims rose to 226,000 vs. estimate 221,000, signaling increased layoffs.
🔑 Key Levels for Tomorrow
Above 6332 = Remain Bullish
Below 6315 = Bearish

S&P bullish continuation supported at 6340Tariff Turmoil and Geopolitical Shifts – Implications for S&P 500 Trading
Donald Trump's sweeping new tariffs officially took effect, hitting nearly all U.S. trading partners. Switzerland, facing the steepest rates among developed nations, may retaliate by cancelling a major fighter jet purchase, signaling potential defense-sector implications.
Key developments:
Semiconductor imports to face 100% tariffs, unless production is moved onshore – a bullish signal for domestic chipmakers (e.g., Intel, GlobalFoundries) but negative for firms reliant on overseas fabs.
Additional tariffs floated on China over purchases of Russian oil, echoing similar penalties on India – suggesting growing fragmentation in global trade.
Market impact:
S&P 500 sectors likely affected:
Tech (Semis): Tariff pressure may weigh on multinationals like Nvidia or AMD short term, but benefit domestic fabs and U.S.-based supply chains.
Industrials/Defense: Swiss retaliation could ripple through defense contractors if deals are halted.
Energy/Commodities: Any China-Russia oil tensions could lead to energy volatility, affecting names like ExxonMobil or ConocoPhillips.
Meanwhile, China’s exports unexpectedly rose, softening the blow from the U.S. tariff crackdown. Chinese equity gains could calm broader EM sentiment, helping mitigate global risk-off contagion.
Finally, Trump signaled potential peace talks with Putin and Zelenskiy, with the Kremlin confirming a Putin meeting soon. A diplomatic breakthrough could ease geopolitical risk, supporting investor sentiment and equities globally.
Bottom Line for S&P 500:
Expect sector rotation as traders digest tariff fallout. Watch for:
Strength in domestically focused tech and defense stocks
Caution around globally exposed industrials and semis
Short-term volatility tied to trade rhetoric and geopolitical headlines
Key Support and Resistance Levels
Resistance Level 1: 6437
Resistance Level 2: 6480
Resistance Level 3: 6520
Support Level 1: 6340
Support Level 2: 6295
Support Level 3: 6256
This communication is for informational purposes only and should not be viewed as any form of recommendation as to a particular course of action or as investment advice. It is not intended as an offer or solicitation for the purchase or sale of any financial instrument or as an official confirmation of any transaction. Opinions, estimates and assumptions expressed herein are made as of the date of this communication and are subject to change without notice. This communication has been prepared based upon information, including market prices, data and other information, believed to be reliable; however, Trade Nation does not warrant its completeness or accuracy. All market prices and market data contained in or attached to this communication are indicative and subject to change without notice.

Day 3 — Trading Only S&P 500 FuturesDay 3 — Trading Only S&P Futures
Daily P/L: -142.87
Sleep: 7 hours
Emotions: Headache & stress from the morning
:thought_balloon: Today’s Trade thoughts:
I made a typo when i was putting some orders in from last night that triggered and started the day -300 so I spent most of today just grinding it back again.
I think going forward, I am going to make a rule to limit myself of only doing 2 MES MAX during night time if i plan to put orders in because it really sadden the mood when you start the day negative.
Overall, today's trading day wasn't that bad, we had bullish structure and AAPL event that carried the market up. I took some shorts at 6355 that didn't work out but eventually made money at the end of the day as i shorted 6375 zones. I have noticed that** max Gamma levels don't truly settle until 11am. **
:bell:News Highlights:
*TRUMP TO IMPOSE ADDITIONAL 25% TARIFF ON GOODS FROM INDIA
:bar_chart: VX Algo Signals (9:30am – 2pm EST):
9:30 AM Market Structure flipped bullish on VX Algo X3! @everyone*
10:20 AM VXAlgo NQ X1 Sell Signal
11:00 AM Market Structure flipped bullish on VX Algo X3!
11:40 AM VXAlgo ES X1 Sell Signal
12:20 PM VXAlgo ES X1 Sell Signal (double sell)
1:40 PM VXAlgo NQ X1DD Buy Signal (double buy)
:chart_with_upwards_trend: Key Levels for Tomorrow:
Above 6332 = Remain Bullish
Below 6315 = Bearish

3rd Wave About to Start in Ingersoll Rand (IR)Good looking Elliott Wave setup in NYSE:IR
Stock rose in clean 5 waves impulse wave followed by 3 waves down in ABC to almost exactly at 61.8% level around 75. If the wave C low 73.87 holds then we can expect another 5 wave rise in larger (3) or (C) on the upside. As per wave equality principle, we can expect it to be same in size as the previous 5-wave rise seen in the chart. That gives a potential target of 98.7 for current levels. 1.618 times of the move is at 114.04 which could be second (extended) target.
Note that invalidation level for this setup is wave C low at 73.87.

THE RESULTTHE RESULT
Follow for more Simple And accurate swing analysis on Indices, Currency, Commodities.

This V-Pattern on SPX500 Is Stupid CleanHey, it’s Skeptic.
In this video, I’m breaking down a clean V-pattern setup on SPX500 — right in line with what I taught in yesterday’s educational post.
We’re starting from the Daily time frame and walking through the logic behind my long trigger, why the previous fakeout was actually useful, and how to set your stop-loss depending on your trading style (H4 vs 15min).
This isn’t just chart talk — it’s about reading the story behind the candles.
If it helped you see things clearer, give it a boost and drop your thoughts below.
Let’s keep learning — one trap at a time.
Until next time, peace out.
📌 Disclaimer: This video is for educational purposes only and does not constitute financial advice. Always do your own research and manage your risk.

S&P500 at pivot zone Stocks are climbing higher, with S&P 500 futures up on hopes for interest rate cuts and solid company earnings. The outlook is positive, especially in the finance world—bankers, hedge funds, and asset managers are expected to get higher bonuses this year, reflecting stronger market conditions.
On the global front, the US is looking to tighten control over chip exports to China by adding better tracking in semiconductors. At the same time, Taiwan’s TSMC reported a possible leak of trade secrets, which led to arrests.
Trade talks are also heating up. Japan and Switzerland are sending officials to the US to push for lower tariffs, while India’s government is heading to Moscow just after criticism from the US over its Russian oil purchases.
Conclusion for S&P 500:
The rally has strong backing from earnings and rate-cut hopes, but investors should be alert. Rotation into small-cap stocks could continue, while tech and chip sectors may face headwinds from new trade and security pressures.
Key Support and Resistance Levels
Resistance Level 1: 6380
Resistance Level 2: 6400
Resistance Level 3: 6436
Support Level 1: 6295
Support Level 2: 6256
Support Level 3: 6214
This communication is for informational purposes only and should not be viewed as any form of recommendation as to a particular course of action or as investment advice. It is not intended as an offer or solicitation for the purchase or sale of any financial instrument or as an official confirmation of any transaction. Opinions, estimates and assumptions expressed herein are made as of the date of this communication and are subject to change without notice. This communication has been prepared based upon information, including market prices, data and other information, believed to be reliable; however, Trade Nation does not warrant its completeness or accuracy. All market prices and market data contained in or attached to this communication are indicative and subject to change without notice.
S&P500’s Bullish Island Turns Risky: Elliott Wave Says “Top”The S&P500 Index( SP:SPX ) started to rise and even created a new All-Time High(ATH=$6,428) with the help of the Bullish Long Island Pattern , as I published in my previous idea on May 14, 2025 .
The S&P500 Index is currently moving near the Potential Reversal Zone(PRZ) , upper line of the ascending channel , the Important Resistance line , and the Yearly Resistance(1) .
In terms of Elliott Wave theory , the S&P500 Index appears to be completing microwave 5 of microwave 5 of the main wave 5 .
Also, we can see the Regular Divergence(RD-) between Consecutive Peaks .
I expect the S&P500 Index to correct at least -4% and fall to the lower line of the ascending channel .
First Target: $6,233
Second Target: $6,033
Note: Stop Loss(SL) $6,513
Do you think S&P500 Index can create a new ATH above $6,500 !?
Please respect each other's ideas and express them politely if you agree or disagree.
S&P 500 Index Analyze (SPX500USD), Daily time frame.
Be sure to follow the updated ideas.
Do not forget to put a Stop loss for your positions (For every position you want to open).
Please follow your strategy and updates; this is just my Idea, and I will gladly see your ideas in this post.
Please do not forget the ✅' like '✅ button 🙏😊 & Share it with your friends; thanks, and Trade safe.

The Platinum BulletOver the years, I have posted a lot of educational content here on TradingView. Everything from Elliot waves to Wyckoff, psychology to Gann.
I have been lucky as a trader, 25 years doing this you pick up a thing or two. But above everything else, what you realise is that trading is a mindset game and not a technical one.
Many new traders try their luck. They are either experts in another field or simply successful in something else, or they come to the trading arena seeking wealth.
Both tend to get humbled quickly.
It is common for many new traders to put so much emphasis on the strategy, they overlook the psychology. You see, a strategy might work for someone, but you can't get it to work for you. This could simply be the time on the charts you lack, the timeframe or the instrument you are trading. The account balance or the fact you are not used to seeing 3-4 losses in a row.
When it comes to trading, less really is more!
Here's a simple one for you.
Take the mechanical range post I posted.
Now look at this;
On the larger timeframes we can see clearly the ranges and the supply/demand.
Then dropping down to the daily.
This is where, the technical aspect becomes less important and the psychology behind the move shows it's hand.
I have added volume and the AD line just to show how obvious this can be.
What do you see? Well as the price goes up, the volume goes down, we know we took liquidity to the upside.
So, if nothing else you would anticipate a pullback phase.
Then you get the clarity. Price drops and then pushes back, yet fails to make a new high. Almost like the volume told you it was about to happen.
Where did it pull back to?
Adding a simple volume profile too, from the swing high to the swing low. You can see the majority of the sell off (PoC) happened at a specific price point. Price pulled back to exactly that region before dropping.
The drop caused a local change in character and immediately took out the swing low - the last swing low of the leg up. (the real change in the trend).
There is obviously more to cover than this, but that is for another post.
Once you learn the way markets capitalise on the fear, the greed, the herd mindset, sentiment of the retail crowd. You can use the sentiment analysis in your favour.
You don't need 6 screens, fancy indicators, there is no silver bullet or 100% win rate strategies. And no a bot won't make you a Billionaire overnight.
If it was that easy, we would have no doctors, lawyers or firefighters; they would all be professional Bot traders.
Simplify your approach, put emphasis on the proper mindset, psychology and risk management and you will do alright!
Stay safe in the markets!
Some other recent posts;
Disclaimer
This idea does not constitute as financial advice. It is for educational purposes only, our principal trader has over 25 years' experience in stocks, ETF's, and Forex. Hence each trade setup might have different hold times, entry or exit conditions, and will vary from the post/idea shared here. You can use the information from this post to make your own trading plan for the instrument discussed. Trading carries a risk; a high percentage of retail traders lose money. Please keep this in mind when entering any trade. Stay safe.

US500 Bearish Idea: Waiting for Structure Break ConfirmationWatching the SPX US500 right now 📈 — it’s rallied hard with strong momentum and is pushing into a key resistance level ⚠️. Since price is overextended, I’m expecting a pullback towards equilibrium on the current move 🔄. My bias is bearish from this level 🔻, with entry dependent on a break in structure on the 30-min timeframe ⏳.
All is explained in the video 🎥 (not financial advice).

Okay, Let's Take a Live Look Into the Market 📺⚡ Okay, Let's Take a Live Look Into the Market 💹🔥
Important levels across S&P 500, Bitcoin, and XRP are all flashing 🔴 right now. Here's what I'm seeing in real-time:
📈 S&P 500 Futures – 6,351 Is Everything
The 6,351 level marks the midpoint of the rising channel.
On Friday, I flagged 6,430 as critical resistance — price rejected perfectly.
Now we’re attempting a rebound, but we’re stuck at mid-channel.
⚠️ A confirmed breakout above 6,351 could reignite upside momentum.
👉 Yes, this is a 1-minute chart, but precision matters when watching key structural levels — especially in legacy indices.
💥 BTC – 115,700: The Grandmaster Level
Zoom out and see the massive yellow horizontal on the chart: 115,700.
It’s not just any number — this is the ultimate resistance-turned-support battleground.
We’re currently under it, which keeps pressure to the downside.
A reclaim flips the structure bullish and opens room for trend continuation.
📌 Until we’re above it, this remains the dominant resistance across the entire crypto macro framework.
🧩 XRP – Still Facing Rejection
On the 2H/3H chart, XRP continues to flirt with resistance but fails to confirm strength.
This aligns with both the S&P 500 stalling at 6,351 and Bitcoin being capped at 115.7K.
📉 When multiple assets respect key levels in sync, it signals market-wide hesitation.
🔄 Cross-Market Confluence
It’s fascinating to watch:
A TradFi index (S&P)
A macro crypto asset (BTC)
A mid-tier alt (XRP)
...all pivoting around hyper-precise structural resistance at the same time.
✅ These aren’t coincidences. They’re systemic correlations.
🔮 What’s Next?
If S&P 500 breaks above 6,351, it could act as a risk-on signal.
That momentum could help BTC flip 115,700 — a massive deal.
And if that happens, XRP could finally follow with a stronger move.
Until then? We respect resistance and wait for confirmation. 📊🔍
One Love,
The FXPROFESSOR 💙
Disclosure: I am happy to be part of the Trade Nation's Influencer program and receive a monthly fee for using their TradingView charts in my analysis. Awesome broker, where the trader really comes first! 🌟🤝📈

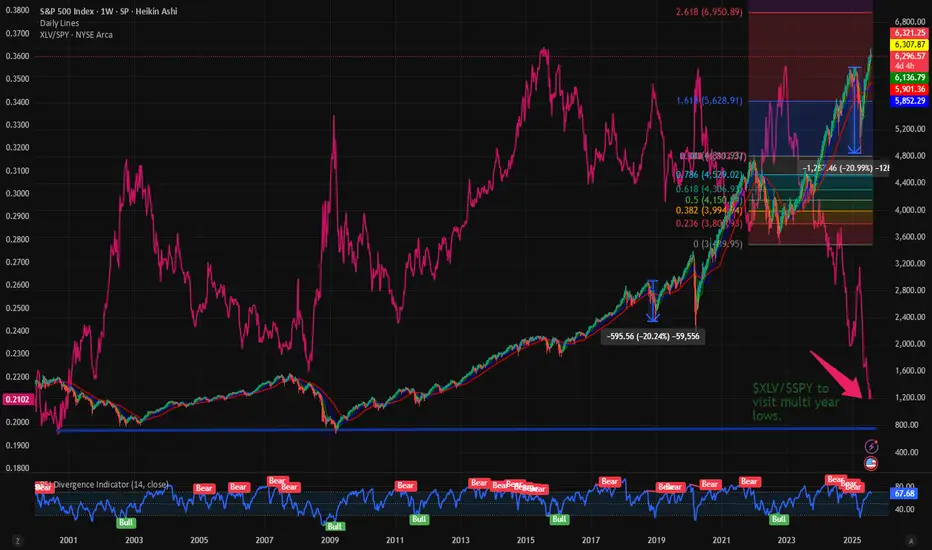
$XLV vs $SPY at multi year low. Is more downside expected? In this space we talk a lot about the market outperformance and how this has resulted in indexes at ATH. The SP:SPX and NASDAQ:NDX and their corresponding ETFs: NASDAQ:QQQ and AMEX:SPY have also made ATHs. But if peel under the surface we can observe that very few sectors have consistently outperformed the S&P 500. The Technology sector represented by AMEX:XLK has consistently outperformed the $SPY. The $XLK/ AMEX:SPY is in a upward channel depicted by the purple line. The SPDR select sector Technology sector has consistently increased its weightage on AMEX:SPY and the ratio $XLK/ AMEX:SPY is currently at 0.41 which is an ATH.
But the same cannot be told about the SPDR Healthcare Sector. The ratio between $XLV/ AMEX:SPY is making multi year low. With the ratio currently at 0.21 it is approaching its multi-year lows of 0.1975. The ratio was so low last in Sept 2000. Hence the question comes what should we expect the AMEX:XLV which is making new lows against the AMEX:SPY ? Will we visit the lows of 0.1975? If it happens then can we expect a upward momentum from his double bottom situation?
In my estimate in this bull market and Tech sector outperforming the AMEX:XLV will make new lows vs AMEX:SPY and the ratio will revisit the 2000 lows. But if on the macro front we have weak jobs numbers and recession risk rising then the AMEX:XLV can in fact draw inflows and outperform the index. Hence my estimate $XLV/ AMEX:SPY will sweep the multi-year low and then bounce back into 2026.
Verdict: Still more downside possible in $XLK/$SPY. Go long AMEX:XLV when the ratio is @ 0.1975 and into 2026.
Rob the Rally SPX500: Enter Before Resistance Catches You🦹♂️💎 “SPX500 Vault Breach – Layered Robbery in Progress!” 💼📈
(Thief Trader's Multi-Limit Entry Bullish Blueprint – No Mercy, Just Money)
📍Asset: SPX500 / US500
🎯Plan: Bullish Heist
🧠Style: Layered Limit Orders | Thief Strategy Entry | Zero Mercy Execution
📈Target: 6600.00
🛑Stop Loss: 6200.00
💣Entry: Any level — thieves adapt, not wait!
🌍 Welcome to the Global Robbery Room, Traders!
It’s your boy Thief Trader, back in the vault with another plan to crack the SPX500 like a safe on Wall Street. This one’s for the bold bulls who like to rob with precision, not permission. 🎯💰
💼 The Setup – High Stakes, High Floors
SPX500 is lining up for a classic breakout breach. This isn’t just technical — it’s tactical warfare. Market noise? Ignore it. We operate on strategy and steel nerves. 🧠🔫
🔥 Entry Protocol – Layer Up or Miss Out
🧱 Multiple limit orders across price zones — like planting C4 charges on every door.
🎯 Enter wherever price dips — don’t wait for permission from retail traders.
🎯 No fixed entry — this is Thief Layering: get in where you fit in.
🚪 Escape Plan – Stop Loss Strategy
📍 SL: 6200.00
Why? That’s where the guards start showing up. If price drops below, we vanish.
💡 Be flexible — smart robbers don’t get caught, they regroup.
💎 Target Loot – The Golden Zone
📍 Primary TP: 6600.00
Once we breach the 6500+ resistance, it's a moonwalk. Lock gains or trail with confidence.
📢 Warning for Scalpers & Swing Thieves Alike:
Only play Long-side. Don’t try to rob both ends — that’s suicide.
Big wallet? Scale heavy. Small bag? Layer light but tight.
Always use trailing stops — never trust the market with your escape bag. 🎒💸
📊 Thief Intel – Why We’re Bullish
✅ Index rotation favors large-cap strength
✅ Macro sentiment + institutional bias points UP
✅ No bearish COT signals in sight
✅ Fed tone & economic backdrop: neutral to supportive
This isn’t hopium. It’s strategy.
🚨 NEWS FLASH – Stay Stealthy!
Do NOT enter during economic bombs 💣 (NFP, CPI, Fed minutes, etc.)
Market noise kills precision. We only move in silence and with SLs trailing tight.
💬 Smash that BOOST 💖 if you’re riding with the Thief Army.
Share this plan, spread the word, and let’s rob the markets the smart way.
📢 Tag your crew, stack your layers, and let’s hit 6600 like pros.
📌Disclaimer: Not financial advice — this is a market operation plan for educational use. Trade at your own risk. Smart thieves plan exits before entries. 💼📉📈
🦹♂️ Thief Trader out.
💸 Rob smart. Rob clean. Rob global.

SPX500 Dips Ahead of NFP as Tariff Risks RiseSPX: S&P 500 Dips to Close July — Still Positive for the Month Amid Tariff Tensions & Fed Uncertainty
The S&P 500 retreated in the final session of July, weighed down by renewed tariff concerns and lingering uncertainty around the Fed’s next move. Despite the late pullback, the index remains positive for the month overall.
Looking ahead, non-farm payrolls (NFP) and U.S. jobs data are expected to have a strong impact on market direction. In addition, August 1st marks a key date for potential tariff developments, which could trigger further volatility.
Technical Outlook – SPX500
The index has dropped approximately 2.5% since yesterday and maintains a bearish bias as long as it trades below 6283. If the price continues to slide, the next downside target is 6246, with further support at 6223.
However, if the price manages to close above 6289 on the 1H timeframe, it could trigger a bullish recovery toward 6320 and 6341.
Pivot Line: 6283
Support Levels: 6246 • 6223
Resistance Levels: 6320 • 6341

S&P 500: Bearish For The Short Term! Sell It!Welcome back to the Weekly Forex Forecast for the week of July 28 - Aug 1st.
In this video, we will analyze the following FX market for the week of Aug 4-8th:
S&P 500 (ES1!)
The S&P 500 rose Friday to fresh highs, following a busy week of tariff updates and earnings. The S&P ended the week with its fifth straight record close, its longest such streak in over a year.
No reason to consider selling. Wait for pullbacks to FVGs for high probability buys.
FOMC and NFP loom. Be careful to avoid new entries during news times.
Enjoy!
May profits be upon you.
Leave any questions or comments in the comment section.
I appreciate any feedback from my viewers!
Like and/or subscribe if you want more accurate analysis.
Thank you so much!
Disclaimer:
I do not provide personal investment advice and I am not a qualified licensed investment advisor.
All information found here, including any ideas, opinions, views, predictions, forecasts, commentaries, suggestions, expressed or implied herein, are for informational, entertainment or educational purposes only and should not be construed as personal investment advice. While the information provided is believed to be accurate, it may include errors or inaccuracies.
I will not and cannot be held liable for any actions you take as a result of anything you read here.
Conduct your own due diligence, or consult a licensed financial advisor or broker before making any and all investment decisions. Any investments, trades, speculations, or decisions made on the basis of any information found on this channel, expressed or implied herein, are committed at your own risk, financial or otherwise.

ES | SP500 - Weekly Recap & Gameplan - 03/08/25📈 Market Context:
Traders are currently anticipating a possible 0.25% rate cut during the upcoming September FOMC meeting, which continues to support the broader bullish framework.
Although the market pulled back after the Non-Farm Employment Change data came in below expectations, overall optimism remains.
Sentiment has now cooled off from last week's greed and shifted to a more neutral stance. Historically, August tends to bring some chop and pullbacks, but the structural bias still leans bullish.
🧾 Weekly Recap:
• ES kicked off the week with strong upward momentum, climbing steadily into Thursday.
• Along the way, price swept a key 4H swing high, breaking into new highs before initiating a retracement.
• This price action hinted at a short-term distribution and possible liquidity grab ahead of a correction.
📌 Technical Outlook & Game Plan:
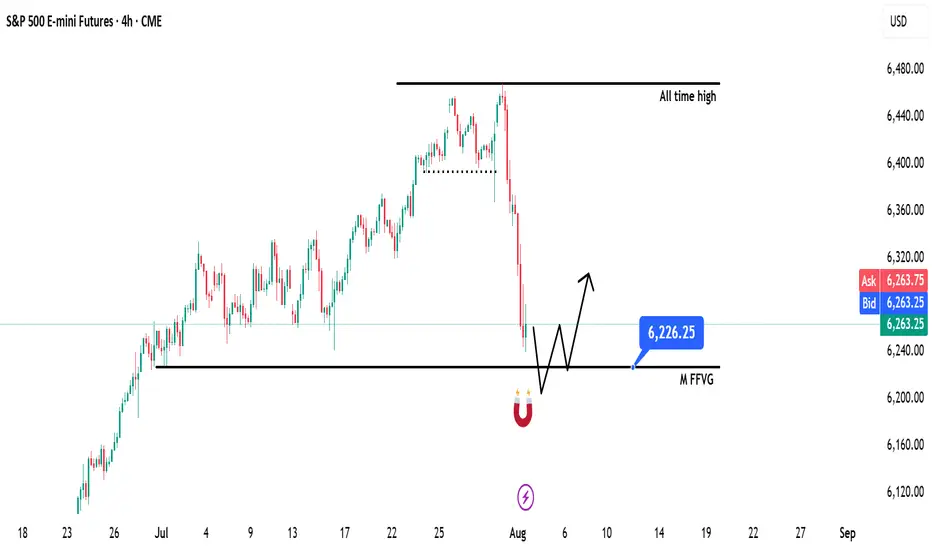
→ I'm anticipating a move into the Monthly Fair Value Gap — a high-probability liquidity zone on my radar.
→ That area could act as a springboard for bullish continuation or at least provide a strong reaction.
→ Until that happens, I remain short-biased targeting the 6226$ zone, which I've marked as a major level.
🎯 Setup Trigger:
Once price taps 6226$, I'll monitor for:
• Clear break of structure on the 4H and 1H timeframes
• Formation of new demand zones indicating potential reversal
→ On confirmation from the lower timeframes, I’ll shift my focus toward long setups, potentially targeting new highs.
📋 Trade Management:
• Stoploss: Below the demand zone formed on 1H–4H
• Target: I’ll trail my stop to lock in profits as price moves higher
• Note: Although I’ll be watching for ATH retests, I plan to manage risk actively and book profits along the way
💬 Like, follow, and comment if this breakdown supports your trading! I’ll be sharing more detailed setups and educational posts — stay connected!
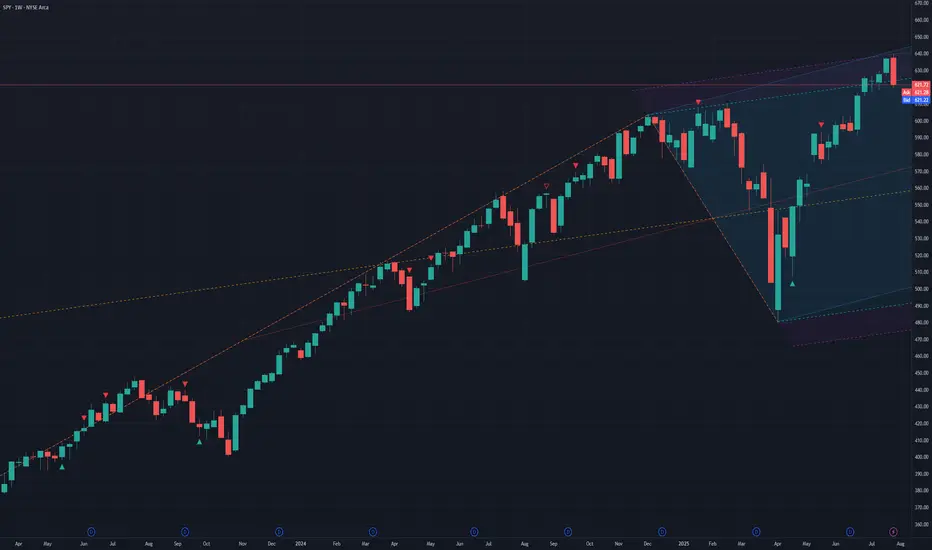
SPY to continue fallingSPY reached a top (resistance) fork line and started to fall. Based on this I entered long on VIX on July 28, when VIX was at its lowest point. I expect this fall of the market to continue.
S&P500 corrective pullback key support at 6200Key Support and Resistance Levels
Resistance Level 1: 6316
Resistance Level 2: 6374
Resistance Level 3: 6430
Support Level 1: 6200
Support Level 2: 6112
Support Level 3: 6073
This communication is for informational purposes only and should not be viewed as any form of recommendation as to a particular course of action or as investment advice. It is not intended as an offer or solicitation for the purchase or sale of any financial instrument or as an official confirmation of any transaction. Opinions, estimates and assumptions expressed herein are made as of the date of this communication and are subject to change without notice. This communication has been prepared based upon information, including market prices, data and other information, believed to be reliable; however, Trade Nation does not warrant its completeness or accuracy. All market prices and market data contained in or attached to this communication are indicative and subject to change without notice.

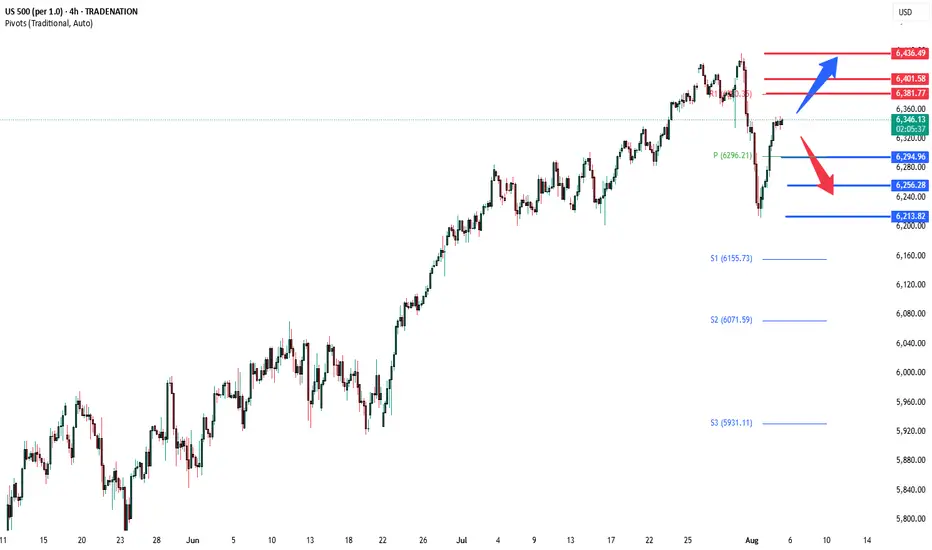
S&P 500 Daily Chart Analysis For Week of August 1, 2025Technical Analysis and Outlook:
During the trading activity of the previous week, the S&P 500 Index displayed a predominantly bearish movement after completing our Outer Index Rally target of 6420, as highlighted in the prior week’s Daily Chart Analysis, with the primary objective now being to plug our Mean Support at 6200.
It is essential to recognize that the current price movement may trigger a significant further pullback to the Mean Support level of 6090. Following this downturn, it is expected that the index will resume its upward momentum, aiming for a retest of the Outer Index Rally peak at 6420.
