Is minor B done?In my last post…” We Have a Full Pattern into The Target Box” … I stated, “I am now looking for a 5-wave pattern to develop to the downside, followed by a 3-wave retrace, that in the coming weeks can take us back out of the target box to the downside.”
That pattern may have begun today in the very micro sense. This is very preliminary, so we need follow through to the downside so that in the days and weeks to come, we can confirm a top in minor B.
S&P 500 (SPX500)

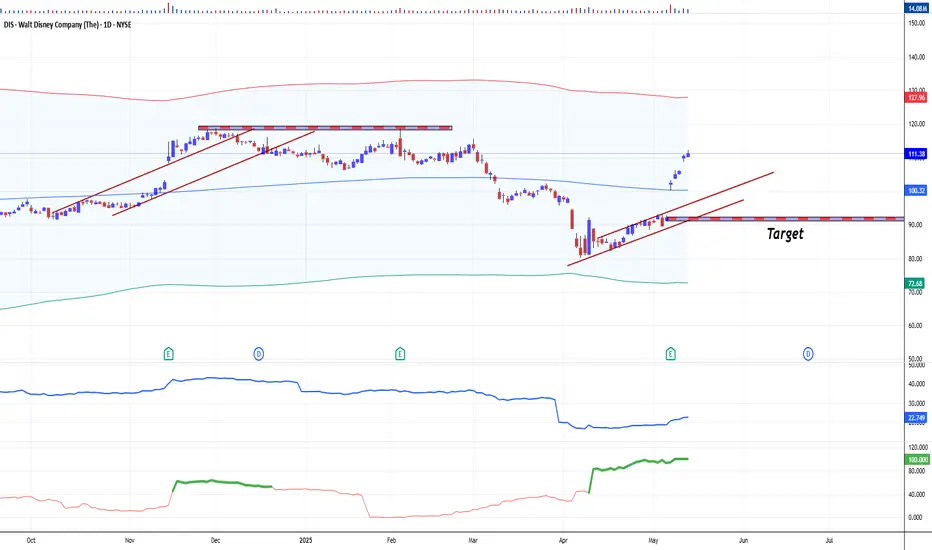
The Walt Disney Stock Future Goes 'Shining Bright as Never'The Walt Disney Company’s stock (DIS) has demonstrated robust performance following its Q2 2025 earnings release a week ago, with both fundamental and technical indicators reflecting positive momentum.
Here’s a detailed analysis:
Fundamental Perspective
Disney’s Q2 2025 results exceeded expectations, driven by strong execution across its entertainment, streaming, and experiences segments. Key financial highlights include:
Revenue Growth. Revenues rose 7% year-over-year (YoY) to $23.6 billion, surpassing estimates of $23.14 billion.
Profitability Surge. Adjusted EPS jumped 20% YoY to $1.45, beating forecasts of $1.20. Net income swung to $3.3 billion from a $20 million loss in Q2 2024.
Streaming Strength. Disney+ added 1.4 million subscribers (reaching 126 million globally), defying expectations of a decline. Combined Disney+ and Hulu streaming operations generated $336 million in profit, a sevenfold increase from $47 million YoY.
Guidance Upgrade. Disney raised its fiscal 2025 adjusted EPS forecast to $5.75 (up 16% YoY), citing confidence in double-digit operating income growth for entertainment and sports, and 6%-8% growth for experiences.
Growth Drivers:
Entertainment. Segment operating income rose $0.5 billion YoY to $1.3 billion, fueled by streaming profitability and box office success (e.g., Moana 2).
Experiences. Theme parks and consumer products saw higher attendance, guest spending, and cruise demand, though international parks faced headwinds in Shanghai and Hong Kong.
Strategic Initiatives. The upcoming Abu Dhabi theme park and ESPN’s direct-to-consumer launch are expected to drive long-term growth.
Technical Perspective
Disney’s stock firstly reacted positive to the earnings beat, reflecting renewed investor confidence:
Price Action. Shares surged 10-12% post-earnings, hitting an intraday high of $103.31. Over the past month, DIS gained 31%, including a 20% rally in five days.
Valuation. The stock trades at 18.4x forward earnings and 2.1x sales, a premium to industry averages but below its historical norms.
Analyst Sentiment. The average price target stands at $126.50 (14% upside), with a Street-high target of $148 (33% upside).
Technical Indicators:
Momentum. The breakout above key resistance levels (e.g., $100) signals bullish sentiment, supported by high trading volume.
Volatility. Beta of 1.01 aligns with market volatility, while short interest remains low at 1.24% of float.
Risks and Considerations
Macroeconomic Uncertainty. Disney acknowledged potential impacts from tariffs and global economic conditions.
Valuation Premium. While growth prospects justify some premium, prolonged macroeconomic stress could pressure multiples.
Investors challenge
Disney’s Q2 2025 results underscore its ability to execute on streaming monetization, theme park innovation, and content-driven growth.
Fundamentally, raised guidance and streaming profitability signal a turnaround, while technically, the stock’s breakout suggests locally bullish momentum.
Following historical patterns we are Bearishly tuned at this time, with targets to fill the gap at $92.17 per share (left after Earnings report), and drilling all the way below.
--
Best wishes,
@PandorraResearch Team
SPY/QQQ Plan Your Trade For 5-21 : Inside-BreakawayI've been very clear over the past few weeks that I believe the markets are poised for a rollover/topping pattern and I believe BTCUSD is showing us exactly how/when that rollover top is going to play out (June 1-June 9).
In the meantime, I believe the SPY/QQQ are entering a more volatile "early topping" formation while still in an uptrend (Bullish).
I urge traders to start watching various sectors for weakness and keeping your eyes open for any signs the market could be moving into a sideways price rotation.
I think the rollover top will be aligned with some financial event (trade/tariff/other) that will result in a broad disruption of the US/Global markets. And I believe BTCUSD will lead the move by about 4-7+ days.
Gold and Silver are starting to move higher again. That is a sure sign that traders are now more actively seeking to hedge global risks (again).
I believe this move higher in metals may continue through this week and into next week (looking for that top in the SPY/QQQ).
Follow my detailed BTCUSD video to learn why BTCUSD may continue to try to push a bit higher before topping and moving into a broad price decline.
Get some..
#trading #research #investing #tradingalgos #tradingsignals #cycles #fibonacci #elliotwave #modelingsystems #stocks #bitcoin #btcusd #cryptos #spy #gold #nq #investing #trading #spytrading #spymarket #tradingmarket #stockmarket #silver

05/20/25 Trade Journal, and Where is the Stock Market going tomoEOD accountability report: +293.75
Sleep: 4.5 hours , Overall health: Calm and tired. need to catch up on sleep.
What was my initial plan?
Market structure was bearish so, I started the day shorting, but once market flipped bullish, I switched to BTD mode.
Daily Trade recap based on VX Algo System
— 9:00 AM Market Structure flipped bearish on VX Algo X3!
— 10:20 AM VXAlgo NQ X1 Buy Signal
— 11:18 AM Market Structure flipped bullish on VX Algo X3!
— 12:30 PM Market Structure flipped bearish on VX Algo X3!
— 1:20 PM VXAlgo NQ X1 Sell Signal
— 3:13 PM VXAlgo ES X1 Buy signal 2x signal (C+ set up)
Next day plan--> Above 5900 = Bullish, if we lose 48min support at 5900--> 5800 next
Video Recaps -->https://www.tradingview.com/u/WallSt007/#published-charts

5-20-25 WARNING : Bitcoin Sets Up MASSIVE Double-Top WarningI highlighted this incredible price/technical pattern in my morning Plan Your Trade video. But, I thought it was important enough to create a separate video highlighting this incredible Double-Top warning and to try to tell all of my followers to start actively protecting capital over the next 2-3+ weeks.
As much as I would like to say this won't happen (meaning some type of crisis event or global financial crisis) causing a collapse in Bitcoin (and the US/Global markets) - but I believe the continued constraints on the global markets, related to Trump's policies and attempts to reduce US govt spending) will act as a devaluation event for global economies.
Think about it for a minute...
1. If the US is able to remove $500-900 Billion in fraud/waste/NGO spending (of which, a portion of that spending is dedicated to supporting global initiatives/spending), this will result in a contraction (in some form) for some global economies.
2. If the US is able to negotiate more favorable tariff rates for US goods supplied to the world (where foreign nations reduce or eliminate tariffs on US goods), this will also act as a reduction in economic income for many foreign nations.
3. These combined and continued efforts to restructure the US economy into a strong and more dynamic global economic driver (more fairly balanced in terms of global trade) will come at the expense of breaking away from what has traditionally been untouched.
This breaking of the past, in terms of what nations expected related to US spending and tariffs on US Goods, may represent a 15-25% (or more) contraction in foreign economic activity.
If this disruption from "what was normal" results in the US Fed, or global central banks, taking emergency measures to address short-falls in their economies, this could prompt a series of events that could result in a broad devaluation type of event (very similar to what happened after COVID in 2022-2023).
That event was prompted by the US Fed raising rates trying to stop inflation. This event could be the result of slower/lower economic outputs/expectations related to the changing tariff rates and the reduction in US spending throughout the world. Central Banks and regional governments may attempt to provide some type of capital stimulus to transition through this phase - but I see that as "building a bigger bubble - just waiting to pop".
The smart move for global central banks is to follow the US's lead and start to move towards more austerity/accountability regarding their own economies/spending and attempt to let the devaluation price phase play out.
Either way, time will tell if I'm correct or not.
You have been warned. IMO, you have about 3-6 weeks before BTCUSD potentially tops and may roll into a very strong breakdown phase.
Get Some.
#trading #research #investing #tradingalgos #tradingsignals #cycles #fibonacci #elliotwave #modelingsystems #stocks #bitcoin #btcusd #cryptos #spy #gold #nq #investing #trading #spytrading #spymarket #tradingmarket #stockmarket #silver

SPY/QQQ Plan Your Trade For 5-20 : Harami-InsideToday's pattern suggests the SPY/QQQ will stay somewhat FLAT in trading.
In this video, I go over the SPY/QQQ, Gold/Silver, and BTCUSD.
What I find interesting in today's video is the setup in BTCUSD - being very similar to the peak in late 2021 before the double-top in Bitcoin.
If my analysis is correct, we are moving into a type of final speculative phase (bullish) that will quickly transition into a type of breakdown move in the US/Global markets.
Gold should do very well once this move sets up and begins to drive the Risk/Hedge trade.
In the meantime, sit back and wait for this speculative move to phase out (top).
Get some.
#trading #research #investing #tradingalgos #tradingsignals #cycles #fibonacci #elliotwave #modelingsystems #stocks #bitcoin #btcusd #cryptos #spy #gold #nq #investing #trading #spytrading #spymarket #tradingmarket #stockmarket #silver

The Bullish view under ELLIOT WAVE top of 3 6181/6235Based On what has been happening in the structure in The SP 500 I tend to think the sp cash sees a retest at 6417 or extend the rally to 6181 alt 6230 for the top of #wave 3 or Wave B . both should see a 350 point decline back to 5830/ If 5 is equal to One a 646 point rally should be seen in wave 5

PZZA'S Divers on the weekly chart still on going @ 22 weeks !Since the IPO we have had many weekly divers as such on the chart, as of
this week we stand at 22 weeks Our MAX weekly divers was 56 Zoon in
and go back to see data on the chart !!

Where is the Stock Market going tomorrow? Trade Journal 05/19/25EOD accountability report: +500
Sleep: 3.5 hours , Overall health: tired
What was my initial plan?
Short if market went under 5920, long with X7 buy signals, and short at 5968 area, and long if we retrace to 5925s
overall market went accordingly to Bullish structure and x7 buy signal. that's the whole reason of the system, to let you know what the market is and all you need to do is follow accordingly instead of fighting it.
Daily Trade recap based on VX Algo System
— 7:00 AM Market Structure flipped bullish on VX Algo X3!
— 9:36 AM VXAlgo X7 Buy Signal, ticker = NQ1!, price = 21281.25
— 2:00 PM VXAlgo ES X3 Sell Signal
— 2:35 PM Market Structure flipped bearish on VX Algo X3!
Next day plan--> Above 5920/5900 = Bullish, if we lose 48min support at 5928 --> 5875 next
Video Recaps -->https://www.tradingview.com/u/WallSt007/#published-charts

S&P 500 | Blue Box as Margin of SafetyWhen the index returns to the blue box, it reaches a zone forged by genuine buying interest and technical alignment. In a disciplined, data‑driven approach, this area serves as our first line of defense.
Why It Matters
• Past reactions show price pauses and reversals here, revealing real demand.
• It coincides with key footprint volume clusters where buyers have stepped in.
Entry Criteria
Higher‑Time‑Frame Stability
Confirm price holds within or above the blue box before considering a position.
Lower‑Time‑Frame Confirmation
Wait for clear breakouts or higher‑lows on short‑term charts backed by rising footprint volume.
Strict Risk Control
If price breaks through without retest or volume support, stand aside and seek a clearer setup.
By treating the blue box as our margin of safety and relying on actual volume footprint data, we trade with prudence and let the market’s real signals guide our decisions.
📌I keep my charts clean and simple because I believe clarity leads to better decisions.
📌My approach is built on years of experience and a solid track record. I don’t claim to know it all but I’m confident in my ability to spot high-probability setups.
📌If you would like to learn how to use the heatmap, cumulative volume delta and volume footprint techniques that I use below to determine very accurate demand regions, you can send me a private message. I help anyone who wants it completely free of charge.
🔑I have a long list of my proven technique below:
🎯 ZENUSDT.P: Patience & Profitability | %230 Reaction from the Sniper Entry
🐶 DOGEUSDT.P: Next Move
🎨 RENDERUSDT.P: Opportunity of the Month
💎 ETHUSDT.P: Where to Retrace
🟢 BNBUSDT.P: Potential Surge
📊 BTC Dominance: Reaction Zone
🌊 WAVESUSDT.P: Demand Zone Potential
🟣 UNIUSDT.P: Long-Term Trade
🔵 XRPUSDT.P: Entry Zones
🔗 LINKUSDT.P: Follow The River
📈 BTCUSDT.P: Two Key Demand Zones
🟩 POLUSDT: Bullish Momentum
🌟 PENDLEUSDT.P: Where Opportunity Meets Precision
🔥 BTCUSDT.P: Liquidation of Highly Leveraged Longs
🌊 SOLUSDT.P: SOL's Dip - Your Opportunity
🐸 1000PEPEUSDT.P: Prime Bounce Zone Unlocked
🚀 ETHUSDT.P: Set to Explode - Don't Miss This Game Changer
🤖 IQUSDT: Smart Plan
⚡️ PONDUSDT: A Trade Not Taken Is Better Than a Losing One
💼 STMXUSDT: 2 Buying Areas
🐢 TURBOUSDT: Buy Zones and Buyer Presence
🌍 ICPUSDT.P: Massive Upside Potential | Check the Trade Update For Seeing Results
🟠 IDEXUSDT: Spot Buy Area | %26 Profit if You Trade with MSB
📌 USUALUSDT: Buyers Are Active + %70 Profit in Total
🌟 FORTHUSDT: Sniper Entry +%26 Reaction
🐳 QKCUSDT: Sniper Entry +%57 Reaction
📊 BTC.D: Retest of Key Area Highly Likely
📊 XNOUSDT %80 Reaction with a Simple Blue Box!
📊 BELUSDT Amazing %120 Reaction!
📊 Simple Red Box, Extraordinary Results
I stopped adding to the list because it's kinda tiring to add 5-10 charts in every move but you can check my profile and see that it goes on..

SPY/QQQ Plan Your Trade For 5-19 : Gap Breakaway In Trend ModeToday's pattern suggests the SPY/QQQ will start with an opening price GAP (downward in this case) and could continue to move into a Breakaway pattern.
Given the recent news of a US Credit Downgrade, I'm suggesting all traders prepare for what may become a period of sideways price volatility over the next 3-5+ days.
I've highlighted a potential breakdown range on the SPY/QQQ on my charts that I believe acts as a solid confirmation level related to any potential reversal/breakdown in trend.
Currently, the trend is still BULLISH. If price falls below my breakdown range (the angled rectangle on my charts) - then I believe price will have broken this upward FLAGGING trend channel and will begin to move downward - targeting lower support levels.
This is a critical time for the markets. If we fail to move higher at these levels, we have a long way to go (downward) before we attempt to find any support.
Gold and Silver appear to be attempting to break the FLAG HIGH of an Inverted Excess Phase Peak pattern. This could prompt a strong rally phase back above $3300/$33 for Gold/Silver over the next few days. Time will tell how things play out.
BTCUSD appears to be REJECTING the recent highs within a consolidation range. If this rejection continues, I see BTCUSD moving downward - trying to reach the $95k (or lower) looking for support.
Remember, we are still generally BULLISH and moving upward within the FLAGGING channel. If we do get a breakdown in price over the next few days, it will become clearly evident on the charts and we'll have to begin to change our expectations.
Right now - HEDGE.
Get Some...
#trading #research #investing #tradingalgos #tradingsignals #cycles #fibonacci #elliotwave #modelingsystems #stocks #bitcoin #btcusd #cryptos #spy #gold #nq #investing #trading #spytrading #spymarket #tradingmarket #stockmarket #silver

S&P 500 Falls Following Downgrade of US Credit RatingS&P 500 Falls Following Downgrade of US Credit Rating
On Friday, 16 May, after markets had closed, Moody’s Ratings announced a downgrade of the long-term sovereign credit rating of the United States from the highest level of Aaa to Aa1. The key reasons cited by Moody’s were the rising national debt and interest payments, as well as expectations of a further increase in the budget deficit. Notably:
→ The downgrade was hardly a surprise. A similar move was made by Standard & Poor’s back in 2011, while Fitch Ratings followed suit in August 2023.
→ The official response may be seen as reassuring for market participants. US Treasury Secretary Scott Bessent played down concerns about the downgrade in an interview with NBC News, calling credit ratings “lagging indicators” and placing the blame on the previous administration.
→ Despite the downgrade, Moody’s acknowledged the US dollar’s role as the world’s reserve currency and stated that the United States “retains exceptional credit strengths, such as the size, resilience, and dynamism of its economy.”
Stock Market Reaction
The announcement triggered a negative market reaction, reflected in falling prices during Monday morning’s opening session. E-mini S&P 500 futures (US SPX 500 mini on FXOpen) retreated, as indicated by the arrow on the chart, pulling back from the highs reached by Friday’s close.
Last week, we pointed out signs of slowing momentum in the S&P 500 rally. Could the decline continue further?
Technical Analysis of the S&P 500 Chart
By drawing lines A, B, and C through the May rally peaks, we can observe a gradual flattening of the slope — suggesting that the bulls are losing momentum and confidence.
The price is currently trading between local lines C and C1, but it is reasonable to assume that the opening of the US session may bring renewed bearish pressure — potentially pushing the price lower, towards the bottom boundary of the broader upward channel (marked in blue).
This article represents the opinion of the Companies operating under the FXOpen brand only. It is not to be construed as an offer, solicitation, or recommendation with respect to products and services provided by the Companies operating under the FXOpen brand, nor is it to be considered financial advice.

ES1! (S&P500 Mini Futures) - Support Trendline Price Test -DailyES1! (S&P500 Mini Futures) price is currently testing a support trendline around $5900.
If several daily Price candles close below $5865 this month, a pullback in the price can occur (rising wedge pattern).
Volume has been decreasing in May 2025, compared to March and April.
Finance and Technology corporate earnings season has passed. The U.S. government 90-day tariff pause is set to expire in early July (pending trade deal negotiations with other countries).
Tariff and trade deal news, breaking news, corporate earnings, government law changes, consumer sentiment, inflation data, the FOMC, and presidential announcements can all affect the prices of stocks and ETFs.

S&P500 2022 into the Bear Market. Same Pattern 2025In 2022, before the bear market began, we saw the same pattern that we're seeing now:
1. Sine wave pattern
2. Fake recovery
3. Break above the sine wave top
4. Sharp decline
Last week, right after the sine wave top was broken, U.S. bonds were downgraded AFTER OFFICIAL MARKET SESSION!
It’s no surprise that rating agencies are losing confidence in the U.S. government's ability to repay its debts.
Just look at the rising interest payments — if that’s not a wake-up call, I don’t know what is. 😕
I don’t live in the U.S., but I’m genuinely concerned that a collapse — which now seems nearly inevitable — will impact the entire world.
Going long in U.S. markets under these technical and fundamental conditions? Putting all your eggs back into that basket? Really?
I hope this gives some perspective.
Trade safely, trade small, and keep your risks minimal.

SPX500 H4 | Falling toward a pullback supportSPX500 is falling towards a pullback support and could potentially bounce off this level to climb higher.
Buy entry is at 5,789.71 which is a pullback support.
Stop loss is at 5,630.00 which is a level that lies underneath an overlap support and the 23.6% Fibonacci retracement.
Take profit is at 5,994.08 which is a multi-swing-high resistance.
High Risk Investment Warning
Trading Forex/CFDs on margin carries a high level of risk and may not be suitable for all investors. Leverage can work against you.
Stratos Markets Limited (tradu.com/uk):
CFDs are complex instruments and come with a high risk of losing money rapidly due to leverage. 63% of retail investor accounts lose money when trading CFDs with this provider. You should consider whether you understand how CFDs work and whether you can afford to take the high risk of losing your money.
Stratos Europe Ltd (tradu.com/eu):
CFDs are complex instruments and come with a high risk of losing money rapidly due to leverage. 63% of retail investor accounts lose money when trading CFDs with this provider. You should consider whether you understand how CFDs work and whether you can afford to take the high risk of losing your money.
Stratos Global LLC (tradu.com/en):
Losses can exceed deposits.
Please be advised that the information presented on TradingView is provided to Tradu (‘Company’, ‘we’) by a third-party provider (‘TFA Global Pte Ltd’). Please be reminded that you are solely responsible for the trading decisions on your account. There is a very high degree of risk involved in trading. Any information and/or content is intended entirely for research, educational and informational purposes only and does not constitute investment or consultation advice or investment strategy. The information is not tailored to the investment needs of any specific person and therefore does not involve a consideration of any of the investment objectives, financial situation or needs of any viewer that may receive it. Kindly also note that past performance is not a reliable indicator of future results. Actual results may differ materially from those anticipated in forward-looking or past performance statements. We assume no liability as to the accuracy or completeness of any of the information and/or content provided herein and the Company cannot be held responsible for any omission, mistake nor for any loss or damage including without limitation to any loss of profit which may arise from reliance on any information supplied by TFA Global Pte Ltd.
The speaker(s) is neither an employee, agent nor representative of Tradu and is therefore acting independently. The opinions given are their own, constitute general market commentary, and do not constitute the opinion or advice of Tradu or any form of personal or investment advice. Tradu neither endorses nor guarantees offerings of third-party speakers, nor is Tradu responsible for the content, veracity or opinions of third-party speakers, presenters or participants.

Liquidity sweep. I see a nice opportunity for a buy after tapping into a liquidity pool . If SL is hit then I will start looking for sells.

SPY WEEKLY 19TH-23RD MAY 2025Welcome to Spy weekly. I have tried to explain the price action & all-important levels in the best possible way but still if you have doubts then feel free to leave a comment below.
NOTE: WE ARE IN BULL RUN

SPX headed for a correctionMoody's has downgraded US Debt. This news is a catalyst for a overdue correction (Or reversal?)
I published this script some days back. It can predict price inflection points very well
Based on the past behaviour, I can say we are heading for a correction technically and the fill the gap of last week

S&P 500 Daily Chart Analysis For Week of May 16, 2025Technical Analysis and Outlook:
The S&P 500 Index showed a steady upward trend during this week's trading session, successfully reaching a key target at the Outer Index Rally level of 5955. However, it's important to note the significant downward trend due to letter completion, which could lead to a decline toward the Mean Support level of 5828. Additionally, there is a possibility of further drops to the Mean Support level of 5661. On the other hand, the index may continue to rise from its current level, potentially advancing toward the Inner Currency Rally target set at 6073.

+10% from tomorrow till mid-MaySPX is getting ready to rebound with around 10% till mid-May. Invalidated if breaks below 5400.

SPY/QQQ Plan Your Trade For 5-16 : Gap Potential PatternToday's pattern suggests the SPY will attempt to GAP at the open. The current price structure suggests the SPY/QQQ are in an upward FLAGGING formation related to a broad Excess Phase Peak pattern. I believe this upward trend will continue until price attempts to break either the upper previous Ultimate High pattern or break the lower channel of the current FLAGGING formation.
The wonderful thing about these Excess Phase Peak patterns, and other techniques I'm trying to teach you, is that they provide very clear triggers/directions/opportunities for traders who understand these patterns.
Today, I highlight my SPY Bias (Primary & Secondary) trending system that shows the SPY is much weaker than many people believe. Because of this, I believe we are potentially nearing an Exhaustion Peak in the SPY/QQQ - time will tell.
The use of my extended Biasing systems and Custom Index charts helps me understand what is taking place behind the SPY/QQQ price action. It's like peaking behind the curtains in terms of what my Custom Indexes and other specialized data can provide. I can see what is really taking place related to price action - moving beyond the simple SPY/QQQ charts.
Gold and Silver appear to be setting up an Inverted Excess Phase Peak pattern off a potential Ultimate Low in price. It will be interesting to see how this downward price flag plays out over the next week+. If this pattern holds, we should see the FLAG end and price should rally up into the consolidation phase. Very exciting for metals.
Bitcoin, which tends to lead the SPY/QQQ, is stalling near a peak. Keep your eyes on BTCUSD over the weekend as I believe we may be able to identify how the SPY/QQQ will react on Monday by watching what BTCUSD does.
Thanks for being patient and understanding my schedule over the past 30+ days. I've had multiple family member visit the hospital over the past 5-6+ weeks and my world has been filled with doctors, hospitals, follow-ups, work, and trying to keep everyone healthy and away from trouble.
It appears these issues are starting to get more settled - which means I'll be able to stay more focused on work - instead of driving around everywhere and waiting for appointments.
Get some..
#trading #research #investing #tradingalgos #tradingsignals #cycles #fibonacci #elliotwave #modelingsystems #stocks #bitcoin #btcusd #cryptos #spy #gold #nq #investing #trading #spytrading #spymarket #tradingmarket #stockmarket #silver

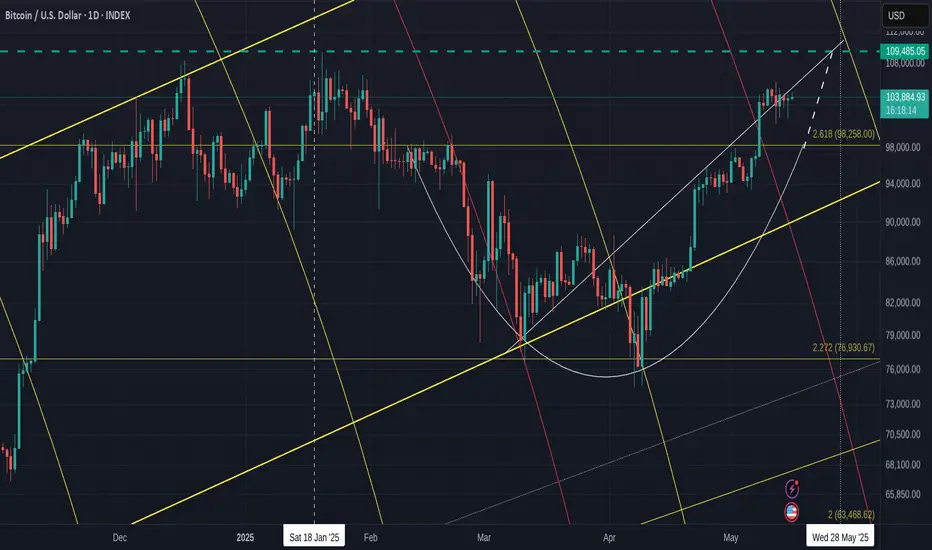
Comprehensive BITCOIN Analysis for the next 7 days - DAILY chart
First Off - Sorry for all the lines on the chart but EVERY one is very relevant to what is happening right now.
The Dashed Blue Horizontal line is the current ATH line. possible Resistance.
The 2.618 Fib extension has not yet been tested as support. This could happen still, at any point till end of month and is around the 98K usd zone.
PA has Ranged through the Local rising line of support, as if it no longer existed, which was a little surprising given the strength that PA has still. There maybe some uncertainty in the air.
PA is above the neckline of the Cup pattern it printed and, again, it would not be unusual to see PA come back down to test this Neckline as support, which is on that 2.618 Fib extension.
The Bold Yellow line is Long Term Support line since 2015, showing that Bitcoin PA is in the Lower side of a Long Term ascending channel, with plenty of room to rise,
PA has a lot of inert strength right now, so, we may not see this retest happen.
We just have to wait.
BUT you can see that Rising dashed line, the extension of the Cup pattern.
PA may range across into this and bump into it next week. If it acts as support again, PA will then be pushed into a tight Squeeze against the other rising line of support, with an Apex on the current ATH line.
PA ALWAYS REACTS BEFORE THE APEX
All that points towards some Volatile times next week if PA remains in this area.
The other descending line there is a 618 Fib Circle. You can see that 98% of the Time, PA is effected by these.
All this shows us 4 points of resistance, in the same Zone, All Next week and PA will Either Shoot through it with a Big push, Or we may see PA Drop back down. The Big question being, how Far ?
We do not want to loose the 2.618 Fib ext at 98K
But what else can we look at. ?
The RSI DAILY
This is still up high in the near Over Bought zone. It can range up here for extended periods but this is something we should be aware of as the possibility of a drop does exist.
On the weekly, RSI has room to move higher & the 4 hour is in neutral zone, again with ability to push higher.
The MACD DAILY
This is once again curling over and about to test the red signal line as support.
On a 4 hour chart, the MACD is down on Neutral line, giving it strength to push higher and if that continues, we will see the yellow MACD line bounce off the Red signal line on the Daily chart.
Once again, Look at the Histogram and the similarity to the area that the Arrow is pointing at.
We could repeat this but on a larger scale. We have to wait and see if this happens.
But also note how there was a Visit into a red Histogram ( for 4 days ) before the bigger push and I remind you about what has been said above.
So, what else can we look at that may offer some ideas ?
The Chart below is the 4 main Crypto Dominance charts by market Cap - 4 hour
BTC.D - ETH.D
OTHERS.D - USDT.D
( OTHERS = Top 125 Coins MINUS Top 10 by Market Cap) Mid to Low cap
We have recently seen a Drop in Bitcoin dominance, giving the ALTS some time to push higher. This is seen with the BTC.D dropping and the ETH.D and OTHERS.D rising
Also note how USDT.D Dropped, showing that stable coins were being exchanged for Crypto,
And as we see now, we have the possibility of BTC.D being rejected by its 50 SMA ( Red)
ETH.D is above its 50 SMA, showing it had a good push and may get support if PA drops
OTHERS.D has already fallen below its 50 SMA, showing a brutal sell off, rapid profit taking.
That is the world of ALTS.
In the last 48 hours, we saw a return for Bitcoin as it rose from a shallow Low in its Range. This was enough to cause a sell off of the ALT coins as we see in the Drop in Others.D
ETH however, remains in a range with obvious intention to continue higher if the market allows.
Lastly, we can compare Bitcoin to the other Markets
Bitcoin - CFD GOLD
DXY - S&P500
Bitcoin has performed well. It has reclaimed some position on Gold recently while it climbed alongside the S&P
We can also see how BTC climbed while DXY dropped.
This highlights some Flaws in using the BTC USD pair to judge the success of BTC but this is explaned better in another post. But in short, If the $ looses Value and your BTC USD pair appears to climb, theg ain is lost as the $ is worth less.
Use BTC XAUT pairs. Bitcoin Gold Pair - Historically, GOLD looses little Value by comparison. So when Bitcoin gains against Gold..It is WIN WIN
So, in conclusion, we see Bitcoin under some pressure to avoid Lower or sharper Drop in the short tern.
The Lower Timeframes show us that BTC has the ability for a Continued Range but with caution.
We see ETH ( and larger Alts ) intent on remain in the game now they have had a small glimpse of Gains
And we see that Mid and Lower Cap Alts are mostly just money makers providing you play the game right. And that game may have some more time if Bitcoin Stumbles in the next 7 days.
And that possibility does exist.
Today is crucial in many ways and will set the tone for the following week.
There is Financial Data being released by the USA today and if unfavourable, we may see some sharp moves.
And ,Longer Term VERY BULLISH - I HOLD AND CONTINUE TO BUY WHEN I CAN ON SPOT ORDERS
I hope this helps and I am grateful for comments
S&P500 - The bottom we have been waiting for!The S&P500 - TVC:SPX - officially created the bottom:
(click chart above to see the in depth analysis👆🏻)
This month we officially saw one of the craziest stock market fakeouts of the past decade. With a drop and reversal rally of about +15%, the S&P500 is about to even close with a green monthly candle, which then indicates that the stock market bottom was created.
Levels to watch: $120, $250
Keep your long term vision!
Philip (BasicTrading)
