S&P500 Uptrend pause supported at 5925India Trade Deal: Trump claims India offered a zero-tariff trade deal with the U.S., but no official confirmation yet. He also said he told Apple CEO Tim Cook to stop building plants in India, despite Apple shifting production there to reduce reliance on China.
Iran Nuclear Talks: Iran may be open to giving up nuclear weapons in exchange for immediate sanctions relief, per NBC. Oil prices fell on speculation this could boost supply.
Russia-Ukraine Talks: Peace progress looks unlikely as Putin sent only low-level officials to talks in Turkey. Trump said he might attend “if appropriate,” but downplayed chances.
Overall: Trump is emphasizing trade and foreign policy strength, while global tensions continue to shape markets and diplomacy.
Key Support and Resistance Levels
Resistance Level 1: 5925
Resistance Level 2: 5970
Resistance Level 3: 6000
Support Level 1: 5790
Support Level 2: 5730
Support Level 3: 5685
This communication is for informational purposes only and should not be viewed as any form of recommendation as to a particular course of action or as investment advice. It is not intended as an offer or solicitation for the purchase or sale of any financial instrument or as an official confirmation of any transaction. Opinions, estimates and assumptions expressed herein are made as of the date of this communication and are subject to change without notice. This communication has been prepared based upon information, including market prices, data and other information, believed to be reliable; however, Trade Nation does not warrant its completeness or accuracy. All market prices and market data contained in or attached to this communication are indicative and subject to change without notice.
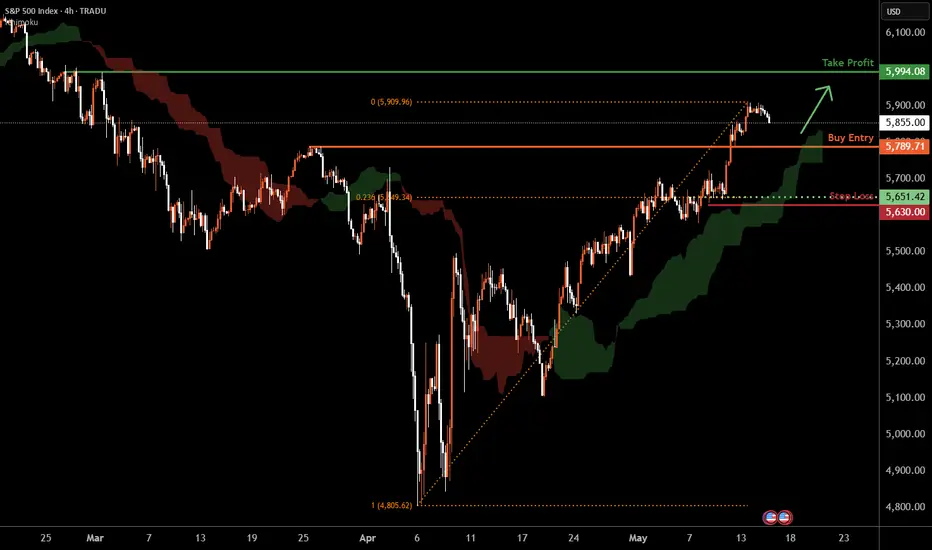
S&P 500 (SPX500)

SPX500 H4 | Potential bullish bounceSPX500 is falling towards a pullback support and could potentially bounce off this level to climb higher.
Buy entry is at 5,789.71 which is a pullback support.
Stop loss is at 5,630.00 which is a level that lies underneath an overlap support and the 23.6% Fibonacci retracement.
Take profit is at 5,994.08 which is a multi-swing-high resistance.
High Risk Investment Warning
Trading Forex/CFDs on margin carries a high level of risk and may not be suitable for all investors. Leverage can work against you.
Stratos Markets Limited (tradu.com):
CFDs are complex instruments and come with a high risk of losing money rapidly due to leverage. 63% of retail investor accounts lose money when trading CFDs with this provider. You should consider whether you understand how CFDs work and whether you can afford to take the high risk of losing your money.
Stratos Europe Ltd (tradu.com):
CFDs are complex instruments and come with a high risk of losing money rapidly due to leverage. 63% of retail investor accounts lose money when trading CFDs with this provider. You should consider whether you understand how CFDs work and whether you can afford to take the high risk of losing your money.
Stratos Global LLC (tradu.com):
Losses can exceed deposits.
Please be advised that the information presented on TradingView is provided to Tradu (‘Company’, ‘we’) by a third-party provider (‘TFA Global Pte Ltd’). Please be reminded that you are solely responsible for the trading decisions on your account. There is a very high degree of risk involved in trading. Any information and/or content is intended entirely for research, educational and informational purposes only and does not constitute investment or consultation advice or investment strategy. The information is not tailored to the investment needs of any specific person and therefore does not involve a consideration of any of the investment objectives, financial situation or needs of any viewer that may receive it. Kindly also note that past performance is not a reliable indicator of future results. Actual results may differ materially from those anticipated in forward-looking or past performance statements. We assume no liability as to the accuracy or completeness of any of the information and/or content provided herein and the Company cannot be held responsible for any omission, mistake nor for any loss or damage including without limitation to any loss of profit which may arise from reliance on any information supplied by TFA Global Pte Ltd.
The speaker(s) is neither an employee, agent nor representative of Tradu and is therefore acting independently. The opinions given are their own, constitute general market commentary, and do not constitute the opinion or advice of Tradu or any form of personal or investment advice. Tradu neither endorses nor guarantees offerings of third-party speakers, nor is Tradu responsible for the content, veracity or opinions of third-party speakers, presenters or participants.
Bearish Forecast for the Dow Jones Starting May 15, 2025Bearish Forecast for the Dow Jones Starting May 15, 2025
The Dow Jones Industrial Average is poised to begin a significant decline, potentially as early as today, May 15, 2025, targeting a retest of the price low from April 7, 2025 (~36,611.78), and possibly lower. This movement is driven by renewed trade tensions, disappointing economic data, and bearish market sentiment.
1. Fundamental Factors Driving Potential Decline
Fundamental factors provide the macroeconomic and policy-driven rationale for the anticipated downturn in the Dow Jones.
1.1. Renewed Uncertainty in Trade Policy
The Dow’s rally on May 12–13, 2025, was fueled by optimism over a temporary U.S.-China tariff reduction agreement (90-day truce) announced after talks in Switzerland on May 11, 2025. However, as of May 15, 2025, investor confidence is faltering due to a lack of progress in ongoing U.S.-China trade negotiations.
Trigger for May 15: A Reuters report from May 14, 2025, notes that U.S. Trade Representative Jamieson Greer and Treasury Secretary Scott Bessent are meeting with Chinese officials, but no new agreements have been confirmed. If today’s talks fail to deliver positive outcomes or if President Trump escalates tariff rhetoric, the Dow could plummet, as seen in early April when tariffs triggered a 5.5% single-day drop. The Dow, with its heavy weighting of multinational corporations, is particularly vulnerable to trade war fears, which could drive it toward the April 7 low as investors price in higher costs and slower global growth.
1.2. Disappointments in Economic Data
CPI Reaction: The April 2025 Consumer Price Index (CPI), released on May 14, 2025, showed inflation at 2.3% annually, below the expected 2.4%. However, the Dow’s decline (-0.6%) on May 14 suggests investors expected a lower figure to support Federal Reserve rate cuts, reflecting skepticism about inflation cooling further.
Producer Price Index (PPI) Release on May 15: The PPI for April 2025, due at 8:30 AM ET (2:30 PM CEST) on May 15, 2025, is critical. A higher-than-expected PPI, potentially driven by tariff-related cost pressures, could signal rising consumer prices, reducing hopes for Fed easing and triggering a sell-off. Consensus expects a 0.2% monthly increase; a reading above 0.3% could echo the April market reaction when GDP contraction fears pushed the Dow to 36,611.78.
Consumer Sentiment: The University of Michigan Consumer Sentiment Index for May 2025, released on May 14, likely showed continued weakness (April: 52.2, a multi-year low). A further decline could heighten concerns about reduced consumer spending, impacting Dow components like Walmart and Home Depot.
1.3. Concerns Over Federal Reserve Policy
On May 7, 2025, Fed Chair Jerome Powell cited “elevated uncertainty” due to trade policies, with markets expecting 75 basis points of rate cuts in 2025, starting in July. If today’s PPI or Initial Jobless Claims (8:30 AM ET) indicate persistent inflation or economic weakness, rate cut expectations could fade, increasing borrowing costs and pressuring Dow valuations, mirroring the April 7 recession fears.
2. Technical Analysis
The Dow’s initial decline in April was approximately -19.00%, with a second impulse of similar magnitude. Technical indicators suggest a bearish setup for May 15, 2025:
Current Level: The Dow closed at 42,051.06 on May 14, 2025, down 0.6%, testing support at 42,000.
Bearish Signals: A 12-hour timeframe analysis indicates alignment for a decline, with potential bearish candlestick patterns (e.g., bearish engulfing) and overbought RSI (70). A break below 42,000 could target the 200-day moving average (40,500) and the April 7 low of 36,611.78.
Price Targets:
Retest of April 7, 2025, low: ~36,611.78
Secondary target: ~35,970.70 (based on Fibonacci extensions and prior support zones).
3. Market Sentiment and Behavioral Factors
Fragile Optimism: The Dow’s 15% recovery from April lows was driven by trade truce hopes and select stock strength. Bloomberg’s May 14, 2025, report notes Wall Street’s rebound is “showing signs of exhaustion” due to trade risks. The Dow’s May 14 weakness, led by an 18% UnitedHealth drop, could spread if negative news emerges today.
Global Correlation: Mixed Asian market performance on May 14 (e.g., Nikkei up 1.43%, India’s Nifty 50 down 1.27%) suggests vulnerability. A lower Asian open on May 15, driven by U.S. declines or trade news, could amplify selling pressure on the Dow.
4. Evidence-Based Framework for the Forecast
4.1. Catalysts for Today’s Decline (May 15, 2025)
PPI Data (8:30 AM ET): A PPI reading above 0.3% could signal sticky inflation, reducing Fed rate cut odds and sparking a sell-off.
Trade Talk Updates: Negative U.S.-China trade comments (e.g., no Geneva deal) could reignite fears, mirroring April 7.
Initial Jobless Claims (8:30 AM ET): Claims above 220,000 (vs. prior 211,000) could signal labor market weakness, fueling recession concerns.
4.2. Dow Scenario
Expect a wave-like decline with corrections. The Dow could fall below 36,611.78, potentially reaching ~35,970.70 if trade and economic pressures intensify. Extreme caution is advised in 2025.
4.3. Global Scenario for S&P 500
I anticipate a wave-like decline with intermittent corrections. I wouldn’t be surprised if the S&P 500 falls below 4,700, potentially reaching 4,200. Extreme caution is warranted this year. There’s even a theory that, starting in 2025, the U.S. dollar could lose 50% of its purchasing power.
Idea:
New Screenshot:
4.4. Oil and Geopolitical Outlook
I expect oil (Brent) to decline to the $50+/- range, from which an upward trend may begin, potentially tied to future military conflicts:
· Europe vs. Russia
· India vs. Pakistan
· Iran vs. Israel
Brent (UKOIL):
Natural Gas:

Tariffs Shocked the World, But Look What Happened NextTrump's “Liberation Day” reciprocal tariff announcement triggered a sharp selloff in the S&P 500 on the 2nd April. A classic policy shock! But the market has since clawed back every point.
So what now? Let’s break it down by strategy.
🔎 Long-Term Investors: Stay the Course
1) This recovery reinforces one truth: When you own quality businesses, Volatility ≠ Risk. Policy creates opportunity, not exit signals.
2) Stick with great companies, buy on fear, and ignore the noise. The next 10 years won’t be won by panic.
⚡ Momentum Traders: Technical Reversal Delivered
1) S&P 500 bounced above its 30-day MA. With the May 12th’s bullish gap (post temporary tariff pause) confirming the trend shift.
2) This was a textbook momentum setup. But if you didn’t plan for the whipsaw, you missed the edge.
📈 What This Means Now
Short-term volatility is likely to continue as tariffs, rates, and elections are all on the table.
Watch for pullbacks into structure and keep risk tight as news-driven moves will be fast and brutal.
Choose your timeframe. Respect the trend. Don’t confuse noise with signal.
The edge now isn’t in prediction — it’s in preparation.

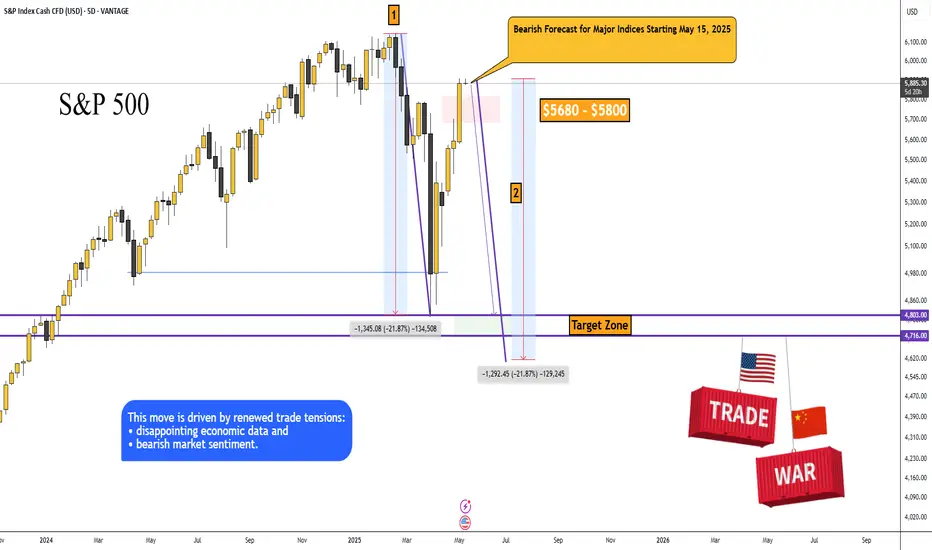
SP500: Bearish Forecast for Major Indices Starting May 15, 2025Bearish Forecast for Major Indices Starting May 15, 2025
The S&P 500, Dow Jones, Nikkei 225, and other major indices are poised to begin a significant decline, potentially as early as today, May 15, 2025, targeting a retest of the price lows from April 7, 2025, and possibly lower (S&P 500: ~4,802.20, Dow Jones: ~36,611.78, Nikkei: ~30,340.50).
This movement is driven by renewed trade tensions, disappointing economic data, and pervasive bearish market sentiment.
1. Fundamental Factors Driving Potential Decline
1.1. Renewed Uncertainty in Trade Policy
· The rally in indices on May 12–13, 2025, was fueled by optimism surrounding a temporary U.S.-China tariff reduction agreement (a 90-day truce) announced after talks in Switzerland on May 11, 2025. However, as of May 15, 2025, investor confidence may be waning due to a lack of tangible progress in ongoing U.S.-China trade negotiations.
Trigger for May 15: Recent reports highlight conflicting statements from the Trump administration, with earlier promises of new trade deals (e.g., a U.K. deal on May 8) followed by uncertainty. A Reuters report from May 14, 2025, notes that U.S. Trade Representative Jamieson Greer and Treasury Secretary Scott Bessent are meeting with Chinese officials, but no new agreements have been confirmed. If today’s talks yield no positive outcomes or if President Trump escalates rhetoric (e.g., reinstating higher tariffs), markets could plummet, as seen in early April when tariffs triggered a 15% drop in the S&P 500.
· Trade war fears disproportionately impact export-heavy indices like the Nikkei, which is sensitive to yen appreciation and U.S.-China tensions, and the Dow Jones, with its significant exposure to multinational corporations. A breakdown in negotiations could drive indices toward the April 7 lows as investors price in higher costs and slower global growth.
1.2. Disappointments in Economic Data
· CPI Reaction: The April 2025 Consumer Price Index (CPI), released on May 14, 2025, reported inflation at 2.3% annually, below the expected 2.4%. While initially viewed as positive, markets may have anticipated an even lower figure to justify Federal Reserve rate cuts. The modest S&P 500 gain (+0.7%) and Dow’s decline (-0.6%) on May 14 suggest investor skepticism about further inflation cooling.
· Producer Price Index (PPI) Release on May 15: The PPI for April 2025, scheduled for release at 8:30 AM ET (2:30 PM CEST) on May 15, 2025, is a pivotal event. If the PPI indicates persistent wholesale inflation—potentially driven by tariff-related cost pressures—it could signal rising consumer prices ahead, diminishing hopes for Fed policy easing and triggering a sell-off. A higher-than-expected PPI could echo the market’s reaction to mixed economic data in early April, when GDP contraction fears pushed indices lower.
· Consumer Sentiment: The University of Michigan Consumer Sentiment Index for May 2025, released on May 14, 2025, likely showed continued weakness (April’s reading was 52.2, a multi-year low). If the May figure, reported yesterday, declined further, it could amplify concerns about reduced consumer spending, negatively impacting corporate earnings and pushing indices downward.
1.3. Concerns Over Federal Reserve Policy
· On May 7, 2025, Fed Chair Jerome Powell highlighted heightened economic risks, citing “elevated uncertainty” due to trade policies. Markets are pricing in 75 basis points of rate cuts for 2025, with the first cut expected in July.
· Trigger for May 15: If today’s PPI data or other economic indicators (e.g., Initial Jobless Claims, also due at 8:30 AM ET) point to persistent inflation or economic weakness, expectations for rate cuts could fade, increasing borrowing costs for companies and pressuring equity valuations. This scenario would mirror April 7, when recession fears and tariff impacts drove the S&P 500 below 5,000.
2. Technical Analysis
· The initial impulse move saw a decline of approximately -21.87%, with a second impulse of similar magnitude (marked on the chart). Currently, markets are aligned for a simultaneous decline across asset classes: oil, cryptocurrencies, and major indices like the S&P 500, Dow Jones, Nikkei, and others.
· Previous analysis concluded that this is a correction preceding a broader decline in indices, driven by trade wars, geopolitical conflicts, and U.S. economic indicators. I believe a recession is already underway.
Price Targets for S&P 500 Decline:
➖ Retest of the April 7, 2025, low: $4,803.00
➖ Secondary target: $4,716.00
3. Market Sentiment and Behavioral Factors
3.1. Fragile Optimism Post-Rally
· The S&P 500’s 22% rally from April lows and the Dow’s 15% recovery were driven by trade truce optimism and strength in technology stocks (e.g., Nvidia, Palantir). However, Bloomberg reported on May 14, 2025, that Wall Street’s rebound is “showing signs of exhaustion” due to trade war risks and fears of an economic slowdown. This fragility could lead to profit-taking today if negative news emerges.
· The Dow’s weakness on May 14 (down 0.6% compared to the S&P 500’s 0.7% gain) highlights vulnerabilities in specific sectors (e.g., healthcare following UnitedHealth’s 18% drop), which could spread to broader markets.
3.2. Global Market Correlation
· Asian markets, including the Nikkei, exhibited mixed performance on May 14, with China’s CSI 300 up slightly (+0.15%) and India’s Nifty 50 down 1.27%. If Asian markets open lower on May 15 due to overnight U.S. declines or trade-related news, it could create a feedback loop, intensifying global selling pressure.
4. Mini Evidence-Based Framework for the Forecast
4.1. Catalysts for Today’s Decline (May 15, 2025)
PPI Data (8:30 AM ET): A higher-than-expected PPI could signal persistent inflation, reducing the likelihood of Fed rate cuts and triggering a sell-off. Consensus anticipates a 0.2% monthly increase; a reading above 0.3% could be bearish.
Trade Talk Updates: Negative commentary from U.S. or Chinese officials (e.g., no deal reached in Geneva) could reignite trade war fears, mirroring the April 7 sell-off.
Initial Jobless Claims (8:30 AM ET): An unexpected rise in claims (e.g., above 220,000 compared to the prior fmadd211,000) could signal labor market weakness, amplifying recession fears.
4.2. Global Scenario for S&P 500
· I anticipate a wave-like decline with intermittent corrections. I wouldn’t be surprised if the S&P 500 falls below 4,700, potentially reaching 4,200. Extreme caution is warranted this year.
· There’s even a theory that, starting in 2025, the U.S. dollar could lose 50% of its purchasing power.
Idea:
4.3. Oil and Geopolitical Outlook
I expect oil (Brent) to decline to the $50+/- range, from which an upward trend may begin, potentially tied to future military conflicts:
· Europe vs. Russia
· India vs. Pakistan
· Iran vs. Israel

S&P500 vs BitcoinNormally, when the S&P500 goes into a bear market, Bitcoin follows.
This cycle, however, for the first time, the S&P500 went into a bear market, while BTC remained above its prior all time highs.
This cycle, Bitcoin either proves a new level of resilience among broader economic uncertainty, or a similar pattern is still yet to play out.
SPY/QQQ Plan Your Trade For 5-14 : Carryover PatternToday's pattern suggests the SPY/QQQ may attempt to stay somewhat elevated. The Carryover pattern is essentially a pattern saying, "expect more of the same type of trending today".
I would suggest the SPY/QQQ are somewhat extended and may pause a bit today.
I shared a chart I created back on March 23, 2025 that I found very interesting - showing a big rally in late-April/early-May. If that chart continues to be accurate - it suggests the markets may attempt a reversion move to the downside over the next 20-30+ days.
Time will tell if my predictions play out accurately or not.
Gold is moving into new BEARISH trending on the GOLD Cycle Patterns. After an extended consolidation phase in metals, this shift in the trend models was going to happen at some point.
Now, we need to see if Gold/Silver can hold above recent support or not. Even though I believe Gold/Silver are poised for another big rally, the disruptions related to the global economy and tariffs seems to have taken some of wind out of the sails of the metals rally (for now).
Bitcoin continues to lead the SPY/QQQ. Keep an eye on what BTCUSD does over the next 7-15+ days as I believe it will lead the US markets in trending (still).
Get some.
#trading #research #investing #tradingalgos #tradingsignals #cycles #fibonacci #elliotwave #modelingsystems #stocks #bitcoin #btcusd #cryptos #spy #gold #nq #investing #trading #spytrading #spymarket #tradingmarket #stockmarket #silver

S&P 500 Index May Lose Upward MomentumS&P 500 Index May Lose Upward Momentum
Yesterday’s inflation data release held no major surprises, as the actual Consumer Price Index (CPI) figures came in close to analysts’ forecasts.
According to Forex Factory:
→ Annual CPI: actual = 2.3%, forecast = 2.4%, previous = 2.4%;
→ Monthly Core CPI: actual = 0.2%, forecast = 0.3%, previous = 0.1%.
Overall, stock indices rose yesterday, but according to media reports, this momentum may begin to slow in the near future:
→ UBS analysts downgraded their rating on US equities from “attractive” to “neutral” following the recovery from early April lows;
→ Goldman Sachs analysts believe that the US stock market rally could stall at current levels. In their view, the S&P 500 (US SPX 500 mini on FXOpen) is likely to reach 5900 over the next three months.
Technical Analysis of the E-Mini S&P 500 Chart
The chart provides more reasons to suggest that the current pace of growth may begin to slow.
Firstly, the index has entered a broad range between 5800 and 6120, where it spent a prolonged period during late 2024 and early 2025. This is a zone (highlighted in purple) where supply and demand previously reached a stable equilibrium — and similar balance could potentially emerge again.
Secondly:
→ the slope of the current upward channel (marked in black) appears excessively steep;
→ the RSI indicator points to a divergence;
→ the psychological level of 6000 may act as resistance.
Given the above, special attention should be paid to the scenario in which the S&P 500 (US SPX 500 mini on FXOpen) forms a short-term correction before the end of the month.
This article represents the opinion of the Companies operating under the FXOpen brand only. It is not to be construed as an offer, solicitation, or recommendation with respect to products and services provided by the Companies operating under the FXOpen brand, nor is it to be considered financial advice.

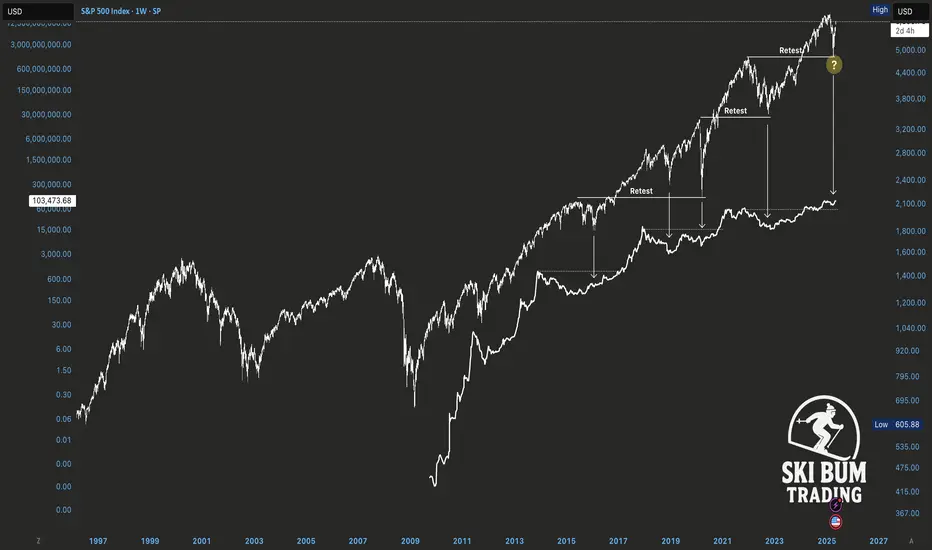
S&P 500 Index Most Bullish Signal In 15 YearsThis is why it is very clear, certain, that the stock market, the S&P 500 Index (SPX) is set to grow in the coming months. Last week produced the highest volume session, on the bullish side, since April/May 2010, that's 15 years. Back then, when this signal showed up, this index went to grow for years non-stop.
The SPX also produced the strongest weekly session in several decades, maybe the strongest week ever, and a bounce happened (support found) exactly at the 0.618 retracement Fib.
This is all we need to know. When the bulls enter the market and do so with force, it is because the market is set to grow. The correction produced decline of 21%. This is pretty standard. The fact that the correction happened really fast, it means that it will also have a fast end.
The low is in. The correction is over. The S&P 500 Index is set to grow.
You can be certain. If you have any doubts, just ask the chart.
Namaste.

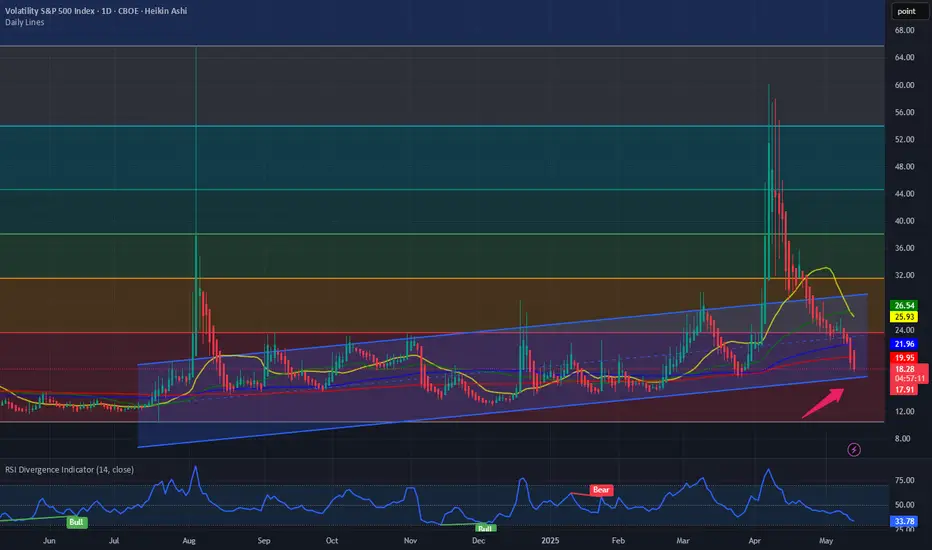
$VIX: Where does VIX go from here? Happy Tuesday. A new week, new market KPIs to look at. Since the ‘Liberation Day’ VIX spike to 50 it has been a bear market for VIX and has been going down since then. Since then, the S&P had more than 11 day of positive close for the day. This is which we would expect when VIX is making new lower highs and lower lows. But where does the VIX go from here?
It has been a remarkable trade to buy the indexes NASDAQ:QQQ and SP:SPX when the TVC:VIX is at or above 30. And then unwinding the trade when TVC:VIX touches 15. We have more than 10 days of positive closes in SP:SPX and the TVC:VIX is at 17. So we might have some more positive return in the near term. And then we rinse and repeat the same trade. Sell the indices when TVC:VIX touches 15 or lower band of this upward sloping channel.
Verdict: Stay long until TVC:VIX @ 15. Unwind trade and then wait for TVC:VIX @ 30.
SPY/QQQ Plan Your Trade For 5-13 : Rally 111 PatternToday's RALLY pattern suggests we will see continued upward price trending in the SPY/QQQ (and possibly BTCUSD).
I believe the continued positive news/announcements by the Trump administration is adding fuel for the current rally phase in the US markets. It is hard to ignore his tactics (like them or hate them). He is able to get things done in a way that many believe is disruptive.
Still, from what I'm hearing, the Chinese trade deal is a very broad and advantageous deal that somewhat "resets" the disparity the US has experienced for the past 20+ years with China. Overall, that is a very positive advancement in global trade.
Now, we'll have to see how the markets react to this news and is the hype is as good as the final trade deal.
Overall, the US markets are still climbing up the current FLAGGING formation (still BULLISH).
I see another Island (GAP) type of price move, which may prompt some consolidation - we'll see how things play out.
Gold and Silver are setting up double/triple bottoms across support.
BTCUSD is rallying higher within a similar FLAG formation to the SPY/QQQ.
In my mind, the markets are back to nearly where they were prior to the tariffs and early breakdown in late-February 2025. This is the "make or break" time for the markets.
Either the SPY continues higher and attempts to break above resistance - or it will start to fail over the next 5-10+ days and break downward.
Buckle up... and GET SOME.
#trading #research #investing #tradingalgos #tradingsignals #cycles #fibonacci #elliotwave #modelingsystems #stocks #bitcoin #btcusd #cryptos #spy #gold #nq #investing #trading #spytrading #spymarket #tradingmarket #stockmarket #silver

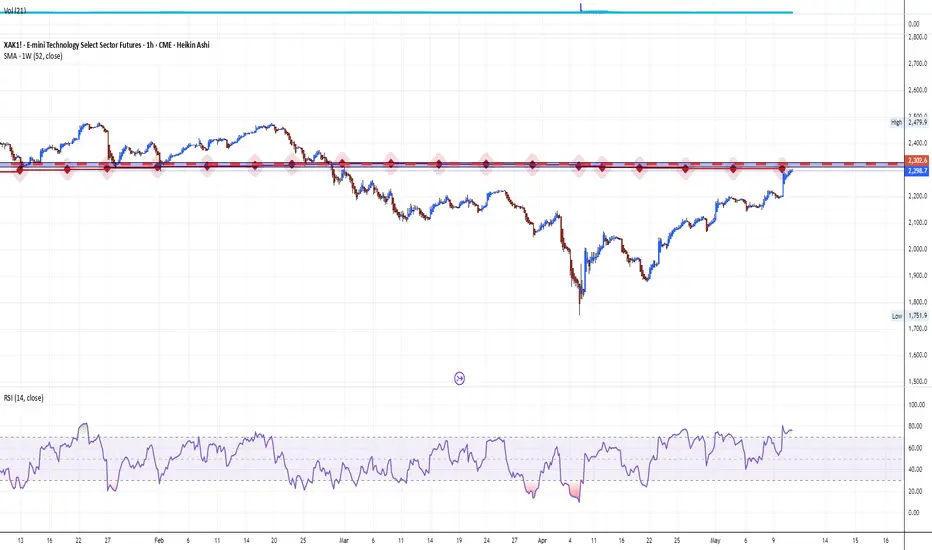
US Technology Stock Sector. The Underpressured PathThe recent reduction of tariffs under former President Trump's administration, while intended to ease trade tensions, has had several negative impacts on the U.S. technology sector, particularly in 2025.
Increased Costs and Supply Chain Disruptions
Despite some tariff reductions, the overall tariff environment remains highly volatile and complex. Many tariffs on tech products, especially those involving China, remain elevated-up on Chinese-made smartphones and other electronics. This has significantly increased manufacturing costs for U.S. tech companies reliant on global supply chains, particularly those sourcing components or assembling products in China, Vietnam, and other Asian countries.
The tariffs have disrupted supply chains, forcing companies to reconsider production locations and logistics. Many firms are shifting production away from China to countries like India or Vietnam to mitigate tariff impacts, but this transition is costly and slow. Reshoring semiconductor manufacturing to the U.S. is challenging due to high labor costs and lack of skilled workforce, which means higher prices for end products like AI-enabled PCs and servers are expected.
Suppressed Consumer Demand and Market Uncertainty
Higher tariffs translate to increased retail prices for consumer electronics, reducing demand. For example, smartphone prices have risen, leading to weaker consumer sentiment and slower sales growth. This is particularly harmful in a sector where rapid innovation and high sales volume are critical for profitability and investment in new technologies.
The uncertainty caused by fluctuating tariff policies has also led to delayed purchasing decisions by enterprises and consumers. Companies are hesitant to invest in new hardware or AI infrastructure due to unclear future costs and potential further tariff changes. This delay threatens technology roadmaps and weakens the U.S. tech sector's competitiveness globally.
Impact on Innovation and Investment
Tariffs have broader implications beyond immediate cost increases. By fragmenting markets and increasing operational costs, they reduce incentives for innovation. Companies face pressure to duplicate investments or abandon certain markets, which slows technological progress and reduces the U.S.'s ability to maintain leadership in emerging fields like AI and advanced semiconductors.
The increased costs and uncertainty have also dampened investment in U.S. tech infrastructure. Although some companies like TSMC and Apple have announced U.S. manufacturing investments to offset tariff impacts, these efforts are insufficient to counterbalance the negative effects fully. The long lead times and capital intensity of building semiconductor fabs mean that reshoring will not provide a quick fix.
Economic and Strategic Risks
The tariffs contribute to broader economic risks, including potential recession, inflation, and job losses in the tech sector and related industries. CEOs across sectors have expressed concerns about the tariffs leading to economic downturns, higher prices, and layoffs. The tech sector, being highly globalized and interconnected, is particularly vulnerable to these macroeconomic shocks.
Moreover, the tariffs strain U.S.-China relations, a critical factor in global tech supply chains and innovation ecosystems. Retaliatory tariffs from China and other countries further complicate market access for U.S. tech firms, reducing their export opportunities and competitiveness.
Conclusion
In summary, the recent tariff reductions under Trump's policy have not fully alleviated the negative impacts on the U.S. technology sector. Elevated tariffs continue to raise manufacturing costs, disrupt supply chains, and suppress consumer demand. The resulting uncertainty delays investments and innovation, while economic risks and strained international relations further threaten the sector's growth and global standing. These factors collectively undermine the competitiveness and future prospects of the U.S. tech industry.
Technical challenge
The main technical graph for US Technology Sector Futures CME_MINI:XAK1! (cost-adjusted modification) still remains under key resistance of 52-week SMA, which indicates on further possible bearish pressure.
--
Best wishes
@PandorraResearch Team
Market has shifted to a lower rising channel. Correction dueI believe the market has discounted the tariff effect and now shifted to a lower channel.
If that is the case, then a normal correction of 5% is imminent, as it encounters multiple resistance trendlines. The inflation (CPI) numbers on 13 May could be a catalyst

S&P500 Chasing a Retrace - Waiting for Equilibrium After Rally🗓️ Yesterday, I mentioned watching the S&P 500 for a retrace to find a potential long entry. But with the US-China tariff agreement announced, the market rallied hard 🚀—a clear positive for stocks. We didn’t get much of a pullback, and right now, I see the S&P 500 as overextended. I’m not looking to jump in at these premium levels. Instead, I’m waiting for a Fibonacci retrace back down into equilibrium on the current swing for a better opportunity. 👀
My plan: I’ll watch for a bearish break of structure to signal a retrace, then monitor price action as we approach support. If support holds and we get a bullish break of structure, that’s when I’ll look to get involved. 🔄
Just sharing my idea here—this isn’t financial advice! 📢

We Have a Full Pattern into The Target BoxI am now looking for a 5-wave pattern to develop to the downside, followed by a 3-wave retrace, that in the coming weeks can take us back out of the Target box to the downside. Price must breach the 5578 area to give us any indication the pattern to the upside below is cracking.

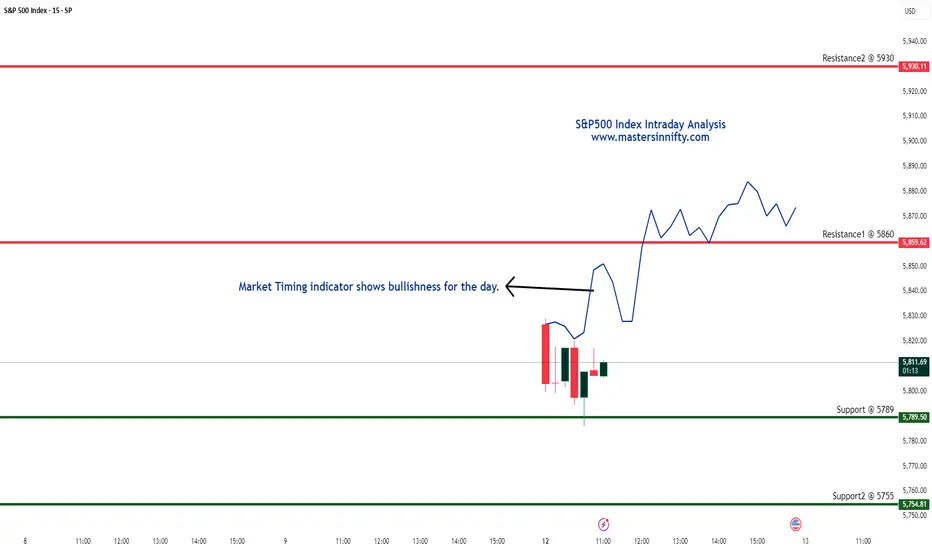
S&P500 Index Intraday Trend Analysis for May 12, 2025The S&P 500 Index is displaying bullish indications for the day. Key support levels are observed at 5789 and 5755, while resistance is expected around 5860 and 5930.
Please note, this is solely my personal view. Traders are advised to conduct their own technical analysis and ensure proper risk management before making any trading decisions.
$SPY still bearish unless $584 and trendline break as resistanceI'll be the first to admit that the rally has gone further than I expected. That said, everything on the chart still looks like this is a bearish rally and not a new bull trend.
Unless we can break the blue trend line and the strong overhead resistance between $581.63 and $583.57, I think the most likely scenario is we fall further and see one last leg down before we bottom.
I think the bottom will come between the lower supports at $409 and $538.
Again, invalidation of the bearish idea is a break and flip of the resistances above, the upside targets are on the chart as well.
Let's see what happens over the coming weeks.

Celanese Corp | CE | Long at $39.64Celanese Corp is another chemical company (like Dow Inc) crushed by tariffs and economic headwinds. It's dropped -78% in one year.... However, this is a very strong company with strong credit market interest and no immediate liquidity crisis. From a technical analysis perspective, this... like in 2008 and 2020... is the time to gather shares given it has reached the "abysmal crash" levels based on my selected simple moving averages. In the past, recovery to new highs has taken 1-2 years. History doesn't always repeat, but fear is opportunity in the stock market. If negative news continues to reign, a dip into the high $20's isn't out of the question.
If the company can squeak through 2025 and not continue to stack debt (debt/equity=2.43x), the growth opportunity into 2027-2028 looks promising.
I'm keeping my targets into 2026 low, but this could be a good buy and hold for the right investor.
Targets:
$47.00
$54.75

SPY/QQQ Plan Your Trade for 4-12 : Rally In CountertrendIn today's video, I try to highlight the TREND features in the SPY CYcle Pattern data window for all of you to use.
Yesterday, I received a comment from a friend/client asking about the strength in the markets compared to my expectations.
My answer was simple. The SPY Cycle Pattern data window shows Short-Term (ST), Long-Term (LT) trending as well as the Daily/Weekly Bias trends.
Traders should use these to determine the primary trend/direction of price action.
Additionally, I try to add my own thoughts/context related to the market setup/structure. That is where I teach you about the EPP/Cradle patterns and more.
Ideally, my analysis and the SPY Cycle Patterns align with the future price moves in a way that everyone can profit from the highest probability outcomes.
There are times when news or outside forces drive the market trend beyond my expectations and, in some cases, beyond the SPY Cycle Pattern predictions. This recent Trump-Pump rally may be one of those cases.
Either way, I continue to try to deliver the best technical analysis and research I can offer for followers.
Get some.
#trading #research #investing #tradingalgos #tradingsignals #cycles #fibonacci #elliotwave #modelingsystems #stocks #bitcoin #btcusd #cryptos #spy #gold #nq #investing #trading #spytrading #spymarket #tradingmarket #stockmarket #silver

S&P 500 WEEKLY Bullish Divergence According to this bullish divergence we have on weekly time frame for S&P 500, it can push to about $6800 and Bitcoin follows to new ATHs

Cautious Optimism: What’s Next for the S&P 500US500 My Outlook for the Next Week:
Given the relentless bullishness on the chart and the current backdrop, here’s how I see the next week playing out:
Short-Term: The S&P 500 may continue to consolidate or experience mild pullbacks as investors digest recent gains and await fresh catalysts. Sector rotation could create choppiness, especially if tech underperforms.
Catalysts: Watch for key economic data (inflation, employment, Fed commentary) and any major earnings surprises. These could trigger renewed momentum or a sharper correction.
Risk/Reward: The risk of a sharp correction is rising, but the underlying trend remains bullish unless there’s a significant negative surprise. A shallow pullback or sideways action would be healthy and could set up the next leg higher if fundamentals remain intact.
In summary: The S&P 500’s relentless bullishness is being tested by mixed sentiment and cautious analyst forecasts. Fundamentals are still supportive, but risks are rising. For the next week, expect consolidation or mild volatility, with the potential for renewed upside if economic data and earnings remain strong. Stay nimble, watch for sector rotation, and be prepared for both short-term pullbacks and longer-term opportunities.
Not financial advice.

SPY WEEKLY 12 MAY 2025Welcome to Spy weekly. I have tried my best to explain the price action here. If you have any doubts, feel free to leave a comment or DM me.
NOTESTAY AWAY FROM OPTIONS
