SPY/QQQ Plan Your Trade For 5-6 : GAP Breakaway patternToday's pattern suggests a morning GAP will take place and price will continue to break away from yesterday's body range.
Given the fact that the markets are already almost 0.8-0.9% lower than yesterday's closing price level, this suggests the markets will continue to trend downward today.
Is this it? Is this the breakdown for May 2-5, seeking the Major Bottom I've talked about for the past 3+ weeks?
We'll find out over the next 5-10+ days.
Ultimately, the EPP patterns have aligned across multiple instruments/symbols to present a very clear opportunity to the downside. Now, we need to watch and wait as the markets should be moving into the early FLAGGING stage of the downward EPP pattern.
After the FLAGGING pattern, we should get the breakdown into consolidation, which is where I believe big profits can be made. That breakdown into the consolidation phase is usually very aggressive and can often be after the FLAGGING range.
Gold and Silver are making a move higher. I suggested this would be the case over the past 5-10+ days - but, boy, was it frustrating to watch Gold and Silver consolidate over the past few weeks.
At this point, I'm looking for Gold to rally above $3500 and for Silver to attempt to rally above $34.00.
Bitcoin seems to be leading the SPY/QQQ (again) and appears to be about 2-3 days ahead of the major US indexes, attempting to move into a downward FLAGGING formation.
This could be very interesting if BTCUSD continues to lead the SPY/QQQ. Meaning, we may be able to rely on the structures/setups in BTCUSD as a 2-3 day early window of that the SPY/QQQ may be doing (for a while). I'm sure it won't continue to align at some point in the future.
Again, I'm getting great comments from followers and subscribers. Thank you.
I'm doing my best to deliver the best research I can within these 15 to 20-min videos.
Get some.
#trading #research #investing #tradingalgos #tradingsignals #cycles #fibonacci #elliotwave #modelingsystems #stocks #bitcoin #btcusd #cryptos #spy #gold #nq #investing #trading #spytrading #spymarket #tradingmarket #stockmarket #silver
S&P 500 (SPX500)

S&P500 INTRADAY resistance at 5510US stock futures are signaling a second straight day of losses. Palantir shares dropped 9% pre-market after its earnings disappointed high expectations. Ford also fell, withdrawing its financial guidance and warning that new tariffs would hurt profitability.
In Europe, political uncertainty hit German markets as Friedrich Merz failed to secure a majority vote to become Germany’s next chancellor, delaying his swearing-in and shaking investor confidence. The DAX index slid 1.4% on the news.
Meanwhile, EU-US trade tensions are intensifying. The European Union expects new US trade probes could expose up to €549 billion ($622 billion) worth of EU exports to American tariffs, adding pressure to already strained transatlantic negotiations.
Key Support and Resistance Levels
Resistance Level 1: 5693
Resistance Level 2: 5780
Resistance Level 3: 5876
Support Level 1: 5512
Support Level 2: 5438
Support Level 3: 5390
This communication is for informational purposes only and should not be viewed as any form of recommendation as to a particular course of action or as investment advice. It is not intended as an offer or solicitation for the purchase or sale of any financial instrument or as an official confirmation of any transaction. Opinions, estimates and assumptions expressed herein are made as of the date of this communication and are subject to change without notice. This communication has been prepared based upon information, including market prices, data and other information, believed to be reliable; however, Trade Nation does not warrant its completeness or accuracy. All market prices and market data contained in or attached to this communication are indicative and subject to change without notice.

#ES1! "E-Mini S&P500" Index Market Bullish Robbery Plan🌟Hi! Hola! Ola! Bonjour! Hallo! Marhaba!🌟
Dear Money Makers & Robbers, 🤑 💰💸✈️
Based on 🔥Thief Trading style technical and fundamental analysis🔥, here is our master plan to heist the #ES1! "E-Mini S&P500" Index Market Heist. Please adhere to the strategy I've outlined in the chart, which emphasizes long entry. Our aim is to escape near the high-risk YELLOW MA Zone. It's a Risky level, overbought market, consolidation, trend reversal, trap at the level where traders and bearish robbers are stronger. 🏆💸"Take profit and treat yourself, traders. You deserve it!💪🏆🎉
Entry 📈 : "The vault is wide open! Swipe the Bullish loot at any price - the heist is on!
however I advise to Place buy limit orders within a 15 or 30 minute timeframe most recent or swing, low or high level. I Highly recommended you to put alert in your chart.
Stop Loss 🛑:
Thief SL placed at the Nearest / Swing low level Using the 3H timeframe (5440) Day/Swing trade basis.
SL is based on your risk of the trade, lot size and how many multiple orders you have to take.
🏴☠️Target 🎯: 5730
💰💵💸#ES1! "E-Mini S&P500" Index Money Heist Plan is currently experiencing a bullishness,., driven by several key factors. .☝☝☝
📰🗞️Get & Read the Fundamental, Macro Economics, COT Report, Geopolitical and News Analysis, Sentimental Outlook, Intermarket Analysis, Index-Specific Analysis, Future trend targets with Overall outlook score... go ahead to check 👉👉👉🔗🔗🌎🌏🗺
⚠️Trading Alert : News Releases and Position Management 📰🗞️🚫🚏
As a reminder, news releases can have a significant impact on market prices and volatility. To minimize potential losses and protect your running positions,
we recommend the following:
Avoid taking new trades during news releases
Use trailing stop-loss orders to protect your running positions and lock in profits
💖Supporting our robbery plan 💥Hit the Boost Button💥 will enable us to effortlessly make and steal money 💰💵. Boost the strength of our robbery team. Every day in this market make money with ease by using the Thief Trading Style.🏆💪🤝❤️🎉🚀
I'll see you soon with another heist plan, so stay tuned 🤑🐱👤🤗🤩

SPX500 D1 I Bullish Bounce Based on the D1 chart analysis, the price is falling our buy entry level at 5492.54, a pullback support.
Our take profit is set at 5797.53, an overlap resistance.
The stop loss is placed at 5386, a pullback support.
High Risk Investment Warning
Trading Forex/CFDs on margin carries a high level of risk and may not be suitable for all investors. Leverage can work against you.
Stratos Markets Limited (tradu.com):
CFDs are complex instruments and come with a high risk of losing money rapidly due to leverage. 63% of retail investor accounts lose money when trading CFDs with this provider. You should consider whether you understand how CFDs work and whether you can afford to take the high risk of losing your money.
Stratos Europe Ltd (tradu.com):
CFDs are complex instruments and come with a high risk of losing money rapidly due to leverage. 63% of retail investor accounts lose money when trading CFDs with this provider. You should consider whether you understand how CFDs work and whether you can afford to take the high risk of losing your money.
Stratos Global LLC (tradu.com):
Losses can exceed deposits.
Please be advised that the information presented on TradingView is provided to Tradu (‘Company’, ‘we’) by a third-party provider (‘TFA Global Pte Ltd’). Please be reminded that you are solely responsible for the trading decisions on your account. There is a very high degree of risk involved in trading. Any information and/or content is intended entirely for research, educational and informational purposes only and does not constitute investment or consultation advice or investment strategy. The information is not tailored to the investment needs of any specific person and therefore does not involve a consideration of any of the investment objectives, financial situation or needs of any viewer that may receive it. Kindly also note that past performance is not a reliable indicator of future results. Actual results may differ materially from those anticipated in forward-looking or past performance statements. We assume no liability as to the accuracy or completeness of any of the information and/or content provided herein and the Company cannot be held responsible for any omission, mistake nor for any loss or damage including without limitation to any loss of profit which may arise from reliance on any information supplied by TFA Global Pte Ltd.
The speaker(s) is neither an employee, agent nor representative of Tradu and is therefore acting independently. The opinions given are their own, constitute general market commentary, and do not constitute the opinion or advice of Tradu or any form of personal or investment advice. Tradu neither endorses nor guarantees offerings of third-party speakers, nor is Tradu responsible for the content, veracity or opinions of third-party speakers, presenters or participants.

Little Rest For SPXI think the SPX structure is more prone to bearishness. There is a structure that will probably move quickly in one direction. I don't think a good structure has been formed for a bottom. And the rise does not seem very strong. For this reason, I expect an increase after the first fall.
Since this situation will probably reflect on crypto, my bearish contracts are still in place. But I am thinking of buying a bullish contract until the FOMC time.

VIX looks close to jumping up.MACD on daily looking to reverse, RSI has been in oversold territory, this is just on a daily though so not necessarily a guaranteed reversal but it seems to be getting support.

SPX Running Into Important Resistance At 5780Last week we saw a weaker-than-expected Advance GDP in the first release, which led some to believe Powell might consider cutting rates. But Friday’s NFP came in better than expected. Expectations are no change for the Fed, and I honestly don’t believe they’ll move either.
Despite Trump putting pressure on them, inflation is still not at their 2% target, and the job market remains solid—so there may be no real reason to cut yet.
They’re watching markets too, and we've seen a pretty strong rebound, so there’s likely no urgency to act now.
Also, if they were to cut, it could appear politically motivated due to Trump, and that could seriously damage investor trust in the Fed’s independence.
So with that being said, we are wondering if the SPX can find some resistance if FED does not deliver a dovish view at this moment. Well, looking at the price action, it certainly looks overlaping recovery from April low, that can face limited upside near 5780, at April 2nd high.
If by Friday, we close above the 78.6% Fib then we may look at wave 3, alt sceario.
Grega

Ideal TGTS =Covid's low @ $28.55/ 2012 Major Trend line @$36.92Two major targets here for PZZA as illustrated on the chart all else absolute !
Major trend line starting from 2012's low and the second one is Covid's low!
Both are legitimate technical reversal points !!!

ES Futures at a Crossroads: Fed Steady, Market ReadyCME_MINI:ES1!
Recent Market Performance
ES Futures experienced a significant decline of 22.30% from the February 19, 2025 high of 6218.50 to the recent low of 4832 on Monday, April 7th, 2025. This drawdown included a sharp 16.30% sell-off, triggered by the announcement of reciprocal tariffs, marking a decline from the April 2, 2025 high to the April 7th low.
Since forming that low, ES Futures have rebounded impressively—rallying 18.48% into the May 2nd high, retracing well over 50% of the losses. Notably, price action has closely respected Fibonacci retracement levels, as illustrated in the accompanying chart.
Macro Fundamentals
There are several macroeconomic considerations at play:
• Quarterly GDP data appears skewed due to front-loaded imports, evident in the January and February import numbers.
• This week’s March trade balance, imports, and exports data for both the U.S. and China will be crucial. These figures will shed light on how escalating tariff tensions have influenced Q1 business activity.
• The key event this week is the Federal Reserve interest rate decision and FOMC press conference. Of particular interest will be how the Fed’s risk outlook has evolved in light of Trade War 2.0, along with updates to growth and inflation forecasts.
While the Fed is expected to hold rates steady, there are increasing calls from President Trump to cut rates. Although recent soft data has shown signs of deterioration, this has not yet translated into hard data. In fact, April’s Non-Farm Payroll (NFP) report beat expectations, underscoring continued economic resilience.
Key Question: What Comes Next?
Will ES Futures continue to trend higher, reverse lower, or consolidate?
Key Technical Levels
• mCVAL: 5635
• Upper Neutral Zone : 5620 – 5585
• March 2025 Low: 5533.75
• Lower Neutral Zone : 5171.75 – 5150.75
Fibonacci Retracement Levels (2025 High to Low)
• 2025 High: 6218.50
• 0.786 Retracement: 5921.75
• 0.618 Retracement: 5688.75
• 0.5 Level (Mid-Range): 5525.25
• 2025 Low: 4832
Our View
We believe downside risks are currently minimized, barring a new market-moving development—such as a disruptive social media post. Q1 earnings have broadly reflected strength, reducing the probability of further downside in the near term.
Given the current backdrop:
• Positive news could act as a catalyst for higher prices.
• In the absence of significant newsflow, we expect consolidation, followed by a potential resumption of the upward trend.
Scenario 1
A pullback to either the blue support zone near the 0.618 Fibonacci retracement confluence, or a deeper pullback towards the confluence of the 2025 mid-range and March 2025 lows, followed by a continuation higher.
Scenario 2
Seasonality supports consolidation. Historical index behavior at this time of year further aligns with the potential for sideways movement before the next leg higher.

SPY/QQQ Plan Your Trade For 5-5-25 : GAP Reversal PatternToday's pattern suggests the SPY will open with a GAP range from yesterday's candle Body and attempt to reverse the trend we saw last week.
I believe this move will resolve to the downside, as I've been warning of the May 2-5 Major Bottom for many weeks.
I believe the extended uptrend over the last few weeks was pure speculation related to Q1 US earnings. It is hard to argue that traders playing into the Q1 earnings boost didn't play the right side of the trend after watching the markets rally over the past 2+ weeks. But, I still believe the markets will consolidate and attempt to move downward over the next 10- 20+ days.
The one thing that we have to understand is Q1 was almost on auto-pilot from Biden's economy/spending until Trump threw a curveball at the global markets with tariffs.
I don't believe the US & global markets have truly priced in a global -25% to -45% economic contraction because of the ongoing tariff negotiations. It has been reported that shipping rates are down 60% in China. I believe we still need another 30-60+ days to work out the tariff issues and to allow the markets to settle into proper expectations for future economic output/growth.
Because of this, I continue to urge traders to stay cautious.
Sitting on CASH right now (only trading 20% of your total capital) is probably the smartest thing you can do at the moment.
I still expect the July and October 2025 lows to be the base/bottom of the markets, leading to a stronger upward price trend.
Right now, I've very cautious we've just seen a "dead-cat bounce" off recent lows because of Q1 earnings expectations.
Now that we've passed most of the Q1 data - we are staring at Q2 & Q3. What comes next.
I believe Gold/Silver will continue to price in extreme risk factors - resulting in a strong rally through May and into June.
I believe Bitcoin will stall and move back down to the lower consolidation range.
Let's see how things play out this week.
Get some.
#trading #research #investing #tradingalgos #tradingsignals #cycles #fibonacci #elliotwave #modelingsystems #stocks #bitcoin #btcusd #cryptos #spy #gold #nq #investing #trading #spytrading #spymarket #tradingmarket #stockmarket #silver

S&P 500 Tests Key Zone Ahead of FOMCThe S&P 500 has reached the 5,700–5,800 zone after a nearly 18% rally in just half a month. This zone could determine whether the rally marks the end of the bearish trend or if more pain lies ahead for the stock market.
The 200-day simple moving average, several previous horizontal support levels, and the most recent top all converge in this area. The upward move has been driven by correction dynamics, optimism around potential trade deals, signs of de-escalation with China, and rising expectations for Fed rate cuts in 2025.
This week, the FOMC may either temper those optimistic rate cut expectations or hint at a more dovish tone. In either case, some profit-taking may occur ahead of the meeting, and the 5,700–5,800 zone is a strong candidate for that to happen.

SPX: Short term bearish to touch gap? And fill? Looking like there is apparently “no tariff talks” per China.
We’re still in such an uptrend, but looking for a short-term pull back on negative news. Also we have FOMC this week. Does Powell give what Trump and the people want, a rate cut?
I’m looking for 5678.33 to
- TP1: 5672.46
- TP2: 5635.06
Possible touch or fill gap of below 5603.21?
Let me know what you think. Do your DD, not FA. Let’s see what the week brings.

Week ahead analysis May 4th to 11th**Week Ahead Analysis (May 5 – May 11, 2025)**
### **Baseline: Market Expectations**
- **Tariffs & Fed Policy:** Trump's tariff announcement has heightened concerns about economic slowing, prompting bond markets to price in up to four Federal Reserve rate cuts this year.
- **Trade Talks & Sentiment Shift:** Reports suggest China may restart trade negotiations, boosting risk sentiment. However, China insists the U.S. must first remove all unilateral tariffs, adding uncertainty to the discussions.
- **Market Reaction:** Risk assets—equities and high-beta currencies like AUD, NZD, and CAD—are climbing as volatility cools. Meanwhile, safe havens such as JPY, CHF, and gold are facing selling pressure, though overall risk sentiment remains cautious.
### **Potential Surprise Scenarios**
- **Trade Deal Secured:** A deal would likely send equities higher, strengthen risk-sensitive currencies, and drive safe havens lower.
- **No Deal Reached:** In contrast, safe havens could gain while risk assets retreat.
### **Big Picture Outlook**
Regardless of the immediate outcome, the market's medium-term trajectory hinges on the broader effects of trade policy. If tariffs persist, economic uncertainty may sustain the Fed’s dovish stance. A successful trade deal, however, could restore confidence, shifting expectations back toward growth stabili

Chart Called It S&P 500 Bottom on April 7 Confirmed the March 27On March 27, 2025, I published an analysis identifying the potential for a major bottom forming in the S&P 500 near 4,790.57:
Original chart and analysis
At that time, the index was consolidating just above key support, with growing downside pressure ahead of major economic reports. Despite broad caution in the market, the technical setup signaled a potential reversal.
The first rising channel developed in March, helping to support the rebound but it later broke to the downside, leading to another test of support. That move did not invalidate the broader structure.
On April 7, the S&P 500 made its cycle low at 4,835.04, just shy of the target. Since then, a second rising channel has formed, with higher lows and momentum supported by volume.
The price is now approaching major resistance at 5,822.
If it gets rejected, a pullback toward the rising trendline or the 5,438 area is likely. As long as price holds above the April 7 low and respects trendline support, the bullish structure remains intact. A confirmed breakdown below that support would increase the risk of a deeper retracement.
This progression underscores the importance of trusting price structure over sentiment.
The market followed the chart.
The bottom was April 7.
The call was made March 27.
The chart led the move.

The Bitcoin Illusion: Why $300K or $1M Is a Pipe DreamBitcoin enthusiasts love throwing around wild price predictions—$300K, $1M, even $5M per BTC—as if these numbers are inevitable. But let’s break down the math and expose the delusion behind these claims:
Bitcoin at $300K or $1M? Let’s Do the Math
- $300,000 is a number pulled out of thin air by Michael Saylor and Robert Kiyosaki, either deliberately misleading or financially illiterate. They fail to grasp that this would require a market cap of $6 trillion.
- $1 million, as Cathy Wood foolishly claims, would require Bitcoin’s market cap to exceed $20 trillion—more than the entire GDP of the United States.
- The idea that Bitcoin will magically absorb trillions in global wealth is pure delusion.
Now, let’s put this into perspective:
- Bitcoin reaching $100K was relatively easy because it required a market cap of just $2 trillion—a fraction of global liquidity.
- But pushing Bitcoin to $300K or beyond requires trillions more, which is mathematically impossible without a massive influx of new capital—capital that simply does not exist.
Your $100K to $1M Fantasy—Let’s Run the Numbers
- Some Bitcoin holders believe their sub-$100K investment will make them multimillionaires.
That's a lie and delusional:
- If you bought 100k worth of Bitcoin at 83K per BTC, it would need to hit $830K per coin for you to even reach $1M.
- That’s not financial genius—it’s blind faith in an impossible scenario.
You’re Living in "The Matrix" of Crypto Lies
- You’re not stacking wealth—you’re stacking HOPIUM.
State Adoption Won’t Skyrocket the Price
- Even if six U.S. states were considering Bitcoin treasuries, those purchases would be OTC (over-the-counter)—meaning they wouldn’t significantly impact market price.
- Governments negotiate deals strategically; they don’t flood markets like retail investors hoping for price surges.
The End of Bitcoin’s Accumulation Phase
Bitcoin’s early adopters—the billionaires who pumped it up—have already made their money. The accumulation phase is over.
- To push Bitcoin higher, these whales would need to inject substantial amounts of new capital—but they are overleveraged and drowning in debt.
- Borrowed money must be repaid, and we're already past Bitcoin’s peak mainstream adoption which means there are no new waves of buyers to sustain the illusion.
- Bitcoin is now entering a distribution phase, where early holders cash out, leaving retail investors holding the bag.
The Rise of ETFs and Real Investments
The world is moving on. Investors are waking up to the fact that:
- ETFs offer real projects with actual purpose, unlike Bitcoin.
- ETFs pay dividends, generate revenue, and contribute to real economic growth.
- Newer crypto projects—like Stamps, art collections, gaming tokens, and smart contracts—are gaining traction and pulling capital away from Bitcoin.
Bitcoiners will get left behind, holding worthless, declining bags of old-school crypto, while the future thrives in better technologies.
The Harsh Reality: Bitcoin’s Future Is Bleeding Out
Bitcoin isn’t the future—it’s a fading illusion.
- The crypto cartel thrives on believers, feeding them fantasy while they cash out.
- The idea that Bitcoin will replace fiat, become the global payment rail, and make every holder rich is a marketing illusion designed to keep people holding bags.
- The longer people ignore reality, the harder the crash will be for them.
Many think they’re ahead of the curve, but they’re just loyal believers in an unsustainable illusion. When this unravels, it won’t be Bitcoin’s future collapsing—it will be theirs.

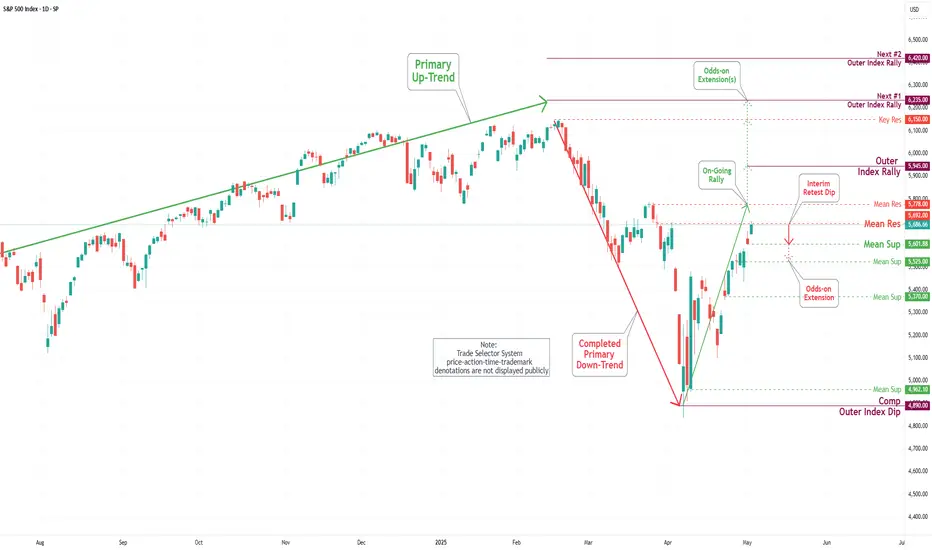
S&P 500 Daily Chart Analysis For Week of May 2, 2025Technical Analysis and Outlook:
During this week's trading session, the Index demonstrated a steady to higher price movement, achieving a key target at the Outer Index Rally level of 5550 and successfully surpassing the Mean Resistance level of 5672. This trajectory establishes the foundation for sustained upward momentum as it approaches the Mean Resistance level of 5778 and sets sights on reaching the next Outer Index Rally target marked at 5945. However, it is essential to acknowledge the substantial risk of a sharp retracement from the current price level to the Mean Support level of 5601, with the potential for further decline to the Mean Support level of 5525.
S&P 500 records 9 days of gains, longest streak in 20 years🚨S&P 500 records 9th consecutive day of gains, the longest winning streak in over 20 years..
🚨
MartyBoots here , I have been trading for 17 years and sharing my thoughts on ETH here.
SP:SPX
Watch video for more details

SPY WEEKLY 2ND MAY 2025Welcome to Spy weekly. I have clearly discussed the price action. If you have any doubts, feel free to leave a comment or DM me.
NOTE:DO NOT SHORT

SPY/QQQ Plan Your Trade For 5-2-25 : Major CRUSH PatternToday's pattern is a Major CRUSH pattern in Counter-Trend mode. These types of patterns (CRUSH patterns) are usually very large range bars that move against the current price trend. A Counter-trend Major CRUSH pattern would likely be a huge bar that moves counter to a counter-trend - thus potentially BULLISH.
Today, I have my reservations related to how this Major Crush pattern will setup. As I stated in my video, yesterday's price bar setup an Island type of bar (in an Evening formation) which is very typical of a topping pattern.
Today, I'm expecting the markets to sell downward into the Major CRUSH pattern. I believe the move of my MRM system into Bullish Trending yesterday sets up a perfect opportunity for the markets to shake out the longs on a big CRUSH pattern today.
But, I've also highlighted bullish breakaway levels on the SPY/QQQ chart for traders to be prepared for any outcome today.
In short, I believe the May 2-5 Major Bottom aligns with this Major CRUSH pattern as a downward price trend today. But, I'll be prepared to take my lumps if I'm wrong and the markets rally straight upward.
Over the past few days, we've seen some interesting developments in China and other places. I do not believe the US market is immune from the global slowdown which is taking place right now. Therefore, I urge traders to continue to stay protected from risks and to keep allocation levels rather small.
It may seem like a fantastic time to throw out some big trades - but it is still very dangerous in this extreme volatility.
I see Gold and Silver trying to base/bottom near recent lows over the next 5+ days. I still believe Gold will be trading at or near $4100 before the end of May.
Bitcoin seems to have followed the SPY/QQQ upward since April 21. I believe this is pure speculation. I'm still very cautious of a breakdown in the markets right now.
Let's see how this Major CRUSH pattern plays out.
It should be interesting - one way or the other (again, I'm still leaning toward a BEARISH breakdown in price today).
Get some...
#trading #research #investing #tradingalgos #tradingsignals #cycles #fibonacci #elliotwave #modelingsystems #stocks #bitcoin #btcusd #cryptos #spy #gold #nq #investing #trading #spytrading #spymarket #tradingmarket #stockmarket #silver

S&P500 INTRADAY ahead of NFP, resistance at 5670The bulls are firmly in control as the S&P 500 heads for its ninth straight daily gain—the longest winning streak since 2004. Optimism is fuelled by:
Expectations of Fed rate cuts due to soft economic data
Hopes for renewed US-China trade talks, easing geopolitical risk
Strong risk appetite, with Bitcoin nearing $100,000 and equity momentum building
Key Risk Today – US Jobs Report:
April Nonfarm Payrolls expected at +138K, down from March’s strong beat
This is the first major labor data since new US tariffs, and could shift market expectations for Fed policy
Conclusion for S&P 500 Traders:
Momentum is bullish, but today’s NFP report is a key risk event. A weaker-than-expected jobs number could reinforce rate cut bets and extend the rally. A surprise beat may trigger profit-taking.
Key Support and Resistance Levels
Resistance Level 1: 5670
Resistance Level 2: 5740
Resistance Level 3: 5820
Support Level 1: 5440
Support Level 2: 5385
Support Level 3: 5316
This communication is for informational purposes only and should not be viewed as any form of recommendation as to a particular course of action or as investment advice. It is not intended as an offer or solicitation for the purchase or sale of any financial instrument or as an official confirmation of any transaction. Opinions, estimates and assumptions expressed herein are made as of the date of this communication and are subject to change without notice. This communication has been prepared based upon information, including market prices, data and other information, believed to be reliable; however, Trade Nation does not warrant its completeness or accuracy. All market prices and market data contained in or attached to this communication are indicative and subject to change without notice.

US500 Reversal Zone? My Thought Process Explained 🎯 📉 Earlier today I posted an analysis on the US500, highlighting how price has traded into a weekly bearish order block 🧱 — a key distribution zone where I believe smart money could look to unwind positions. The market is currently overextended and sitting at a premium, which raises the risk of a potential aggressive retrace 🔄, especially heading into the weekend. ⚠️
💭 Here's a video where I break down that exact setup and walk you through my full thought process, including why I’m exercising extreme caution at these levels and what I’m looking for in terms of confirmation.
📚 As always, this is for educational purposes only — not financial advice. 🚫💼

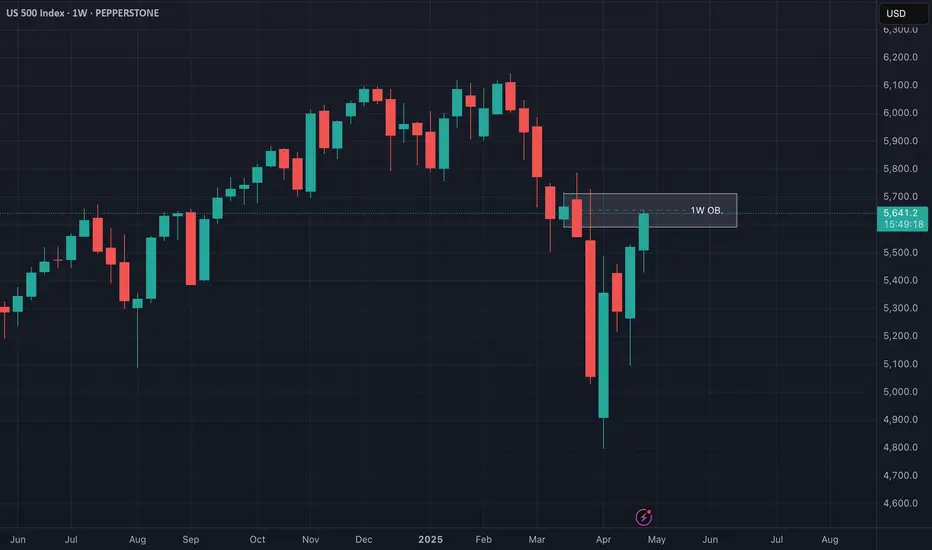
US500 at Critical Resistance - Weekly Chart Breakdown📊 US500 Weekly Chart Analysis
Taking a close look at the US500 on the weekly timeframe, we can see price has now traded directly into a bearish weekly order block 🧱 — a key distribution zone where smart money activity often emerges. At this level, the market is trading at a premium 💰 and appears to be overextended 📈.
⚠️ From a risk management standpoint, I’d advise extreme caution — the current conditions could set the stage for a sharp retracement, especially as we approach week’s end. This level aligns with areas where institutional players may look to offload risk or reverse exposure.
🔁 A potential pullback from here would not be surprising, given the elevated context and technical structure.
📚 This breakdown is for educational purposes only and should not be considered financial advice.
SPY/QQQ Plan Your Trade Update : Behind The Scenes ResearchI want to say thank you to all of you and to share with you all the work/resources/servers/and other data I maintain to help me identify where and how the markets will present opportunities to all of us.
This video shows you a bit of the behind-the-scenes work I do and some of my proprietary modeling systems.
I'm not sharing this with you to try to win you over or to tell you I do more than anyone else in terms of research. I'm sure there are many others who go much further than I do in terms of trying to dissect the markets and the opportunities available.
But I do believe I deliver very unique research, which is a one-of-a-kind solution for traders.
Again, I'm not 100% accurate (I wish I were).
But I am trying to share some of the decision-making solutions I use to understand where the markets are likely to move over the next 2- 4+ months and how traders can profit from my research.
Remember, you are only seeing about 10% of my total research, tools, modeling systems, and capabilities in these Plan Your Trade videos.
I want to thank all of you who continue to value my work. It is not easy. It takes money, time, and resources to continue to monitor all of these systems/algos.
The end result, I believe, is one of the most unique future/current modeling system resources you can find anywhere.
Again, thank you for making my research a success. I promise to do more and improve my tools over the next 12+ months for everyone to find better profits.
Get some.
#trading #research #investing #tradingalgos #tradingsignals #cycles #fibonacci #elliotwave #modelingsystems #stocks #bitcoin #btcusd #cryptos #spy #gold #nq #investing #trading #spytrading #spymarket #tradingmarket #stockmarket #silver
