SPY/QQQ Plan Your Trade For 4-15 : BLANK pattern day.As I stated in this video, last night I looked through the data and could not find any reference for this pattern going back more than 11 years. Same thing for tomorrow's pattern.
That means these are very RARE pattern setups and we'll have to watch to see how price action plays out today.
If there were no reference points over 11+ years of Daily price data (more than 2500 Daily Price Bars), then this is something very unique.
I believe today will act like a Reversal Bar. Potentially rallying off a lower opening price and setting up a type of Gap Lower Rally type of pattern - but that is just a guess.
At this point, trade smaller quantities until we see how price reacts this morning.
Gold and Silver make a BIG MOVE overnight - breaking above the $3300/$33 levels I suggested were critical psychological levels.
This is an INCREDIBLE rally in metals (thanks, China).
At this point, if you were long metals like I was, you can thank me all you want.
Be aware that metals will likely pause a bit above this psychological level, then start to move higher again.
The next big target is $3600-$3750 for Gold.
Bitcoin is doing exactly what I stated it would do - rolling into a top as demand for BTCUSD wanes. I believe the next low for BTCUSD will be closer to $60k-$63k. Pay attention.
Going to be a good day for everyone holding Gold/Silver/Miners CALLS (like I kept suggesting).
GOT SOME.
#trading #research #investing #tradingalgos #tradingsignals #cycles #fibonacci #elliotwave #modelingsystems #stocks #bitcoin #btcusd #cryptos #spy #gold #nq #investing #trading #spytrading #spymarket #tradingmarket #stockmarket #silver
S&P 500 (SPX500)

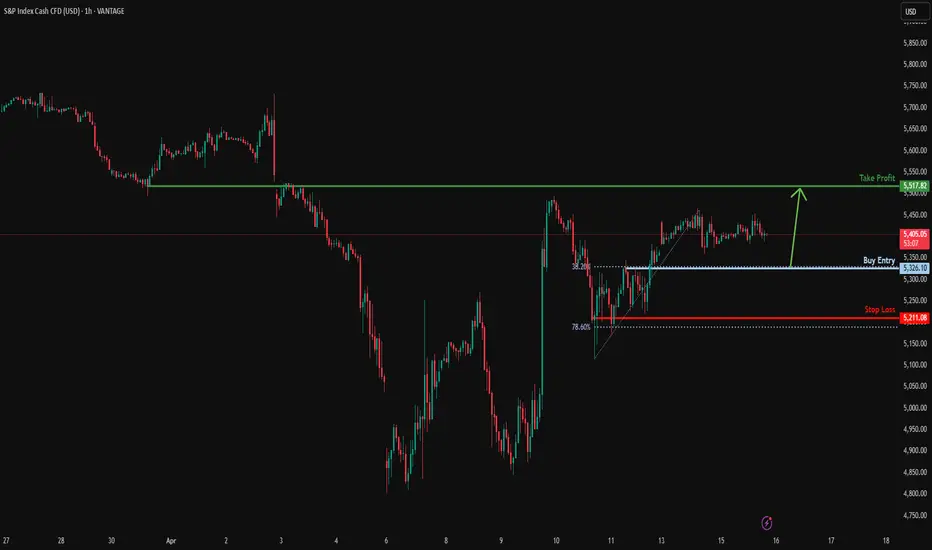
Bullish bounce off pullback support?S&P500 is falling towards the support level which is a pullback support that lines up with the 38.2% Fibonacci retracement and could bounce from this level to our take profit.
Entry: 5,326.10
Why we like it:
There is a pullback support level that aligns with the 38.2% Fibonacci retracement.
Stop loss: 5,211.08
Why we like it:
There is a pullback support level that lines up with the 78.6% Fibonacci retracement.
Take profit: 5,517.82
Why we like it:
There is an overlap resistance level.
Enjoying your TradingView experience? Review us!
Please be advised that the information presented on TradingView is provided to Vantage (‘Vantage Global Limited’, ‘we’) by a third-party provider (‘Everest Fortune Group’). Please be reminded that you are solely responsible for the trading decisions on your account. There is a very high degree of risk involved in trading. Any information and/or content is intended entirely for research, educational and informational purposes only and does not constitute investment or consultation advice or investment strategy. The information is not tailored to the investment needs of any specific person and therefore does not involve a consideration of any of the investment objectives, financial situation or needs of any viewer that may receive it. Kindly also note that past performance is not a reliable indicator of future results. Actual results may differ materially from those anticipated in forward-looking or past performance statements. We assume no liability as to the accuracy or completeness of any of the information and/or content provided herein and the Company cannot be held responsible for any omission, mistake nor for any loss or damage including without limitation to any loss of profit which may arise from reliance on any information supplied by Everest Fortune Group.
Daily Price Action: Futures S&P500 Emini ES1! Tuesday 4/15/2025 In this video, we are looking into the potential daily price action of ES1!.

Daily Price Action: S&p500 SPX Tuesday 4/15/2025 In this video, we are looking into the potential daily price action of SPX.

Caution on Crypto, Tech, SPXI know its a mess, this is just for me anyway.
I tend to overcomplicate things so now then, lets over simplify for my monkey brain:
Trend line broken = Warning, thing are likely to change ( even though you didnt get the bull market you wanted)
Watch said trend retest, look for weakness, struggling price action
selling on the retest of the top lows last time would offer you 5% off the peako top, (Thats really good!! stop being a perfectionist)
I am very much frustrated with this market, never got the crazy part I was waiting for. But the lack of euphoria is really not that unreasonable when you think about what has been goin on the past 5 years. Everyone is poorer liquidity has been super tight to curb inflation and we still got NASDAQ:NDX up 150% Coinbase NASDAQ:COIN did a 10x and I still am not happy(likely due to the max pain trade of my life COINBASE:ETHUSD ). I have realized that I have been hoping for another 2018 bull run. It may or may not happen, but I can't expect any market to reflect that in any significant way. Markets are much more dynamic than I give them credit for sometimes. They will rhyme but often in ways you do not expect and will not be made clear until that little bastard hindsight kicks in, showing you how obvious it was.

Bullish??? That was all very sudden, is it over now?The market correction really seamed to be an over reaction. I am hopeful that the worst is behind us, at least for the meantime.
maybe this will be closer to 2018 correction and we just keep grinding higher for the rest of the year. I suppose anything is possible.
-Everyone got way to bearish to quick - Spidey senses going off!
-we never copy and paste last cycle to the next, but people have such a recency bias, sometimes its all they can see ( I may know from experience)
- hopefully bullish

SPY/QQQ Plan Your Trade For 4-15 : Base Rally PatternToday's pattern suggests the SPY/QQQ have been busy forming a BASE and may transition into a moderate rally mode.
I believe this move will prompt the SPY to move above the $550 level, potentially targeting $555-565 over the next 48 hours.
This upward move could be related to news or Q1:2025 earnings.
I don't believe the markets really want to move downward at this time, although I do believe the markets will move into a topping pattern by the end of this week.
Gold and Silver are moving into BLANK pattern day, today. Given the fact that we are between rally patterns and the metals charts show a very clear FLAGGING formation (watch my video), I believe we are moving into a FLAG APEX that will prompt a move above $3300 (for Gold) and $33 (for Silver). It's just a matter of time.
BTCUSD is still struggling in the Consolidation phase. As I keep suggesting, I believe the next move for Bitcoin is to the downside. But, until we break this consolidation phase, price will continue to roll around within the consolidation range.
Remember, we are going to be moving back to more normal volatility. So you need to understand these huge daily ranges are going to vanish over the next 3-5+ days.
Volatility will likely move back to the 1% to 2.5% range very quickly.
Get some..
#trading #research #investing #tradingalgos #tradingsignals #cycles #fibonacci #elliotwave #modelingsystems #stocks #bitcoin #btcusd #cryptos #spy #gold #nq #investing #trading #spytrading #spymarket #tradingmarket #stockmarket #silver

S&P500 INTRADAY sideways consolidationThe Trump administration is moving ahead with tariff plans on semiconductor and pharmaceutical imports, launching Commerce Department probes. In response, China has ordered its airlines to halt new Boeing jet deliveries, escalating trade tensions.
Despite the trade war, markets are getting a lift after Trump suggested a possible pause on auto tariffs and suspended some consumer electronics tariffs.
Japan will meet with the U.S. this week to discuss trade. The talks will test whether close allies like Japan get more favourable treatment.
Earnings in Focus:
Citigroup and Bank of America report today, following a strong quarter for equity trading across the sector.
Johnson & Johnson and United Airlines are also set to report.
Oil Market:
The International Energy Agency has cut its 2024 oil demand forecast due to trade-related slowdowns and sees a potential supply surplus through 2026.
Key Support and Resistance Levels
Resistance Level 1: 5509
Resistance Level 2: 5660
Resistance Level 3: 5787
Support Level 1: 5110
Support Level 2: 4947
Support Level 3: 4816
This communication is for informational purposes only and should not be viewed as any form of recommendation as to a particular course of action or as investment advice. It is not intended as an offer or solicitation for the purchase or sale of any financial instrument or as an official confirmation of any transaction. Opinions, estimates and assumptions expressed herein are made as of the date of this communication and are subject to change without notice. This communication has been prepared based upon information, including market prices, data and other information, believed to be reliable; however, Trade Nation does not warrant its completeness or accuracy. All market prices and market data contained in or attached to this communication are indicative and subject to change without notice.

Market Update - This Stock Market Analysis Aligns With Bitcoin..What if I told you that the stock market’s pattern could actually reveal what’s coming next for Bitcoin—would you stick around and watch the entire video? That’s exactly what I’m diving into here. I didn’t force this analysis to fit; somehow, over the past week, it just lined up this way.
In this video, I break down exactly why the next market move could be more severe than anything we’ve seen in our lifetime—yet it’s not the end of the world. In fact, if approached correctly, this could be the opportunity of a lifetime. The rebound that follows could be massive.
I’ve always had a gut feeling about this, but now the patterns are speaking loud and clear. This is the reason I created AriasWave—and this is exactly where we are right now.
This also aligns with my latest Euro analysis linked below in related ideas.

SPY Resistance coming upVolume and trend analysis showing key levels to watch. But in this market single chart analysis is not enough. I look at Dollar Index, Gold, 10Y Treasury Bonds. All indicate low confidence in USA economy. Unless these improve I will remain bearish even if SPX,SPY breaks to the upside.
But most likely the markets will reverse at max resistance, as the hedge funds who are under liquidity pressure will start selling again

VIX drop before the next ZOOM upWhat we experienced last week was absolutely insane in terms of volatility. The beauty of all of this is that it's still a trend and many of these spikes are quite predictable. We all knew about the days the tariffs that were going to hit, right? Why didn't you get into UVIX when I called this out days in advance. It's fine, you will have another shot! Actually, we're in line for many many more spikes which is the great thing. Volatility is your friend!
I'll be posting weekly and will be giving away a Free trading alert that has been backtested for the last 3 years over the next week. 2025 will be awesome!
Expect VIX to drop a bit more, great to get in on the SVIX and then let's analyze the next trend and take on UVIX on the upside! This is so easy....

S&P 500 off earlier highsThe major US indices have come noticeably off their earlier highs, following the positive start on the back of the weekend news of temporary tariff relief on technology sector.
The fact the indices could break out to test waters above last week's highs, suggests traders have not been convinced that they have had the all-clear just yet. Perhaps volatility will ease a little this week, but with earnings from tech giants to come in the next couple of weeks, on top of all the trade war saga, anything is possible. Traders must remain nimble.
It is all about the 5380 level now on the S&P 500. This is where it found resistance on Friday and now this level could turn into support. But if we break decisively below it again, then this could trigger a big of selling towards the next support at 5272.
However, the near-term trend has turned bullish following the big recovery last week. So, dip-buyers will be lurking. Let's see where we go from here.
In any case, more bullish price action is needed to completely nullify the bearish control. Specifically, the key resistance zone between 5490 to 5550 must give way before the bulls can be confident that we have see a major low last week.
By Fawad Razaqzada, market analyst with FOREX.com

Price Action: S&P500 SPX Monday 4/14/2025In this video, we are looking at the S&P500 Index and its potential movement on the Daily Chart for Monday 4/14/2025.

SPY/QQQ Plan Your Trade For 4-14 : Up-Down-Up PatternToday's pattern suggests the markets will move in a moderate upward price trend.
Although I don't expect anything huge today, I do believe the EPP structures/layers support this upward price move and that we'll see the SPY attempt to move back towards/above 550 over time.
The QQQ will likely follow the SPY higher over the next 5+ days.
Don't get too excited about this upward price move because it is structurally moving to setup a PEAK that will transition into a downtrend near April 22-25. This peak will create a downward price flag (a new inverted EPP) structure that will assist in developing a new sideways price structure carrying into June/July.
In other words, it looks like we are trapped between 480-585 on the SPY, and we will likely stay within that wide consolidation range for another 2-3 months.
Gold should attempt to rally this week, trying to break above $3300. I believe this is a critical level for Gold and also presents a breakaway level for Silver near $33.00
Bitcoin has moved into APEX VOLATILITY and will continue to trap BUYERS into believing BTCUSD is breaking away from the consolidation range. This is a BULL TRAP.
I believe BTCUSD will ROLL OVER within about 4-5 days - setting up a big breakdown move as the SPY/QQQ also roll downward in about 5+ days.
We still continue to see volatility and sideways price action. Still lots of opportunities for skilled traders.
Get Some..
#trading #research #investing #tradingalgos #tradingsignals #cycles #fibonacci #elliotwave #modelingsystems #stocks #bitcoin #btcusd #cryptos #spy #gold #nq #investing #trading #spytrading #spymarket #tradingmarket #stockmarket #silver

S&P500 INTRADAY oversold bounce backMarkets Overview – Monday US Open
Trump Tariffs: Trump says tariffs on phones, computers, and other consumer tech are still on the table, calling the weekend exemption just a "procedural step."
Tech Rally: Despite that, tech stocks are up Apple and Nvidia leading on hopes the delay gives room for a better long-term trade deal.
Futures & Gold: US equity futures are pointing higher. Gold hit a new record as investors seek safe-haven assets.
FX Moves: The dollar is down for a fifth straight day, with the euro is surging, it is thefastest rally vs USD in 15 yearsas, traders eye a move toward $1.20.
Earnings Outlook:
Q1 earnings season kicks into gear this week.
Citigroup and Morgan Stanley lowered their S&P 500 earnings forecasts, citing tariff concerns and broader economic headwinds.
Key Support and Resistance Levels
Resistance Level 1: 5509
Resistance Level 2: 5660
Resistance Level 3: 5787
Support Level 1: 5110
Support Level 2: 4947
Support Level 3: 4816
This communication is for informational purposes only and should not be viewed as any form of recommendation as to a particular course of action or as investment advice. It is not intended as an offer or solicitation for the purchase or sale of any financial instrument or as an official confirmation of any transaction. Opinions, estimates and assumptions expressed herein are made as of the date of this communication and are subject to change without notice. This communication has been prepared based upon information, including market prices, data and other information, believed to be reliable; however, Trade Nation does not warrant its completeness or accuracy. All market prices and market data contained in or attached to this communication are indicative and subject to change without notice.

SPY LONG SET UP(BUY THE DIP)Entry 1 $500.00
Entry 2 $460.00
Stop loss $440.00
Take profit 1- $550.00
(Close 25%)
Take profit 2- $600.00
(Close 50%)
Take profit 3-$650.00
(Close 75%)
Take profit 4-$700.00
(Close 100%)

SPX sharp moves begin arround monthly option expiryWatch out for the this weeks options expiry on Thursday (Friday being holiday)
During volatile time option expiry does produce sharp moves. They are not that significant during normal markets. Also key levels approaching. Monday after Easter, I am expecting the new move to happen. Breakdown or breakout.
I am sure the big boys are aware from the social media that everyone is expecting a reversal and they will set up a trap. They will make us thing we are wrong create a FOMO to the upside and then sell
A volume drop could indicate a big move

Weekly Market Forecast: Stocks Markets Could Push Higher!In this video, we will analyze the S&P 500, NASDAQ, and DOW JONES futures for the week of April 14-18th.
The Stock Market Indices ended a turbulent week on a bullish note, and next week could see some continuation. The markets have peeked above the consolidation, and could be on the way to resume the overall bullish trend.
Wait for confirmations of the trend before jumping in! One bad report of tariffs or geo-political news can turn the markets down at any time.
Enjoy!
May profits be upon you.
Leave any questions or comments in the comment section.
I appreciate any feedback from my viewers!
Like and/or subscribe if you want more accurate analysis.
Thank you so much!
Disclaimer:
I do not provide personal investment advice and I am not a qualified licensed investment advisor.
All information found here, including any ideas, opinions, views, predictions, forecasts, commentaries, suggestions, expressed or implied herein, are for informational, entertainment or educational purposes only and should not be construed as personal investment advice. While the information provided is believed to be accurate, it may include errors or inaccuracies.
I will not and cannot be held liable for any actions you take as a result of anything you read here.
Conduct your own due diligence, or consult a licensed financial advisor or broker before making any and all investment decisions. Any investments, trades, speculations, or decisions made on the basis of any information found on this channel, expressed or implied herein, are committed at your own risk, financial or otherwise.

$DXY to 100 and heading lower, bullish for $EURUSDTVC:DXY the dollar index, was the primary driver of the equity bear market in 2022. With TVC:DXY hitting a 5 year high of 114 marked the bottom in AMEX:SPY and $QQQ. The recent strength in TVC:DXY was out of stock with TVC:DXY and Stock markets rising at the same time and dropping when the TVC:DXY is falling. Usually, the risk assets have an inverse correlation to the US Dollar index. These periods in history are unusual and are marked by some kind of macro events like recession etc. With tariffs discussion everywhere that might not be unrealistic to expect some kind of recession.
In that case where is the TVC:DXY headed? Currently the TVC:DXY is at a psychological level of 100. Once it breaks below 100 the next stop might be 95. If we see some kind of soft recession which is my worst-case scenario then we might see the lows of 90 in $DXY. If TVC:DXY goes down by 10% or lower than we can expect to the FX:EURUSD to go back to its recent high of 1.23.
Verdict: Short TVC:DXY ; Long FX:EURUSD , AMEX:SPY and NASDAQ:QQQ

Potential Target: €6.3 by Mid-May 2025📈 Trading Idea – Potential Target: €6.3 by Mid-May 2025
The idea of a bullish move toward €6.3 is plausible if:
The price continues to hold the support zone within the current range (around €5.0–€5.2).
We see a strong breakout above the top of the consolidation range, ideally with increased volume.
Broader market sentiment or fundamentals support a rebound (news, earnings, etc.).
The €6.3 level aligns with the upper boundary of the sideways range and is a logical first technical target before any deeper trend reversal is confirmed.
⚠️ Risks to Consider:
A breakdown below €5.0 could invalidate the bullish setup and resume the long-term downtrend.
The overall structure remains bearish, so confirmation is key before entering long positions.
Technical Indicators:
Tools like Supertrend and predictive ranges suggest momentum is shifting or at least stabilizing.
The green dynamic trend line could indicate an early sign of a bullish push, though the price is still within the broader range.

SPY/QQQ Plan Your Trade Overview For 4-12 : Thank youThis video is mostly a big thank you for all the great comments and questions over the past few weeks.
I've been posting these videos on TradingView for almost a year and the types of viewers/followers I've been gaining is incredible.
You guys & gals have really impressed me with your questions and engagement. Many of you follow me for months without ever commenting or asking any questions.
I received a call from a client/follower in Alberta last night and he reported last week's gains at over 300% by following my videos.
I received a message from another TV follower saying he's been following my videos for many months and, after a bad loss a few years back, he has decided to give trading another go.
I've stated it before and I'll keep saying it.. I'm not trying to scam you out of anything. I'm trying to show you the RIGHT SKILLS and TECHNIQUES for you to learn to become a better, more skilled trader.
The way I look at it is like this...
If I can teach you half of what I know and see on the charts, then you guys will be able to achieve so much greater success and have gained/retained the knowledge to do it on your own.
You watch me do it over and over on these charts. Guess what - you are LEARNING at the same time.
Now, after a couple of years of doing this and following my videos, you've GAINED an education on how to trade more efficiently, manage risk more efficiently, and achieve your trading goals (I hope).
Right now, I'm getting messages/comments from people saying they are making 200%, 300%, 500%, or more every week or two from my videos.
That is absolutely incredible. I just want to urge you to remember I'm not 100% perfect in predicting the markets. No one EVER really is 100% perfect at it.
In the long run, as long as you don't get super greedy, you'll survive any minor losses and live to trade another day.
That is probably the most important thing I can teach you - trade within a proper scale to your RISK LEVEL. Never BET THE FARM on your trades. Always have a 50% to 70% cash reserve.
Anyway. Thank you. I really appreciate all of you.
Hope you enjoy this video.
#trading #research #investing #tradingalgos #tradingsignals #cycles #fibonacci #elliotwave #modelingsystems #stocks #bitcoin #btcusd #cryptos #spy #gold #nq #investing #trading #spytrading #spymarket #tradingmarket #stockmarket #silver

Long Term TrendlineA long term trend line on the SPX
Great place to buy if you are speculative of the current price movement
Price from this line will most likely move up
If not up from this trend line, very bearish.
Great time within a bear market to buy oversold stock regardless. Just have to HODL.
If bearish HODL .

S&P 500 Daily Chart Analysis For Week of April 11, 2025Technical Analysis and Outlook:
During the current trading session, the Index has recorded lower opening prices, thereby completing our key Outer Index Dip levels at 5026 and 4893, as previously highlighted in last week's Daily Chart analysis. This development establishes a foundation for a continuous upward trend, targeting the Outer Index Rally at 5550, with an interim resistance identified at 5455. Should this upward momentum persist, further extension may reach the subsequent resistance levels of 5672 and 5778, respectively. However, it is essential to note that a downward momentum may occur at the very significant completion target level of the Outer Index Rally at 5550, with the primary objective being a Mean Sup 5140 and retest of the completed Outer Index Dip at 4890.
