"SPX500/US500" Index Market Money Heist Plan (Day / Scalping)🌟Hi! Hola! Ola! Bonjour! Hallo! Marhaba!🌟
Dear Money Makers & Robbers, 🤑 💰💸✈️
Based on 🔥Thief Trading style technical and fundamental analysis🔥, here is our master plan to heist the "SPX500/US500" Index Market. Please adhere to the strategy I've outlined in the chart, which emphasizes long entry. Our aim is to escape near the high-risk Blue MA Zone. Risky level, overbought market, consolidation, trend reversal, trap at the level where traders and bearish robbers are stronger. 🏆💸"Take profit and treat yourself, traders. You deserve it!💪🏆🎉
Entry 📈 : "The heist is on! Wait for the MA breakout (5400) then make your move - Bullish profits await!"
however I advise to Place Buy stop orders above the Moving average (or) Place buy limit orders within a 15 or 30 minute timeframe most recent or swing, low or high level for Pullback entries.
📌I strongly advise you to set an "alert (Alarm)" on your chart so you can see when the breakout entry occurs.
Stop Loss 🛑: "🔊 Yo, listen up! 🗣️ If you're lookin' to get in on a buy stop order, don't even think about settin' that stop loss till after the breakout 🚀. You feel me? Now, if you're smart, you'll place that stop loss where I told you to 📍, but if you're a rebel, you can put it wherever you like 🤪 - just don't say I didn't warn you ⚠️. You're playin' with fire 🔥, and it's your risk, not mine 👊."
📍 Thief SL placed at the recent/swing low level Using the 1H timeframe (5100) Day trade basis.
📍 SL is based on your risk of the trade, lot size and how many multiple orders you have to take.
🏴☠️Target 🎯: 5800 (or) Escape Before the Target
🧲Scalpers, take note 👀 : only scalp on the Long side. If you have a lot of money, you can go straight away; if not, you can join swing traders and carry out the robbery plan. Use trailing SL to safeguard your money 💰.
💰💵💸"SPX500/US500" Index Market Heist Plan (Scalping/Day) is currently experiencing a bullishness,., driven by several key factors. 👇👇👇
📰🗞️Get & Read the Fundamental, Macro, COT Report, Geopolitical and News Analysis, Sentimental Outlook, Intermarket Analysis, Index-Specific Analysis, Positioning and future trend targets & Overall outlook score... go ahead to check 👉👉👉🔗🔗
⚠️Trading Alert : News Releases and Position Management 📰 🗞️ 🚫🚏
As a reminder, news releases can have a significant impact on market prices and volatility. To minimize potential losses and protect your running positions,
we recommend the following:
Avoid taking new trades during news releases
Use trailing stop-loss orders to protect your running positions and lock in profits
💖Supporting our robbery plan 💥Hit the Boost Button💥 will enable us to effortlessly make and steal money 💰💵. Boost the strength of our robbery team. Every day in this market make money with ease by using the Thief Trading Style.🏆💪🤝❤️🎉🚀
I'll see you soon with another heist plan, so stay tuned 🤑🐱👤🤗🤩
S&P 500 (SPX500)

BIG BIG weekI think 7 FED speakers,
A lot of tension in the markets, tops mean polarisation, considering reflexivity theory extreme volatility will ensue.
A lot of people might think the -0.786 ATH we got before the holidays is the top. I think they are mistaken as seen in the analysis below.
There is still legroom for higher, this is a big bet on my part.
I have a few contracts on the mag7 (GOOGL, TSLA and META) focusing on GOOGL since they seem to be in the same headwind as S&P
Let's see how this plays out

SPY/QQQ Plan Your Trade For 4-11 : Break-Away in CarryoverToday's Break-away pattern suggests the SPY/QQQ will attempt to move (break) away from yesterday's Body range. I believe this trend, after the recent Ultimate Low in price, will be to the upside.
I know a lot of people are asking, "why do you think the markets are going to rally now - after you suggested the markets would trend downward?"
Things have changed now that we have a 90-day pause in the tariff wars. Yes, China is still an issue - but the rest of the world seems to have a pause on the tariff wars as negotiations continue.
I believe the removal of the tariff pressure on the markets will result in a moderate upward trend as we move into Q1:2025 earnings season.
Still, I don't believe we will see new ATHs anytime soon. But I do believe the 580+ level on the SPY is a potential high price level that can be reached before the end of April 2025.
Gold and Silver are moving into a GAP trend move today. I believe the GAP will be to the upside and I believe Gold and Silver will continue to rally.
Silver is really low in terms of comparison to Gold. Silver could make a very big move to the upside over the next 30+ days.
BTCUSD is still consolidating into the narrow range I suggested would happen before the bigger breakdown event near the end of April (into early May).
Everything is playing out just as I expected. The big change is the removal of the tariffs for 75+ nations (for now). That will give the markets some room to the upside and we need to understand how price structure is playing out into an A-B-C wave structure.
Get some.
#trading #research #investing #tradingalgos #tradingsignals #cycles #fibonacci #elliotwave #modelingsystems #stocks #bitcoin #btcusd #cryptos #spy #gold #nq #investing #trading #spytrading #spymarket #tradingmarket #stockmarket #silver

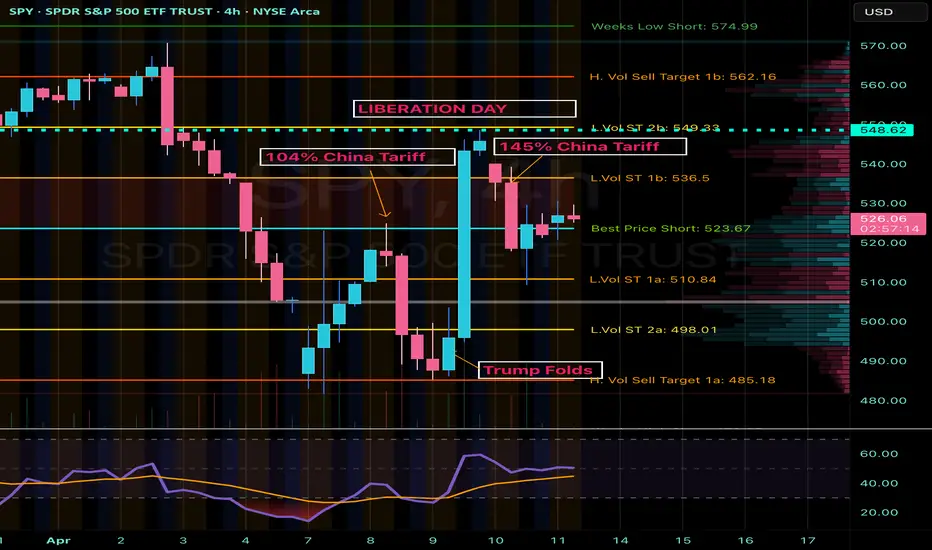
SPY Analysis: Navigating Tariff-Induced VolatilityContinuing from my last update, market volatility remains high due to Trump's unpredictable policy decisions. After initially folding and offering economic relief, Trump pivoted sharply with a sudden 145% tariff announcement. Today, China countered strongly with a 125% tariff. These escalating tariff exchanges continue to create significant uncertainty and market fluctuations, highlighting the critical need for careful analysis and precise trade management.
Technical Breakdown (4-Hour Chart)
Current Price Zone: Around $528.45
Key Resistance Levels:
- Immediate Resistance: $536.50 (L.Vol ST 1b)
- Critical Resistance: $549.33 - $549.60 (L.Vol ST 2b)
- Major Resistance Zone (Liberation Day): Approximately $562.16
Support Levels:
- Initial Support: $523.67 (Best Price Short)
- Secondary Support: $510.84 (L.Vol ST 1a)
- Important Lower Support: $498.01 (L.Vol ST 2a)
- Strong Support Level (Trump Folded area): ~$485.18
Trading Scenarios
Bullish Scenario (Potential Tariff Tension Relief):
- Entry Trigger: Confirmed breakout and sustained hold above resistance at $536.50.
Profit Targets:
- Target 1: $549.33 (next strong resistance level)
- Target 2: $562.16 (major resistance)
- Stop Loss: Below immediate support at $523.67, carefully managing downside risk.
Bearish Scenario (Ongoing Tariff Escalation or Increased Market Fear):
Entry Trigger: Inability to reclaim $536.50, or a decisive breakdown below support at $523.67.
Profit Targets:
- Target 1: $510.84 (nearest significant support)
- Target 2: $498.01 (secondary critical support)
- Target 3: $485.18 (robust support area)
- Stop Loss: Above resistance at $536.50 to protect against potential reversals.
Thought Process & Final Thoughts
The SPY currently trades within clearly defined resistance and support bands, heavily influenced by unpredictable tariff-driven headlines. Trump's volatile policy shifts and China's assertive retaliations amplify short-term market risks. Maintain flexible trading strategies, adhere strictly to established levels, and practice disciplined risk management. Continuous monitoring and swift response to evolving market sentiment will be essential for navigating this challenging environment effectively.
PALANTIR. THE STOCK THAT BEATS S&P 500 INDEX, 11 MONTHS IN A ROWSomewhere in another Galaxy, in late December, 2024 (yet before The Second Coming of Trump), @TradingView asked at it awesome Giveaway: Happy Holidays & Merry Christmas!
1️⃣ What was your best trade this year?
2️⃣ What is your trading goal for 2025?
Here's what we answered:
1️⃣ What was your best trade this year?
- Surely Palantir NASDAQ:PLTR 💖
I followed Palantir all the year since January, 2024, from $16 per share, watch here.
Current result is 5X, to $80 per share.
Also I added more Palantir after SP500 Index inclusion in September 2024 watch here.
Current result is 2.6X, from $30 to $80 per share.
2️⃣ What is your trading goal for 2025?
- Once again, surely Palantir NASDAQ:PLTR 💖
It's gone three months and a half or so... (Duh..? Haha.. 3 months, really? 😸😸😸)
Let see what's happened next at the main graph PLTR/SPX
First of all, let me explain in a few words what does this graph mean.
Rising (Blue) candle means Palantir NASDAQ:PLTR monthly return is better vs SP:SPX
Falling (Red) candle means Palantir NASDAQ:PLTR monthly return is worse then SP:SPX
Conclusion
👌 PALANTIR. THE STOCK THAT OUTPERFORMS S&P 500, 11 MONTHS IN A ROW.
👌 WERE WE RIGHT ON CONTEST AND WON IT? EXACTLY!
--
Best wishes,
Your Beloved @PandorraResearch Team 😎

$S&P500 macro analysis , market approaching correction °•° $SPXHi 👋🏻 check out my previous analysis ⏰ on SP:SPX macro bullish analysis ⏰
As provided it went up up 🚀 completed my target's 🎯 💯💪🏻 ✅ ✔️
Click on it 👆🏻 just check out each and every time updates ☝🏻 ☺️
•••••••••••••••••••••••••••••••••••••••••••••••••••••••••••••••••••••••••••••••••••••••••
NOW I was completely 🐻 BEARISH on the market with in upcoming months SP:SPX
📌 Expecting liquidation pump $6500 - $6700
Invalid 🛑 when complete month close above $6700
¹support - $5500 ( 🎯 ¹ )
²support - $5130 ( 🎯 ² )
🎯 3 ... Will be updated based on market conditions by that time ☺️
📍 A wise 🦉 man said - always having patience " is " always gaining only /-
NASDAQ:TSLA ( i accumulate slowly until it cross above $400 )
rest of stocks i will follow index ☝🏻 i will invest based on market conditions ..... ✔️

"When the VIX is low, look out below!""When the VIX is low, look out below!"
+
FEDs motto "Higher for longer"
=
Fed rate hikes to go: 2-3 left
it is pivot time, change of market dynamic from "bad news is good news" to "bad news is bad news".
state of economy is not good and it will start sinking in to investors and public

Warning: what can save us from a collapse: must read.⚠️This analysis isn’t purely chart-based, but in this macro environment, understanding the bigger picture is essential for predicting market movements. Hopefully, TradingView will allow this idea so that everyone can read it.
What Can Save Us?
Before looking for a solution, we must first acknowledge the problem—and then determine if and when a resolution is coming.
1. Trump’s Tariffs & Policies: A Market Shock
Trump’s economic strategy marks a radical departure from the policies of the past 30 years. However, previous administrations weakened U.S. global influence, shifting power in favor of China.
Since Trump's motto is "Make America Great Again", serious changes are inevitable. Until investors fully grasp these policies, uncertainty will persist.
Let’s break down the key areas of impact and Trump’s expected responses:
2.Monetary Policy & The Federal Reserve
The Federal Reserve (FED) and Jerome Powell are not aligned with the White House.
Powell is sticking to his monetary policy approach, but Trump needs 0% interest rates to implement his vision.
Markets hate uncertainty, and this is fueling volatility.
🔴 Trump's Response:
Expect a bombshell move—Trump will fire Jerome Powell and replace him with a Fed chairman who supports rate cuts to 0%. This will cause short-term chaos but ultimately fuel a massive market rally as:
✔️ The housing market recovers
✔️ Liquidity surges
✔️ Stocks skyrocket
3.U.S. Dependence on China & Russia for Raw Materials
The U.S. imports essential resources from China and Russia, making it vulnerable.
The BRICS alliance is strengthening, further threatening U.S. dominance.
🔴 Trump's Response:
Trump has openly expressed interest in acquiring Greenland, citing its rich natural resources. He will take it by military force if necessary, positioning the U.S. as a raw material powerhouse on par with Russia.
4.Lost Allies: Canada, Mexico & South America
Canada is aligning with Europe
Mexico & South America are leaning towards BRICS
🔴 Trump's Response:
To counter this:
Canada will be pressured into rejoining a U.S.-led trade bloc—or face potential annexation.
South American economies will be crippled by tariffs, forcing them to reintegrate under U.S. influence.
5.Geopolitical Conflicts: Middle East & Ukraine
Iran is aligned with Russia & China
Ukraine relies on Europe (France, UK, EU), rather than the U.S.
The U.S. is not benefiting from these wars
🔴 Trump's Response:
If Zelensky continues to align with Europe, Trump may order a full-scale U.S. bombing of Ukraine, flatten Kyiv, eliminate Zelensky live on TikTok, and then split Ukraine with Russia.
This move would:
✔️ Strengthen U.S.-Russia relations
✔️ Secure a deal on Greenland
✔️ Humble Europe
6.Conclusion: A Global Power Shift
Expect a period of chaos and fear. However, what investors must understand is that Trump is 100% serious about these moves—and he will execute them regardless of global opinion.
If Trump’s strategy works:
✅ The U.S. will regain dominance
✅ Markets will rally hard
✅ Confidence in the U.S. economy will be restored
If Trump fails:
🚨 A prolonged economic downturn (15-20 years of stagflation)
🚨 U.S. & Europe suffer major losses
🚨 Best move? Relocate to Asia or the Middle East before the crash.
So, even if Trump’s policies seem insane, the best-case scenario is that he succeeds.
💡 DYOR (Do Your Own Research)
#Bitcoin #Crypto #Trump #MAGA #Geopolitics #StockMarket #SPX500 #Trading #Investing #Economy #FederalReserve #RateCuts

SPY PRICE ACTION 10TH APRIL2025Spy further price action is here. I have discussed all the potential buying levels and do not go long at current price as we are into a supply zone.
Feel free to leave a comment
NOTE:WAIT AS WE ARE INTO A SUPPLY

SPY/QQQ Plan Your Trade For 4-10 : FLAT-DOWN PatternToday's Flat-Down Pattern suggests the SPY/QQQ will struggle to move away from yesterday's big open-close range.
Normally, I would suggest the Flat-Down pattern will be a small, somewhat FLAT price move.
But, after yesterday's big move, the Flat-Down pattern can really be anywhere within yesterday's Daily Body range.
So, we could see very wild volatility today. That means we need to be prepared for general price consolidation (which suggests somewhat sideways price trending) and be prepared for some potential BIG price trends within that consolidation.
These BIG price trends would be more like bursts of trending, while still staying somewhat consolidated overall.
Watch today's video to learn how the Excess Phase Peak pattern is dominating the trend right now (in the Consolidation Phase).
The same thing is happening in BTCUSD. BTCUSD has been in an EPP Consolidation phase for over 35+ days now.
Gold and Silver are setting up a CRUSH pattern today. That could be a VERY BIG move higher (or downward). Given my analysis of Gold acting like a hedge (a proper hedge for global risk levels), I believe today's move will EXPLODE higher.
Gold is already in an early-stage parabolic bullish price trend. When gold explodes above $3500, I believe it will quickly gain momentum towards the $5100 level.
Right now, Gold is recovering from the Tariff news and about to explode upward (above $3200) if we see this CRUSH pattern play out well.
Thank you again for all the great compliments. I'm just trying to share my knowledge and skills with all of you before I die. There is no need to carry all of this great information and technology to my grave.
So, follow along, ask questions, learn, and PROFIT while I keep doing this.
Get some.
#trading #research #investing #tradingalgos #tradingsignals #cycles #fibonacci #elliotwave #modelingsystems #stocks #bitcoin #btcusd #cryptos #spy #gold #nq #investing #trading #spytrading #spymarket #tradingmarket #stockmarket #silver

S&P INTRADAY oversold bounce backUS stock futures dropped and the dollar weakened as concerns grew that the trade war could cause lasting economic damage. This came despite a surge in European and Asian equities, which followed a major rally on Wall Street after President Trump unexpectedly paused most of his tariffs. The move lifted global risk sentiment temporarily, but also isolated China as the primary target of Trump’s trade offensive, limiting Beijing’s options for near-term de-escalation. In response, Chinese leaders are meeting today to consider additional economic stimulus.
Meanwhile, U.S. Treasuries gained as investors sought safety following a volatile session. The Federal Reserve, for its part, signalled it plans to keep interest rates steady, aiming to prevent tariff-driven inflation even if the labour market weakens. Officials have publicly downplayed the need for rate cuts, choosing to prioritize stability over pre-emptive easing.
Key Support and Resistance Levels
Resistance Level 1: 5509
Resistance Level 2: 5660
Resistance Level 3: 5787
Support Level 1: 4815
Support Level 2: 4700
Support Level 3: 4585
This communication is for informational purposes only and should not be viewed as any form of recommendation as to a particular course of action or as investment advice. It is not intended as an offer or solicitation for the purchase or sale of any financial instrument or as an official confirmation of any transaction. Opinions, estimates and assumptions expressed herein are made as of the date of this communication and are subject to change without notice. This communication has been prepared based upon information, including market prices, data and other information, believed to be reliable; however, Trade Nation does not warrant its completeness or accuracy. All market prices and market data contained in or attached to this communication are indicative and subject to change without notice.

SPX resistance is clear for the dayIntraday Update: The SPX stalled at previous (flag) support at the 5500 level as noted in the end of day analysis. The "line in the sand" has been drawn intraday for the session now.
A break above this level would continue yesterday's epic squeeze

US500 Historical Rallies & Pullbacks with a Potential ProjectionI’ve observed the US500’s performance over the years, marking rallies with a blue line and pullbacks with a yellow line. Looking at the chart, a systematic repetition of these movements emerges, which, at first glance, seems to follow a recognizable pattern.
Specifically, I’ve cloned the blue line from the rally that started on 03/23/2020 and ended on 12/20/2021, now represented by a green line, to hypothesize a potential future rally. This clone is based on the duration of previous pullbacks:
The first pullback, before the 2020 rally, began on 02/20/2020 and ended on 03/23/2020.
The second pullback, the current one, started on 02/17/2025 and might conclude around 04/07/2025, potentially paving the way for a new rally.
the angle of those pullbacks is almost identic
This "snapshot" observation suggests we could be nearing a turning point. Of course, this is just a hypothesis based on historical patterns, and I encourage cross-referencing it with other indicators or analyses. What are your thoughts?

Correction has begun in SPXWe can almost say that 4800 has been touched and given that the downward movement was very fast, this wave is most likely the A-wave of a triangle and the upward waves that are forming after the 90-day suspension of the stalls are considered as a corrective wave.
Previous SPX Analysis

Trump's Second Term Brings Sharpest Market Decline Since 2001It's gone nearly three months or so... (Duh..? WTF.. less than 3 months, really? 🙀) since Donald Trump entered The White House (again).
Those times everyone was on a rush, chatting endless "Blah-Blah-Blah", "I-crypto-czar", "crypto-capital-of-the-world", "we-robot", "mambo-jumbo", "super-duper", AI, VR and so on super hyped bullsh#t.
What's happened next? We all know.. mostly all US stocks and crypto markets turned to 'a Bearish Mode', or to at least to 'a Correction' (that is still actual at this time).
Here's a short educational breakdown for Nasdaq Composite index NASDAQ:IXIC what we think about all of that, at our beloved 💖 @PandorraResearch Team.
Trump's Second Term Brings Sharpest Market Decline Since 2001: Analyzing the recent 15% Stock Market Plunge
President Donald Trump's second term has coincided with a dramatic stock market downturn, with the S&P 500 losing approximately 15% of its value since his January 2025 inauguration. This represents the worst start to a presidential term since George W. Bush in 2001 during the dot-com crash. The decline has erased more than $3 trillion in market value, driven primarily by concerns over trade policies, particularly the implementation of new tariffs.
Market analysts point to growing fears of potential stagflation—a toxic combination of slow economic growth and high inflation—as investor confidence continues to deteriorate despite pre-election expectations of business-friendly policies.
Unprecedented Market Decline Under the New Administration
Historical Context of Presidential Market Performance
The current market downturn stands out in stark relief when compared to previous presidential transitions. The S&P 500 has fallen nearly 10% in the first 10 weeks since Trump's inauguration on January 20, 2025, marking the worst start under a new president since George W. Bush in 2001. This decline is significantly worse than the start of the prior five administrations, with Bush's roughly 18% drop during the dot-com crash being the only steeper decline in recent presidential history. Looking further back, only Richard Nixon experienced a comparable early-term market decline with a 7.2% drop, highlighting the severity of the current situation.
When examining presidential market performance metrics, Trump's second term has already distinguished itself negatively. During the first 50 days, the S&P 500 declined by 6.4%, positioning it among the poorest market starts since 1950. By contrast, the best 50-day starts were achieved by John F. Kennedy (up 9.4%), Barack Obama (up 5.7%), and Bill Clinton (up 4.2%), demonstrating how unusual the current market trajectory is in historical context.
Magnitude of the Current Decline
The scale of market value destruction has been substantial. More than $3 trillion has been erased from the S&P 500's value over approximately 52 trading sessions since Trump's inauguration. By early April 2025, the decline had accelerated to approximately 15% from Inauguration Day, pushing the market dangerously close to bear territory. Market analysts note that if the S&P 500 reaches a 20% decline from its recent peak, it would mark the earliest instance of a bear market during a new administration based on S&P 500 history since 1957.
The tech-heavy Nasdaq Composite has suffered even more severely, with declines exceeding 11% by mid-March. This demonstrates the particular vulnerability of growth stocks that had previously led market gains, now facing the most significant corrections.
Key Factors Driving the Market Downturn
Trade Policy Uncertainty and Tariff Concerns
Trade policy, particularly the implementation and threat of tariffs, has emerged as the primary catalyst for market turmoil. The unpredictable nature of these policies has created significant uncertainty for businesses, investors, and consumers alike. Trump's "on-again, off-again approach to tariffs" has effectively extinguished the optimism that initially buoyed markets following his election victory in November 2024.
The market decline accelerated dramatically after what was termed the "Liberation Day" event, during which Trump announced plans for unprecedented tariff escalation. Two-thirds of the S&P 500's 15% decline occurred after this announcement, prompting Ed Yardeni of Yardeni Research to observe that "Liberation Day has been succeeded by Annihilation Days in the stock market".
Fear of Stagflation and Economic Instability
Many economists have warned that the new tariffs could reaccelerate inflation at a time when economic growth may be slowing, creating conditions for stagflation. This combination is particularly concerning for investors, as it creates a challenging environment for corporate profitability and economic prosperity. The risk that tariffs could trigger this economic condition has effectively neutralized investor optimism regarding other aspects of Trump's agenda, including potential regulatory reforms and tax reductions.
Shift in Market Sentiment
The market has undergone a fundamental transformation in sentiment from the period immediately following Trump's election victory to the current environment. Initially, investors had bid stocks up to record highs, anticipating benefits from tax cuts, deregulation, and business-friendly policies. However, this optimism has been replaced by growing concern about economic direction.
As one market strategist noted, "We have witnessed a significant shift in sentiment. A lot of strategies that previously worked are now failing". The S&P 500 has relinquished all gains made since Trump's November 2024 election victory, representing a striking reversal in market confidence.
Potential Long-Term Implications
Historical Patterns and Future Outlook
Historical analysis suggests that poor market starts during presidential transitions often foreshadow continued challenges. According to SunDial Capital Research strategist Jason Goepfert, rough starts represent a "bad omen" for stocks based on past performance patterns. His analysis indicates that markets typically show a median return of -1.9% six months after such a start, and after a year, they generally remain flat. Among similar historical instances, only four out of ten cases resulted in more gains than losses over the following year.
Administration's Response to Market Decline
Unlike during his first term, when Trump regularly referenced strong stock market performance as evidence of his administration's success, his second-term approach appears markedly different. Some market analysts have noted that "The Trump administration appears to be more accepting of the market's decline, potentially even welcoming a recession to achieve their broader objectives". This shift in attitude has further unsettled investors who previously expected the administration to prioritize market stability.
Technical challenge
The tech-heavy Nasdaq Composite index has recently soared 12% for its best day since January 2001.
But did you know what happened next in 2001? The major upside trend as well as 5-years SMA were shortly broken and market printed extra 40 percent Bearish decline.
Similar with what's happening in 2025..!? Exactly!
Conclusion
Trump's second presidential term has coincided with one of the worst stock market starts in modern American history, comparable only to George W. Bush's entry during the dot-com crash of 2001.
The approximately 15% market decline since inauguration represents a loss of trillions in market value and a complete reversal of the optimism that followed his election. Trade policy uncertainty, particularly regarding tariffs, has emerged as the primary driver of market instability, creating fears of potential stagflation and undermining business confidence.
As historical patterns suggest that poor starts often lead to continued underperformance, investors remain concerned about the market's trajectory through the remainder of 2025 and beyond.
--
Best 'a bad omen' wishes,
Your Beloved @PandorraResearch Team 😎

Trump Delays Tariffs for 90 Days. The S&P 500 Rebounds SharplyTrump Delays Tariffs for 90 Days. The S&P 500 Rebounds Sharply
As shown in the chart of the S&P 500 (US SPX 500 mini on FXOpen), the index is currently trading near the 5,500 level.
This result is highly encouraging, considering that as recently as yesterday morning, the index was hovering around 4,900.
Why Have Stocks Risen?
The strong rebound seen yesterday evening was triggered by a statement from the US President — he announced a 90-day delay in the implementation of wide-ranging global trade tariffs, which had originally been unveiled on 2 April and led to a sharp drop in the index (as indicated by the arrow).
However, this does not apply to China, for which tariffs were not delayed but increased. "Due to the lack of respect China has shown towards global markets, I am raising the tariff imposed on China by the United States of America to 125%, effective immediately," said Donald Trump, according to media reports.
Overall, US stock markets responded positively to the news, and Goldman Sachs economists have withdrawn their US recession forecasts.
Technical Analysis of the S&P 500 Chart (US SPX 500 mini on FXOpen)
Despite yesterday’s sharp rebound, the stock market remains in a downtrend (as indicated by the red channel).
From a bullish perspective:
→ A Double Bottom pattern (A–B) has formed around the 4,900 level;
→ Price has moved into the upper half of the channel.
From a bearish perspective:
→ Bulls must overcome key resistance near the psychological 5,000 level;
→ While tariffs have been delayed, they have not been cancelled. As such, the risk of an escalating trade war is likely to continue putting pressure on the S&P 500 index (US SPX 500 mini on FXOpen) in the coming months.
This article represents the opinion of the Companies operating under the FXOpen brand only. It is not to be construed as an offer, solicitation, or recommendation with respect to products and services provided by the Companies operating under the FXOpen brand, nor is it to be considered financial advice.

Black Monday is Coming – Time to Short This Beast!Alright, listen up, traders! The storm is brewing, the signs are clear, and if you haven't noticed yet—wake up! Black Monday is knocking, and the market is looking ripe for a proper dump.
Now, I'm not saying sell your grandma’s jewelry and go all-in, but if you're looking for a juicy short entry, this might just be it. Ideally, you want to get in around that sweet spot in the yellow zone (check the chart) or even from the current levels if you're feeling extra spicy.
Risk? What Risk? (Just Kidding, Manage It!)
Stop-loss? Yeah, slap that bad boy above $6,150 on the 4-hour close. If price secures above that level, it's a no-go—cut it and move on.
Take profits? Scale out as price nosedives. No need to be greedy; let the market pay you in chunks.
The Big Picture
This ain't financial advice—just a battle plan from someone who's seen enough bloodbaths in the markets to smell the fear. High risk? Absolutely. But hey, no risk, no champagne.
Remember, risk management is king. Play it smart, lock in profits, and let the market do the heavy lifting-because when the dust settles, only disciplined traders will be left standing.

S&P 500 - Analysis and Rebound levels! 4/7/2025S&P 500 just pulled off a slick rebound at 4835.04 - Let's hope it's legit. A close above the 50-week SMA keeps momentum alive. If not, eyes on the next landing zones at 4754.17 and 4699.43. No panic! Don’t let the noise rattle your game plan! 😎
#SP500 AMEX:SPY SP:SPX

SPY/QQQ Plan Your Trade For 4-9 : Top/Resistance UpdateToday's big rally, prompted by Trump's Tariff comments, presents a real learning opportunity for traders and followers of my videos.
Everyone wants to know what's going to happen next.
This video will tell you what I believe is NEXT for the markets and why.
It should also reinforce the construct that price is the ultimate indicator and the use of the EPP/Cradle patterns as a mechanism for using price structure to attempt to identify where opportunities may exist.
As much as this video is an analysis of price action and a prediction of what may come next, it is also a tutorial showing you how to use price patterns, structure and context to attempt to plan for your next opportunities.
Ideally, the next phase of the market is to establish a consolidation range.
If the 480-525 lower consolidation range does not hold - then it will likely become a precursor of the July breakdown (support) level. Remember, we still have the July/Oct lows to deal with.
I fully expect the 550-575 consolidation range to become the new dominant consolidation phase for the current EPP pattern.
It makes sense to me that, absent any crazy tariff war, the most likely outcome will be for the markets to recover back to the 550-575 level and to consolidate further.
The last component we have to consider is the recent lows near 480 could have been a very quick breakdown to an Ultimate Low. If that is the case, then we'll most into a mode of seeking the next higher resistance level and I believe the 550 or 575 level would be the obvious next resistance level.
So, at this point, I believe the continuation of the Excess Phase Peak pattern is likely, but the price is actively seeking the consolidation range between the lower consolidation level and the upper consolidation level.
Price MUST establish the consolidation range, or INVALIDATE this pattern, in order to move onto the next pattern/phase.
Get Some..
#trading #research #investing #tradingalgos #tradingsignals #cycles #fibonacci #elliotwave #modelingsystems #stocks #bitcoin #btcusd #cryptos #spy #gold #nq #investing #trading #spytrading #spymarket #tradingmarket #stockmarket #silver

Tariff Pause. Who wins ? BITCOIN leads the surge higherI don't meed to say to much ehre, the charts tell the stiry.
All are 4 hour
BITCOIN - GOLD
DXY $ - S&P500
And BITCOIN has the highest Rise in this time.
Gold was rising as safety seemed sensible but now, Risjier asset are safe for 3 months. ( for now)
The DXY dained against other currencies, taking back gains maybe
And the S&P riases though the NASDAQ has marginally higher gains.
Europeon markets will open tomorrow with a burst I expect.
This is not accident and it is the USa showing the worlf how much control it has over world finance.
As I have said many time in thepast 3 years. The New world war is not foght with Blood, it is fought with MONEY and the USa is , once again, Showing its force.
And the fact that BITCOIN has the highest gains, is DECENTRALISED, shows you why the USa wamts as mauvh of ot as possible
BITCOIN cannot be "Owned" and used as a Tool of War.
Buy BITCOIN, Spread the Power

S&P 500 Index Under Pressure – Another -10% Drop Incoming?Today, I want to analyze the S&P 500 Index ( FOREXCOM:SPX500 ) for you. This index is one of the most important indices in the US stock market , which has been determining the direction of parallel financial markets such as crypto and especially Bitcoin ( BINANCE:BTCUSDT ) for the past few days, so an analysis of this index can be important for us.
The S&P 500 Index started to fall after Donald Trump imposed new tariffs on countries around the world, which was like a coronavirus .
The question is whether this fall is temporary or will continue . To answer this question, we need to consider many parameters, but if we look at the sds chart from a technical analysis chart , we can expect a further decline .
The S&P 500 Index is moving near the Resistance zone($5,284-$5,095) and is completing a pullback . It also lost its important Uptrend lines last week, which is not good news for the S&P 500 Index and US stocks .
From an Elliott wave theory , the S&P 500 IndexS&P looks like it has completed the main wave 4 , and we should expect the next decline(-10%) .
I expect the S&P 500 Index to attack the Heavy Support zone($4,820-$4,530) at least once more. The area where we can expect the S&P 500 Index to pull back is the Potential Reversal Zone(PRZ) .
What do you think? Will the S&P 500 Index continue its downward trend, or was this decline temporary?
Note: If the S&P 500 Index touches $5,408, we can expect further Pumps.
Note: There is a possibility of a Bear Trap near the Heavy Support zone($4,820-$4,530) and PRZ.
Please respect each other's ideas and express them politely if you agree or disagree.
S&P 500 Index Analyze (SPX500USD),4-hour time frame.
Be sure to follow the updated ideas.
Do not forget to put a Stop loss for your positions (For every position you want to open).
Please follow your strategy and updates; this is just my Idea, and I will gladly see your ideas in this post.
Please do not forget the ✅' like '✅ button 🙏😊 & Share it with your friends; thanks, and Trade safe.

Trump's Tariff Wars : Why It Is Critical To Address Global TradeThis video, a continuation of the Trump's Tariff Wars video I created last week, tries to show you why it is critically important that we, as a nation, address the gross imbalances related to US trade to global markets that are resulting in a $1.5-$1.8 TRILLION deficit every fiscal year.
There has been almost NOTHING done about this since Trump's last term as President.
Our politicians are happy to spend - spend - spend - but none of them are worries about the long-term fiscal health of the US. (Well, some of them are worried about it - but the others seem to be completely ignorant of the risks related to the US).
Trump is raising this issue very early into his second term as president to protect ALL AMERICANS. He is trying to bring the issue into the news to highlight the imbalances related to US trade throughout the world.
When some other nation is taking $300B a year from the us with an unfair tariff rate - guess what, we need to make that known to the American consumer because we are the ones that continue to pay that nation the EXTRA every year.
Do you want to keep paying these other nations a grossly inefficient amount for cheap trinkets, or do you want our politicians and leaders to take steps to balance the trade deficits more efficiently so we don't pass on incredible debt levels to our children and grandchildren?
So many people simply don't understand what is at risk.
Short-term - the pain may seem excessive, but it may only last 30, 60, 90 days.
Long-term - if we don't address this issue and resolve it by negotiating better trade rates, this issue will destroy the strength of the US economy, US Dollar, and your children's future.
Simply put, we can't keep going into debt without a plan to attempt to grow our GDP.
The solution to this imbalance is to grow our economy and to raise taxes on the uber-wealthy.
We have to grow our revenues and rebalance our global trade in an effort to support the growth of the US economy.
And, our politicians (till now) have been more than happy to ignore this issue and hide it from the American people. They simply didn't care to discuss it or deal with it.
Trump brought this to the table because it is important.
I hope you now see HOW important it really is.
Get some.
#trading #research #investing #tradingalgos #tradingsignals #cycles #fibonacci #elliotwave #modelingsystems #stocks #bitcoin #btcusd #cryptos #spy #gold #nq #investing #trading #spytrading #spymarket #tradingmarket #stockmarket #silver

SPY/QQQ Plan Your Trade For 4-9 : Top/Resistance PatternToday's pattern suggests the SPY/QQQ will attempt to move a bit higher in early trading - trying to identify a resistance area. Then, roll over into a downward price trend.
Be cautious of the overnight price range, potentially already setting the upper boundary of the TOP pattern for today. It can happen that overnight trading sets a PEAK/TOP, and we move into sideways/downward trading related to the current TOP/Resistance pattern.
I believe the US markets will attempt to move upward, toward the $490-500+ level before topping out today. I believe this move will be related to the strong support near the $480 level and will attempt to further establish the downward price channel established by the big breakdown in trend over the past 9+ days.
Ultimately, I believe price is struggling for direction, but I also believe this process (with tariffs) is working out as expected.
This is obviously a very volatile market - so stay cautious as we move into a more consolidated price trend over the next few weeks.
I don't expect the markets to try to make any really big moves over the next 2+ week (unless news hits). At this point, I believe the markets will try to UNWIND the volatility over the next 2+ weeks.
BTCUSD is trading near the lower range of the consolidation phase. This could be the start of the breakdown to the Ultimate Low.
GOLD and Silver are moving higher after forming the base (just as I expected). Metals will likely rally strongly as global fear elevates.
Thank you for all the great comments. I'll try to publish a few new videos today and tomorrow to help everyone out.
Remember, price gives us new information every minute/bar. It is a matter of unraveling the puzzle with price - one bar at a time.
If you like what I do, follow along.
Get some.
#trading #research #investing #tradingalgos #tradingsignals #cycles #fibonacci #elliotwave #modelingsystems #stocks #bitcoin #btcusd #cryptos #spy #gold #nq #investing #trading #spytrading #spymarket #tradingmarket #stockmarket #silver
