SPX Targeting $4400 rangeThe S&P 500 is in a correction phase, possibly heading toward deeper Fib support (~4465 or lower), with a temporary bounce expected soon. Watch for bullish or bearish confirmation around the 0.382 and 0.175 levels to guide next moves.
S&P 500 (SPX500)

SPX, What is next? Trump knows best!Just putting my personal view based on market information and minimum speculation.
I hope my warning of a crash in my last post was useful
I rely heavily on volume profile and market geometry and of course my indicator( check it out: HiLo Ema squeeze bands)
I expect the market to fall to 4820 (about 61.8% fib level) to fill some volume gap, also 2022 peak, do a small a-b-c bottom and then rally back up to say 5450 ish, if some good news is heard. This would be just a bear rally
But I believe, Trump has opened a pandora's box and the market is still not aware of the full impact of it, or maybe it did realise and hence the crash
16% of USA budget is used for interest payment. If inflation rises and China and Japan keep selling treasuries, the bonds will go down. Not to speak of some major hedge funds like Citadel and banks holding trillions in treasury bond would increase their unrealised losses on bonds. But the stock market fall will force them to liquidate the bonds realise the loss, unless Fed buys the bonds back, which they will as always. That would be QE and the next bull run will begin. The banks have been holding the bonds since covid. Remember Silico Valley bank going burst! That was a sample.
Fed has managed to clicked the can down the road long, but Trumps policies will send the can in Fed's face
A financial liquidity baby seeded by Fed and Biden Adm during covid is about to take birth soon as financial crisis
I am bearish till Fed announces QE

Post-Liberation Day Sell-Off – Crash or Correction?Liberation Day has turned into a dramatic "blow the markets back out" day for the SPY , with a significant daily drop of nearly 6%, slicing decisively below the critical 200-day moving average at $574.46. Historically, breaking below the 200-day MA is a strong bearish signal, indicating potential further downside momentum.
The previously identified key bearish pivot, the "Best Price Short" at $565.16, served as a crucial resistance level from which sellers aggressively stepped in, intensifying today's sell-off. Given the current bearish sentiment, the next immediate downside targets without a significant bounce (dead-cat bounce) include:
Half 1 Short (Momentum target): $505.28 (already tested)
High Vol Momentum Target 1a: $497.66
Half 2 Short (secondary bearish momentum): $486.41
Extended Momentum Target (HH Vol Momo Target 2a): $475.16
For traders who missed the initial move, look to re-enter shorts if there's a modest retracement toward the previously broken "Weeks High Short" at $520.16, maintaining tight risk control with stops ideally set just above the "Best Price Short" ($565.16).
Critical levels summary:
Ideal Short Re-entry Zone: $520.16
Profit Targets: $497.66, $486.41, and ultimate $475.16
Stop Loss Area: Slightly above $565.16
Major Broken Support (Resistance now): 200-day MA at $574.46
Today's significant volume spike further reinforces bearish conviction. RSI is deeply oversold at 23.24, suggesting caution for potential short-term bounce, but any bounce is likely to be short-lived unless there's a substantial political or economic pivot soon.
These levels are algorithmically defined, designed to remove emotions from trading. Trade responsibly, adhere to your strategy, and protect your capital.

S&P 500 Breakdown: 4,790 Worst-Case Scenario in Play?Last week, I warned in this post that if sentiment worsened, the S&P 500 could head toward 4,790 as a worst-case scenario. Fast forward to today, and the index has officially lost the 5,149 support level, opening the door for further downside.
What Just Happened?
📉 Key Support Broken: The market just lost 5,149 (1.0 Fib retracement), which was a major line in the sand.
📉 Momentum Still Bearish: With no strong bounce, sellers remain in control, making 4,790 - 4,800 the next major target.
📉 Next Supports:
4,800 zone: A critical psychological level and my worst-case scenario target.
4,761 (1.618 Fib): A key confluence area for a potential bounce.
If the S&P 500 fails to reclaim 5,149 quickly, then the next downside targets are:
4,800 – A major area I highlighted last week.
4,761 – Aligns with the 1.618 Fib extension, adding confluence.
What Needs to Happen for a Rebound?
For bulls to take back control, the index must reclaim at least 5,149, or risk continued selling. A failed bounce could accelerate the move lower.
🚨 I called 4,790 as a worst-case target last week.

S&P 500 to tank to 5,100 pointsPEPPERSTONE:US500
The S&P 500 broke below critical support after Trump announce massive tariffs on everyone, worst than expected. Volume is increasing to the downside, and it looks like the next wave down has already started.
Wave C is supposed to be equal or larger than wave A, and reach the next critical support, which will lead us to 5,100 points in the next couple of weeks.
I heard that net tariffs on China are 54%, does than means that iPhones are going to rise in price 54%?
Maybe it will be reconsidered later, and the market will bounce in the future, but not likely in the short term.
Good luck to you

SPX short term VP analysisI have done a short term volume profile analysis with support and resistance levels. Market is at long term trendline as well. I Expect a small bounce and some grinding for a week or so fighting the long term trendline.
Personally I think it will crash through the trendline after a week of grinding, but will watch closely and make short term trades

Liberation or Obliteration?Notice the pattern here, the last time we had a fed pivot the market went up for a couple of months and then a huge draw down. History doesn’t always repeat but it often rhymes. We are being held up by the 0.382 Fib, so we are technically still bullish believe it or now.
What’s next? If the tariff issues are not resolved we will get a total melt down, the likes of which we haven’t seen before.
So if you are hopeful that the tariffs will be resolved, this is an excellent opportunity to buy the dip. I was largely long gold but I have not almost exited my position, please look at my trade idea on gold which was a textbook long.
Now I’m putting that cash to work and slowly buying up the best assets the market has to offer. I will add to my long term investment in the AI companies, data center and top class software names. But I’m not going all in, I’m reserving dry powder for more draw downs. For now this technical analysis suggests now is the time to be slowly deploying.
Not financial advice, do what’s best for you.

SHORT TERM BOTTOM/BUYZONE w/SELL ZONE.Charting a short-term bottom (3mos. - 6mos.) We may quest to 5000. However, I believe this to be the end of a two part measured move to the downside.

Markets hate tariffs but traders love discounts
SPX500 is down over 12.2% YTD
Volatility Index (VIX) is above 40 — elevated fear in the market
SPX support zone likely around 4,888
Historical patterns show strong rebounds near similar volatility spikes
This could be a prime entry point — keep your cash ready
With tariffs back in play, volatility could spike — stay ready for discounted entries

SP500- Don't be fooled by yesterday's pumpThe markets reacted strongly to Jerome Powell's latest commentary, sparking a notable rally. However, traders should be cautious before assuming this marks the beginning of a new uptrend. While there has been a slight shift in market structure, the broader trend remains intact. Overlooking the strength of the next resistance level could prove to be a costly mistake.
The Big Picture: S&P 500 Daily Chart Analysis
Examining the TRADENATION:US500 posted daily chart, the key question is: has the trend truly reversed? While a green-bodied candle signals some bullish momentum, SP500 remains below critical resistance levels. Notably, it closed beneath what I call the "Do or Die" zone—an area that aligns with prior lows and, more importantly, the daily 200 SMA. This suggests that what we’re seeing could be a lower high forming within the broader downtrend.
Hourly Outlook:
On the hourly chart, we see a strong reversal from 5500, but the move appears corrective rather than impulsive. It seems to be forming an ABC-style correction, with the market currently in wave C. Calculating the potential top of wave C, we find it aligns perfectly with a key resistance level and the 200-day SMA.
Conclusion:
While we may see some upside heading into the end of the week, I believe this rally will be short-lived. Once SP retests the broken support—now acting as resistance—I expect the downward trend to resume, with my target remaining at 5200 (as previously discussed).
Disclosure: I am part of Trade Nation's Influencer program and receive a monthly fee for using their TradingView charts in my analyses and educational articles.

Recovery or Pain?Will this be the infliction point or breaking point? Here we have multiple points of importance. Will this be a bounce or a crash?

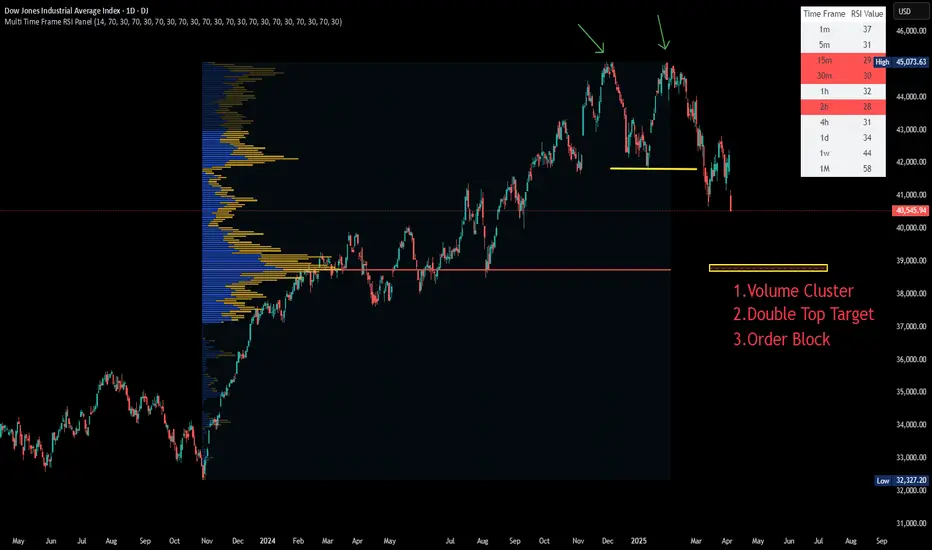
Dow Jones | How far will it fall ?!All the strong supports have been broken and the stock market is bleeding! You can see one of the important supports ahead on the chart! 3 zones are stacked on top of each other! We are waiting for a reaction to this area.
S&P 500 Faces Increased Bearish Pressure as Trade War BeginsThe S&P 500 has formed a downtrend channel following the break below the 5700 support level. Trump's new aggressive tariff policy raised the minimum tariff on China to 54%, while China responded with equally aggressive 34% tariffs. The trade war has now officially begun.
This escalation is clearly negative for the stock market. Recession risks have risen significantly, and it remains uncertain how much the Fed can cut rates while tariff-driven inflationary pressures persist. Rapid rate cuts could help soften the slowdown but may also risk fueling another inflation surge. That would be the more optimistic case for equities. However, the Fed is likely to proceed cautiously, suggesting that bearish pressure could continue for several quarters.
In the short term, the downward trend remains intact. If the S&P 500 breaks the 38.2% Fibonacci retracement level, it may decline further toward the lower boundary of the new trend channel, where a potential bounce could occur. As long as the trend holds, bears remain in control.
Note: Powell is expected to speak today. His remarks carry even more weight following the tariff moves by both the U.S. and China.

SPY/QQQ Plan Your Trade For 4-4 : Breakaway PatternToday is a very interesting day because my MRM investment model turned BEARISH on the Daily chart. That means we have broken through major support because of this tariff war and the markets are not OFFICIALLY (based on my models) into a Daily BEARISH trend (or a Daily Broad Pullback Phase).
What that means is we need to start thinking of the markets as OVERALL BEARISH and trying to identify support - or a base/bottom in the near future.
This is no longer a BULLISH market - everything seems to have flipped into a BEARISH primary trend (OFFICIALLY).
So, watch this video to understand how Fibonacci price levels will likely play out as the SPY targeting the 500-505 level (possibly lower) and where the same Fibonacci price levels will prompt the QQQ to target 395-400.
BUCKLE UP. This is a BIG CHANGE related to overall market trend.
Gold is holding up much better than Silver. But I still believe this is a PANIC selling phase in Gold/Silver and they will both base/recovery and RALLY much higher.
The funny thing about the cycles in Gold/Silver is this:
In 2007-08, just after the major expansion phase completed, the Global Financial Crisis hit - prompting a large downward price rotation in metals.
Maybe, just maybe, this forced tariff war issue is a disruption that will "speed up" the process of metals rallying above $5000++ over the next 60+ days.
I see this move as PHASES and it appears the tariff disruption may prompt a faster Phase-Shift for metals over the next few months. We'll see.
BTCUSD seems to be in SHOCK. It's really going nowhere on very low volume.
If BTCUSD is a true hedge or alternate store of value - I would think it would have an upward reaction to this selling.
We'll see how this plays out.
Get some.
#trading #research #investing #tradingalgos #tradingsignals #cycles #fibonacci #elliotwave #modelingsystems #stocks #bitcoin #btcusd #cryptos #spy #gold #nq #investing #trading #spytrading #spymarket #tradingmarket #stockmarket #silver

Are Time and Reason in Harmony in SPX?Are Time and Reason in Harmony in SPX?
S&P 1D Technical and Fundamental Analysis;
This structure, which looks like an ordinary decline on the SPX daily chart ... in fact, we can say that it carries the pieces of a big scenario that develops synchronously both technically and fundamentally.
Let me explain now;
5 December 2024 was not just a breaking point. Because Trump's statements after taking the presidency for the second time, especially the message that ‘customs walls may rise’ had become clear.
In the same week, the uptrend in SPX quickly weakened and declined as the FED gave the message ‘Interest rate cut is not imminent’.
From here, Bullish Sharq started the formation of harmonic formation.
Now comes the week of 1 May.
- FED's interest rate decision,
- Trump's budget plan,
- And one of the critical macro thresholds where company balance sheets are announced.
While everything is going well so far, if we take into account that the chart will also touch a strong trend line, it may mean ‘either a bounce or a collapse from here’.
Because the price in the market does not just move, it looks for reasons .
I would also like to ask you here;
What will greet the market when this date comes?
Harsh interest rate rhetoric?
Trump's aggressive economic agenda?
Or a recovery supported by positive balance sheets?

S&P 500 resistance levels#SPX
Upon observing the 6-month cash data of the S&P index, it becomes clear that this index has reached significant resistance levels. However, it is still too early to proclaim the beginning of a major correction in this index. That said, it can be anticipated that a potential price correction might extend to the range of 4800 to 4500.
When comparing the wave count of this index with the Warren Buffett Indicator, both reveal a common message: the S&P is currently situated in sensitive zones.
There are two critical price ranges for this index that could lead to significant price reversals: the first range is between 6085 and 6240, and the second range is between 7900 and 8000.

Massive storm hiting the crypto market soon!The Correlation Between SPX500 (Wall Street) & Crypto 📉📈
The relationship between SPX500 and crypto is not always stable. Sometimes they move in sync, like the Earth and Moon, and other times, they are completely decoupled. But rarely, we get an eclipse—a moment of total disconnection.
And guess what? That’s about to happen.
🔎 What’s Happening?
Looking at the charts, SPX500 had a massive rally last year, but while Wall Street boomed, crypto was bleeding. Most altcoins were slaughtered, and the TOTAL crypto market cap suffered.
But now, SPX500 is overbought, while crypto is oversold.
👉 This time, the decoupling will work in crypto’s favor!
💰 $2 Trillion in Sidelined Cash Ready to Flow In
Right now, about $2 trillion USD is sitting on the sidelines—money that institutional investors are hesitant to deploy due to market uncertainty. Many are keeping their funds in USD or foreign bonds instead of taking risks.
However, if you check my April/May forecast, we can see that:
✅ Crypto will be deeply oversold (confirmed by RSI & weekly MACD crossover).
✅ The US Dollar is weakening, forcing investors to move their money into other assets.
✅ SPX500 turning bearish = capital rotating into crypto.
🚀 The Perfect Storm for Crypto
📉 SPX500 bearish
💵 USD weakening
📈 Crypto bullish
This creates the perfect setup for rich investors to flood the crypto market with fresh liquidity.
💡 What does this mean for prices?
- CRYPTOCAP:BTC could double (100% gain).
- Altcoins could skyrocket (x10 to x100).
- This would finally trigger the altseason we’ve been waiting for—the parabolic move that happens once every four years.
📆 Timeline: April – June 2025
This move will be so explosive that it will eventually trigger a correction—possibly leading to a bear market. However, since crypto now moves in 6-month cycles, this correction should end by December 2025, setting up another leg up.
🏁 Final Thoughts
This kind of SPX500 & crypto decoupling is extremely rare, so positioning before the rotation starts is crucial.
⏳ Exact timing? Hard to say. But April/May looks like the moment when everything aligns.
🚨 DYOR as always—anything can happen to invalidate this idea.

Head & Shoulder Breakdown: Will S&P 500 Drop Another 10%?● The S&P 500 has experienced significant volatility recently, mainly due to President Donald Trump's announcement of new tariffs.
● On April 3, 2025, the index saw a nearly 5% drop, its worst single-day loss in five years.
● The recent price action suggests that the index has broken below the neckline of the Head and Shoulder pattern, indicating a potential continuation of the downward trend.
◉ Key support levels to watch
● 1st Support - 5,200 - 5,250
● 2nd Support - 4,950 - 5,000

US500 CHANNELHello friends
Given that the price is in an ascending channel, now that we have a strong wave to the channel ceiling, we have corrected the price by 50%, after which we can expect the price to succeed in hitting a higher ceiling again.
*Trade safely with us*

S&P 500 Down 3% – Divergence AppearsThe S&P 500 (SPX) continues to show a strong bearish bias and is approaching the 5,300-point level in the short term. Selling pressure remains steady as post-“Liberation Day” uncertainty persists, with markets concerned that the recently announced tariffs could significantly impact the U.S. economic outlook. As a result, this could severely limit the performance of equity indices like the S&P 500.
Bearish Channel
Since February 20, the SPX index has maintained consistent downward momentum, establishing a new bearish channel in the short term. The index has now broken below the key 5,400-point support level. However, the speed of the recent declines may have created an imbalance in market forces, which could pave the way for a bullish correction in upcoming sessions.
Divergence in Indicators
MACD: Both the MACD line and the signal line have shown higher lows in recent trading sessions, which contrasts with the lower lows in the SPX price, indicating a bullish divergence.
RSI: The RSI is showing a similar pattern, with the line forming higher lows while price continues to make lower lows. Additionally, the RSI is now approaching the 30 level, which is typically considered the oversold zone.
These divergence and oversold signals suggest that bearish momentum has accelerated sharply, potentially signaling short-term exhaustion. As the balance between buyers and sellers begins to stabilize, this may be an early indication that upward corrections could occur in the next few sessions.
Key Levels:
5,780 points – Distant resistance: This level aligns with the 200-period moving average. A return to this zone could mark the start of a new bullish phase, posing a threat to the current bearish channel.
5,530 points – Near resistance: This area corresponds to neutral levels seen in recent weeks. It may become a target zone for potential corrective upward moves.
5,388 points – Key support zone: This level matches the lowest prices since September 2024 and is where the price is currently consolidating. If the index breaks decisively below this level, it could lead to a more extended bearish channel in the short term.
By Julian Pineda, CFA – Market Analyst

Trump Goes 'Cynosure' of All Eyes as He Walked Into '1930' RoomThe Striking Parallels Between Trump's 2025 Tariffs and the Smoot-Hawley Tariff Act of 1930
The recent trade policies under President Trump's second administration bear remarkable similarities to the controversial Smoot-Hawley Tariff Act of 1930, both in approach and potential consequences. These parallels offer important historical lessons about protectionist trade policies.
Protectionist Foundations and Scope
Both trade initiatives share fundamentally protectionist motivations aimed at shielding American industries from foreign competition. The Smoot-Hawley Act increased import duties by approximately 20% with the initial goal of protecting struggling U.S. farmers from European agricultural imports. Similarly, Trump's 2025 trade agenda explicitly aims at "backing the United States away from integration with the global economy and steering the country toward becoming more self-contained".
What began as targeted protections in both eras quickly expanded in scope. While Smoot-Hawley initially focused on agricultural protections, industry lobbyists soon demanded similar protections for their sectors. Trump's tariffs have followed a comparable pattern, beginning with specific sectors but rapidly expanding to affect a broad range of imports, with projected tariffs exceeding $1.4 trillion by April 2025—nearly four times the $380 billion imposed during his first administration.
Specific Tariff Examples
The parallel implementation approaches are notable:
Trump imposed a 25% global tariff on steel and aluminum products effective March 12, 2025
Trump raised tariffs on all Chinese imports to 20% on March 4, 2025
Trump imposed 25% tariffs on most Canadian and Mexican goods
Smoot-Hawley increased overall import duties by approximately 20%
Smoot-Hawley raised the average import tax on foreign goods to about 40% (following the Fordney-McCumber Act of 1922)
Global Retaliation and Economic Consequences
Perhaps the most striking similarity is the international backlash. The Smoot-Hawley tariffs triggered retaliatory measures from over 25 countries, dramatically reducing global trade and worsening the Great Depression. Trump's 2025 tariffs have already prompted counter-tariffs from major trading partners:
China responded with 15% tariffs on U.S. coal and liquefied natural gas, and 10% on oil and agricultural machines
Canada implemented 25% tariffs on approximately CA$30 billion of U.S. goods
The European Union announced tariffs on €4.5 billion of U.S. consumer goods and €18 billion of U.S. steel and agricultural products
Expert Opposition
Both policies faced significant opposition from economic experts. More than 1,000 economists urged President Hoover to veto the Smoot-Hawley Act.
Trump's 2025 tariffs? Reaction is coming yet...
Potential Economic Impact
The historical record suggests caution. The Smoot-Hawley Act is "now widely blamed for worsening the severity of the Great Depression in the U.S. and around the world". Trump's "more audacious intervention" similarly carries "potentially seismic consequences for jobs, prices, diplomatic relations and the global trading system".
These striking parallels between trade policies nearly a century apart demonstrate that economic nationalism and retaliatory trade cycles remain persistent challenges in international commerce, with historical lessons that remain relevant today.
Stock market Impact
Just watch the graph..
--
Best wishes,
Your Beloved @PandorraResearch Team 😎

DXY to 80? ...Tariffs the First Domino in a Multi-Year Collapse?This is a pure technical walkthrough of the U.S. Dollar Index—no fluff, no indicators, no fundamentals. Just market structure, smart money, and liquidity concepts.
Back on January 14th , I posted about a potential 20%+ drop in the DXY — you can view it here . This video builds on that thesis and walks you through the full technical story from 1986 to today , including accumulation cycles, yearly trap zones, and my long-term target of 80. Am I crazy? Maybe. Let's see if I can convince you to be crazy too 😜
There is a video breakdown above, and a written breakdown below.
Here are timestamps if you want to jump around the video:
00:00 – The Case for $80: Not as Crazy as It Sounds
02:30 – The 0.786 Curse: Why the Dollar Keeps Faking Out
06:15 – How Smart Money Really Moves: The 4-Phase Playbook
12:30 – The Trap Is Set: Yearly Highs as Liquidity Bait
20:00 – Inside the Mind of the Market: 2010–2025 Unpacked
25:00 – The Bear Channel No One’s Talking About
36:00 – The First Domino: Is the Dollar’s Slide Just Beginning?
👇 If you're a visual learner, scroll down—each chart tells part of the story.
Chart: Monthly View – Three Highs, .786 Retraces, and Trendline Breaks
History doesn’t repeat, but it sure rhymes.
Each major DXY rally has formed a sequence of three swing highs right after a break of trendline structure. In both instances, price retraced to the .786 level on the yearly closes—an often overlooked fib level that institutional players respect.
We’re now sitting at a high again. You’ll notice price has already reversed from that zone. That doesn’t guarantee a collapse, but when we line it up with other confluences (next charts), the probability of a deeper markdown becomes hard to ignore.
I'd also like to note that all of the highlighted moves, are 2-3 year trend runs. Which means if we are bearish, this could be the exact start of a 2-3 bear market.
Market Phases Since 1986
This chart illustrates how DXY has moved through repeating cycles of:
🟡 Accumulation: Smart money building positions quietly.
🔵 Markup: Price accelerates with buy orders + media hype.
🟣 Distribution: Smart money sells to latecomers.
🔴 Markdown: Public panic → smart money reloads.
If we are indeed entering another markdown phase, this would align perfectly with the pattern seen over the past 40 years.
You’ll also notice the "Point of Control" (POC) zones—volume-based magnets that price often returns to. These spots often act as the origin of the move, and as such, they make for strong targets and areas of interest.
Liquidity Zones and Stop Loss Traps
This is where it gets juicy.
The majority of breakout traders placed long entries at the blue lines—above swing highs, thinking resistance was broken. But what’s under those highs? Stop loss clusters.
Institutions use these areas as liquidity harvests.
Several key levels are marked as “OPEN” in this chart, meaning price has yet to return to sweep those orders. That’s why I’m expecting price to begin seeking out that liquidity over the coming months.
There's also an imbalance gap (thin price action) around the 85–86 zone. If price falls into that trap door, there’s nothing to stop it until the 80s.
The 2025 Outlook
Here’s how I’m approaching this year:
✅ Bearish bias under 105
🎯 Targets at 100, 95, and 90
🚪 Trap door under 86 if volume is thin
Price is currently stuck under the recent point of control and showing signs of distribution. If that level continues to hold as resistance, we could see a multi-leg push downward, with the 100 and 95 zones acting as check-in points.
If we break under the 90s and enter the imbalance zone, 80 becomes more than just possible—it becomes probable.
🗣️ Let’s Sharpen Together
Do you see this unfolding the same way?
Do you disagree with the 80 target?
Drop a comment with your view or share your own markup—this is why we trade!
Stay safe,
⚠️ Risk Disclaimer
This post is for educational purposes only and reflects my personal analysis and opinions. It is not financial advice. Trading involves significant risk and may not be suitable for all investors. Always do your own research, manage your risk appropriately, and never trade money you can’t afford to lose.

SPY/QQQ Plan Your Trade For 4-3 : GAP Breakaway PatternFirst off, thank you for all the great comments and accolades related to my calling this breakdown (nearly 60+ days ago).
Did I get lucky having these new tariffs announced, causing the markets to break downward? Probably.
Did my research suggest the markets were going to break downward anyway? YES.
Did my research predict these tariffs? NO.
My research is specifically price-based. You'll notice I don't use many indicators, other than my proprietary price pressure and momentum indicators.
The purpose of what I'm trying to teach all of you is that price is the ultimate indicator. You can use other indicators if you find them helpful. But, you should focus on the price chart and try to learn as much as you can from the price chart (without any indicators).
Why, because I believe price tells us everything we need to know and we can react to price more efficiently than getting confused by various technical indicators.
At least, that is what I've found to be true.
Today's pattern suggests more selling is likely. After the markets open, I suggest there will be a bunch of longs that will quickly be exited and shorts that will be exited (pulling profits). Thus, I believe the first 30-60 minutes of trading could be extremely volatile.
My extended research suggests the markets will continue to try to move downward (over the next 60+ days) attempting to find the Ultimate Low. But, at this point, profits are profits and we all need to BOOK THEM if we have them.
We can always reposition for the next breakdown trade when the timing is right.
Gold and Silver are moving into a PANIC selling phase. This should be expected after the big tariff news. Metals will recover over the next 3-5+ days. Get ready.
BTCUSD is really not moving on this news. Kinda odd. Where is BTCUSD as a hedge or alternate store of value? I don't see it happening in price.
What I do see is that BTCUSD is somewhat isolated from this tariff news and somewhat isolated from the global economy. It's almost as if BTCUSD exists on another planet - away from global economic factors.
Still, I believe BTCUSD will continue to consolidate, attempting to break downward over the next 30+ days.
Remember, trading is about BOOKING PROFITS and moving onto the next trade. That is what we all need to focus on today.
Get Some.
#trading #research #investing #tradingalgos #tradingsignals #cycles #fibonacci #elliotwave #modelingsystems #stocks #bitcoin #btcusd #cryptos #spy #gold #nq #investing #trading #spytrading #spymarket #tradingmarket #stockmarket #silver
