S&P500 - Donald Trump Is Crashing Markets!S&P500 ( TVC:SPX ) is starting a correction:
Click chart above to see the detailed analysis👆🏻
Since Donald Trump was elected the markets have been super volatile and clearly not too easy to trade. But now it seems like bears are slowly taking over the entire U.S. stock market after we just saw a drop of -10% within a couple of days and a correction becomes more and more likely.
Levels to watch: $6.100, $4.800
Keep your long term vision,
Philip (BasicTrading)
S&P 500 (SPX500)

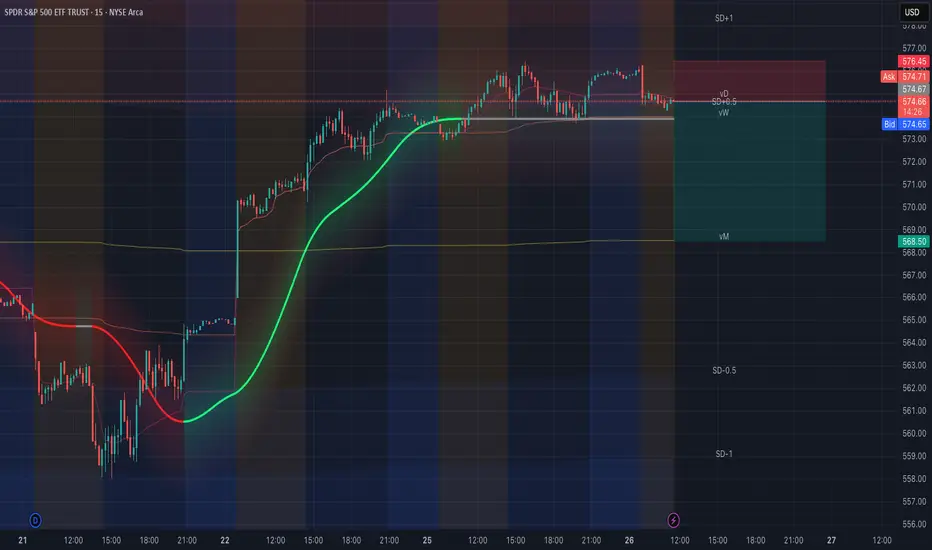
SPY 03/26Looks like it's about to roll down. First target would be monthly VWAP. Not financial advice. Could also range a little bit longer.
S&P 500 eases back from 200-dayThe S&P 500 has been on an impressive two-week rally but is now encountering a crucial resistance zone. The index is currently testing resistance near the 200-day moving average and a previous support level in the 5770-5800 range. This key area, highlighted in grey on the chart, could determine whether the recent bullish momentum continues.
Meanwhile, support is found around 5695-5670, marked in blue on the chart. This zone is significant as it previously served as the launch point for the post-election rally before it lost steam. Reclaiming this level is a bullish signal, but the S&P 500 needs to stay above it through to next week to maintain its upward trajectory.
If support at 5695-5670 fails, the bulls could face serious headwinds. A breakdown at this level may trigger renewed selling pressure, similar to the declines seen in previous weeks. The situation could worsen if the index falls below 5600, which was Friday’s low, when a hammer candle was formed.
By Fawad Razaqzada, market analyst with FOREX.com

SPY/QQQ Plan Your Trade for 3-26-25 : Flat-Down PatternToday's Flat-Down pattern for the SPY/QQQ suggests the markets will consolidate in a sideways channel, generally drifting downward.
As I've been warning all of you for the past month+, the market will likely roll over into a topping formation over the next few days, then start an aggressive downward trend targeting $525-535 on the SPY.
Today's video covers some details related to my expectations and how traders can prepare for the bigger moves I see pending.
Gold and Silver are poised for a potentially BIG BREAKOUT move to the upside. And I still believe Gold/Silver are going to rally another 15-20% within the next 30-45 days.
Bitcoin should follow the SPY/QQQ into a "rollover top" type of pattern then shift into a downward price trend over the next few days.
Everything is following my predictions/expectations almost perfectly.
Now, we try to profit from some of these big moves.
Go get some.
#trading #research #investing #tradingalgos #tradingsignals #cycles #fibonacci #elliotwave #modelingsystems #stocks #bitcoin #btcusd #cryptos #spy #gold #nq #investing #trading #spytrading #spymarket #tradingmarket #stockmarket #silver

Vix Alert'VIX Alert' is a simple and accurate trend deviation alert system using the VIX index and S&P 500 index.

Intraday Buy Opportunity: US500Intraday Idea - We look to Buy TRADENATION:US500 at 5735
Technical View
Trades at the highest level in 12 days
The rally has posted a correction count on the intraday chart
An overnight negative theme in Equities has led to a lower open this morning
Bespoke support is located at 5735
Previous resistance, now becomes support at 5725
Stop: 5695
Target: 5867
Disclosure: I am part of Trade Nation's Influencer program and receive a monthly fee for using their TradingView charts in my analysis.

Hellena | SPX500 (4H): LONG to resistance area of 5830.Colleagues, the previous forecast is not canceled, but I decided to update it a bit in the form of a new forecast. I have set the target a little closer, so that I don't have to wait too long.
I believe that the price will continue its upward movement and will reach the area of 5830. It is quite possible that the price will correct to the area of 5597, completing the wave “2” of small order.
Manage your capital correctly and competently! Only enter trades based on reliable patterns!

$SP500 $SPX Is the bull run over?#SP500 SP:SPX S&P500
Is this just a bull-run retracement or the beginning of a bigger crash?
Is the bull run over?
Every major crash started with an “innocent” 10–15% pullback. 🧐
It’s difficult to draw any conclusions right now, but once the current bounce is over, the next retracement will give us more clues. ⏳👀
Are you bullish or bearish? 🐂 🐻

SPX 5800 Strong resistance200 days HILO EMA central line has always given a strong support resistance in the past and I would expect that to be so this time as well. Since the market structure broke when prices crossed the lower outer ema band, even if the price goes above the middle line I would not consider it to be bullish.Only when the prices hit the upper or lower band a new trend can be confirmed.
For now I am just going to be short term trader and a cautious long term investor accumulator
of fundamentally good stocks. Not Tesla :)
Notice how the inner lines align with the the other lines before the breakdown! A kind of step formation, indicating the period selection of 200 ema is sound

$DXY 10% Declines along with $SPX declines from 1987-1995In case you are wondering if the drop in the $USDOL TVC:DXY US Dollar of 10% from a high is a sign of something major going on in the stock market, it reminded me of research I did right when I got out of college in 1987.
Here's a quick overview of that pattern of TVC:DXY declines of 10% against the backdrop of SP:SPX or S&P500 Index declines at that time. The 1987 stock market crash is on the far left of this graph and gets the chart started for you to review.
The 10% drops from highs in the TVC:DXY index are labeled with yellow arrows and there were 9 of them across this time series from 1987-1995.
We can imagine how a Non-US investor would handle both a drop in the TVC:DXY and a drop in the SP:SPX , but a drop of both the TVC:DXY and SP:SPX of 10% together would mean a loss of 20% for the non-US investor. That is a painful loss and perhaps more than investors wanted to risk.
Historically, it was a good time to look for a stock market bottom AFTER a drop in the TVC:DXY index and the green boxes at the top show the risk of a deeper decline in the SP:SPX was minimal after this scenario.
So the end result of this analysis is that the Dollar can be viewed as a contrarian indicator after a meaningful decline, as in 10% in this time frame. Look for other signs of a market bottom, especially using my TVC:VIX signals (5 point spike indicator and VIX75% retracement) to help define a bottom. The VIX75 signal triggered on Monday, March 24th, indicating that the panic from the selloff had moderated to a point enough to signal that the panic was over.
Do some more research for yourself and see if the TVC:DXY drop was an "asset allocation" shift as US investors bailed out of US stocks to invest in non-US stocks or was it another wave of non-US investors dumping US stocks to cut risk.
Either way, know what you are investing in and question everything. These days, it is more important to be educated and use TradingView to chart and research the past will help you be a more educated investor.
Cheers,
Tim

SPY/QQQ Plan Your Trade For 3-25-25 : Top PatternToday's Top Pattern suggests the SPY/QQQ will find resistance slightly above yesterday's closing price level and attempt to roll over into a bearish price trend.
Watch today's video to see which levels I believe will be the top for the SPY & QQQ.
I do expect metals to rally over the next 3+ weeks and I'm watching for this morning's bounce to carry onward and upward.
Bitcoin should be rolling downward off that FWB:88K top level I predicted months ago.
We are moving into a topping phase - so get ready for the markets to attempt to ROLL DOWNWARD over the next 5+ trading days into a deeper low price level.
Get some.
#trading #research #investing #tradingalgos #tradingsignals #cycles #fibonacci #elliotwave #modelingsystems #stocks #bitcoin #btcusd #cryptos #spy #gold #nq #investing #trading #spytrading #spymarket #tradingmarket #stockmarket #silver

$SPX key level test for a medium-term direction SP:SPX is reaching the 5780 level which was previously strong downside resistance and now is a strong upside resistance.

S&P 500: The Correction Is Not Over Yet – Targets Around 5000At the moment, the S&P 500 is holding relatively stable, but I believe the current decline is just part of a larger correction following decades of growth.
Right now, the index is retracing to the 50% pullback area (marked on the chart), which aligns with a typical retest before a potential continuation of the downward move. In this zone, a manipulation is likely, after which the decline may resume.
An additional confirmation of this scenario is the unfilled gap below, which remains uncovered. Historically, the market tends to close such gaps. Moreover, there are untested price levels lower on the chart, suggesting a high probability of further downside movement, with targets around 5000 points.
I will keep monitoring the situation and update my outlook as new data emerges.

Price climbing with Volume warningsPrice climbed after the bullish headsup we had on Friday
Strong bullish signs:
Strong close with little selling at the top
Closing above LT MA's and daily previous high
Bearish: Volume is not picking up - hint that this is an up reaction but the trend is still down, be careful with longs at this point
#SPX - 25 MarHuge run up in #SPX after a gap up. Strongly bullish for further upside.
Any dips is a buying opportunity. Looking at PZ to hold for another leg higher, or if it breaks, look at 5700 for a long up to 5880 then 6000.

Dow Jones on the weekly chartAs you can see, due to recent economic news and Trump's economic approaches, we have unfortunately witnessed a decline in major indices, including the Dow Jones. We are currently at the last available support level, which is the bottom of the Dow Jones long-term channel, and we need to see how it reacts to this level in tomorrow's news and the CPI release.

Breaking: SPX6900 ($SPX) Surged 21% Today The price of SPX6900 ( SP:SPX ) surged Nearly 25% today amidst breakout of a falling wedge.
Created on the Ethereum blockchain, SPX6900 is an advanced blockchain cryptography token coin capable of limitless possibilities and scientific utilization. With a growing momentum and hardworking community the coin seems to be a contender in the incoming bullrun speculated by traders.
As of the time of writing, SP:SPX is up 16.35% trading in tandem with the 1-month high axis. a break above that point could signal a trend continuation to the $0.70 - $0.80 pivot.
Similarly, should SP:SPX cool-off, immediate consolidation point resides in the 38.2% Fibonacci retracement point.
SPX6900 Price Live Data
The live SPX6900 price today is $0.616856 USD with a 24-hour trading volume of $45,031,583 USD. SPX6900 is up 21.61% in the last 24 hours, with a live market cap of $574,288,459 USD. It has a circulating supply of 930,993,090 SPX coins and a max. supply of 1,000,000,000 SPX coins.

SPX us500The index has a target price range of 5991, there is a possibility of going up from this moment, but another possibility is that the range of 5520 will be touched and then it will move up.

S&P500 INTRADAY oversold bounce back capped at 5777S&P500 INTRADAY oversold bounce back capped at 5777
Key Support and Resistance Levels
Resistance Level 1: 5777
Resistance Level 2: 5844
Resistance Level 3: 5872-5920
Support Level 1: 5604
Support Level 2: 5539
Support Level 3: 5500
This communication is for informational purposes only and should not be viewed as any form of recommendation as to a particular course of action or as investment advice. It is not intended as an offer or solicitation for the purchase or sale of any financial instrument or as an official confirmation of any transaction. Opinions, estimates and assumptions expressed herein are made as of the date of this communication and are subject to change without notice. This communication has been prepared based upon information, including market prices, data and other information, believed to be reliable; however, Trade Nation does not warrant its completeness or accuracy. All market prices and market data contained in or attached to this communication are indicative and subject to change without notice.

SPY/QQQ Plan Your Trade for 3-24-25 : Bozu Trending PatternToday's Bozu Trending pattern suggests a very aggressive price move is likely. I believe this move will be to the upside after my weekend research suggested we are moving into a "blow-off" topping pattern that will act as a Bull Trap.
Overall, I belive the SPY/QQQ have about 2-3 days up upward price trending early this week, then the markets will suddenly roll into a topping pattern and start to aggressively move downward.
The next base/bottom of the continued downward price trend sets up in early/mid April. The March 21-24 base/bottom is likely the minor base/bottom we have seen over the past 3-5+ days.
I believe the breakdown in the SPY/QQQ late this week and into next week will result in a new lower low - causing the Consolidation phase of this downturn to extend down to the 520-525 level on the SPY.
Bitcoin is very close to my $88,000 upper target level (only about $250 off that level). Get ready, BTCUSD should make an aggressive move downward after stalling near the FWB:88K level peak.
Gold and Silver are moving into a trending mode. I believe both Gold and Silver will rally this week and into the next few weeks as we expand into the Expansion phase.
Buckle up. If my research is correct, we are going to see a BIG ROLLOVER this week.
Get some.
#trading #research #investing #tradingalgos #tradingsignals #cycles #fibonacci #elliotwave #modelingsystems #stocks #bitcoin #btcusd #cryptos #spy #gold #nq #investing #trading #spytrading #spymarket #tradingmarket #stockmarket #silver

S&P 500 Setting Up for a Breakout – But Not Before One More TrapAs I’ve said before, the FOREXCOM:SPX500 is a key reference for my crypto trading . That’s why I sat down and took a closer look at the chart – and I’m now ready to place a limit order , based on what I’m seeing.
I believe we’re still in a correction phase , and it’s far from over . However, I think it’s realistic that we’ll see a move toward $5,832 next week . Before that happens, I expect either today’s Monday Low or next week’s Previous Weekly Low to get swept, ideally triggering a dip into the 12-hour Fair Value Gap just below.
That’s where I see my entry zone forming. It’s also the exact area where Wave B overshoots the starting point of Wave ABC, making it a clean Flat correction pattern, with Wave C completing to the downside before we get a solid move upward.
I’m setting my stop-loss below the $5,500 low. If this setup plays out, I expect the S&P to push toward $5,832 , and after that, I’m anticipating a larger correction that could take the index back down to $5,500 or even $5,450 over the coming weeks.
Timing remains unclear for that move after, but the structure is here , and I’m looking forward to seeing how it plays out.

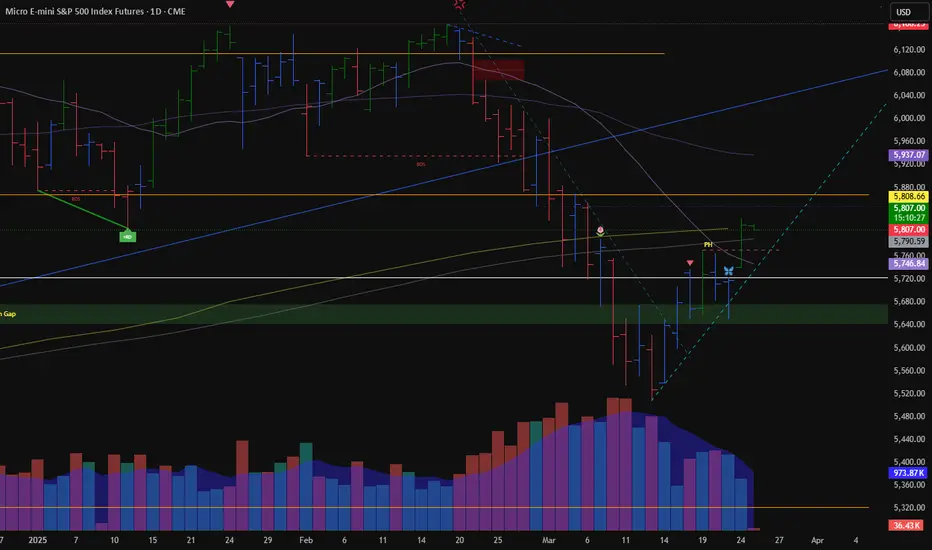
Looking for a minimum of ES 5850In the days to come our initial pattern off the recent has the high probability to get into the 5850 area.
Here I will be looking for a pullback.
If this pullback can be viewed as corrective in it's structure then I expect the subdivisions and pathway on my ES4Hr chart should follow suit. However, if the pullback turns out to be impulsive, I will be looking for follow through for either Minor B having completed early, or the alternate wave (iv). If that sort of price action were to materialize, it's Friday's low of 5651.25 that must support any drop if we're to continue to subdivide higher and have this minor B take more time.

S&P nearing the 38% retracement and flag top! Intraday Update: The S&P futures are up today following possible tariff news being factored in from some weekend headlines about "targeted reciprocal tariffs" for April 2nd, which is allowing for the S&P to near the 38% retracement which would be the top of the beer flag pattern and setup.
