US500 Bulls Assemble | Breakout Heist Strategy📈🚨 MASTER HEIST PLAN: “SPX500 ROBBERY – THIEF TRADING STYLE 🔥💸” 🚨📈
(The Ultimate Long Strategy Blueprint for Smart Day/Swing Traders)
🌍 Greetings to All Market Bandits, Bullish Burglars, and Chart Snipers!
Hola! Bonjour! Ola! Hallo! Marhaba! 🙌
🦹♂️This is your friendly chart thief checking in with the latest SPX500/US500 masterplan!
This isn’t just a trade—it’s a heist 🎯. We’re not here to participate, we’re here to dominate! Welcome to the Thief Trading Style, where we map, trap, and snatch those pips with ruthless precision. 🧠🔍💰
🚀 THIEF TRADE SETUP - SPX500/US500
A mix of technical sniper entries + fundamental black ops analysis = 💸 Maximum Extraction. 💸
🎯 ENTRY PLAN: THE BREAKOUT HEIST
📍Buy Entry Zone: Wait for the clean breakout + candle close above 6270.00.
"The vault opens once we clear that wall. Let the bullish getaway begin!" 💥🚪📈
🛠️Thief Tips for Entry:
Use Buy Stop Orders above resistance levels.
OR layer in Buy Limit Orders near recent pullbacks (15/30m swing zones) using DCA Style (Dollar Cost Average layering like a pro).
Want stealth mode? Set that alert (alarm), and strike when the breakout sings. 🔔🎯
🛑 STOP LOSS – PROTECT THE LOOT
🧨Set your SL smart—beneath the nearest swing low using the 2H timeframe for stronger structure.
💬 “Look, don’t gamble. A thief knows when to run. Set that stop where I showed ya, or risk losin’ the bag.” 💼💣
❗Your SL should reflect your risk per trade, lot size, and number of entries. It’s your getaway plan—don’t mess it up.
💥 TARGETS – WHERE WE CASH OUT
🏴☠️Primary Take Profit (TP1): 6310.00
🏴☠️Secondary Take Profit (TP2): 6370.00
💹 Scalp Traders: Stick to the Long Side Only. Ride the momentum, but use trailing SL to lock it in.
🔍 THIEF FUNDAMENTAL INTEL: WHY THIS IS OUR MOMENT
Current SPX500 bullishness driven by:
✅ Positive macro & geopolitical tailwinds
✅ Institutional positioning (COT reports)
✅ Intermarket analysis showing strong correlations
✅ Momentum building with sentiment and volume
📌 Stay sharp—check all your fundamental reports, news catalysts, and sentiment tools before executing your move. Smart thieves plan every detail. 🎓📊
⚠️ NEWS RELEASE REMINDER
📢 News = Chaos. Don’t get caught in the spray:
🔒Avoid entering trades just before big announcements.
🚀 Use Trailing SL to secure profit if you're already in.
Stay agile. Stay smart. Stay rich. 💼🚁
❤️ SUPPORT THE HEIST – HIT THAT BOOST BUTTON!
👊 Liked the plan? Hit the Boost to join the elite robbery crew.
Every boost fuels the mission. Every like sharpens the strategy. Let's build a team of smart, profitable traders. 🚀💸🔥
🧠 Remember: This is general analysis – not financial advice. Manage your risk like a true thief. Stay updated. Adapt fast. Don't get caught. 🕵️♂️
🎉See you in the next Heist Plan! Keep your tools sharp, your charts cleaner, and your profit bags fatter. 🤑🔥
S&P 500 (SPX500)

S&P 500 Counter-Trend Setup After Bullish Week US500Currently watching the S&P 500 (US500) closely 👀. The index has been in a strong bullish trend 📈, but I’m now evaluating a potential counter-trend opportunity.
Given the strength we’ve seen this week — possibly a “foolish rally” — there’s a chance we’ve either printed or are close to printing the high of the week 🧱. That opens the door for a retracement setup, particularly as we head into Monday’s open 🗓️.
🧠 Trade idea: If we get a bearish market structure break, I’ll be looking to enter short — targeting a 1R take profit initially, and holding a portion for a 2R–3R extension 🎯.
Friday sessions, especially after strong trends, often present clean intraday pullbacks — and when Monday’s low is set early, it can trap late buyers and fuel the move 📉.
⚠️ This is not financial advice — just sharing my thought process and trade plan.

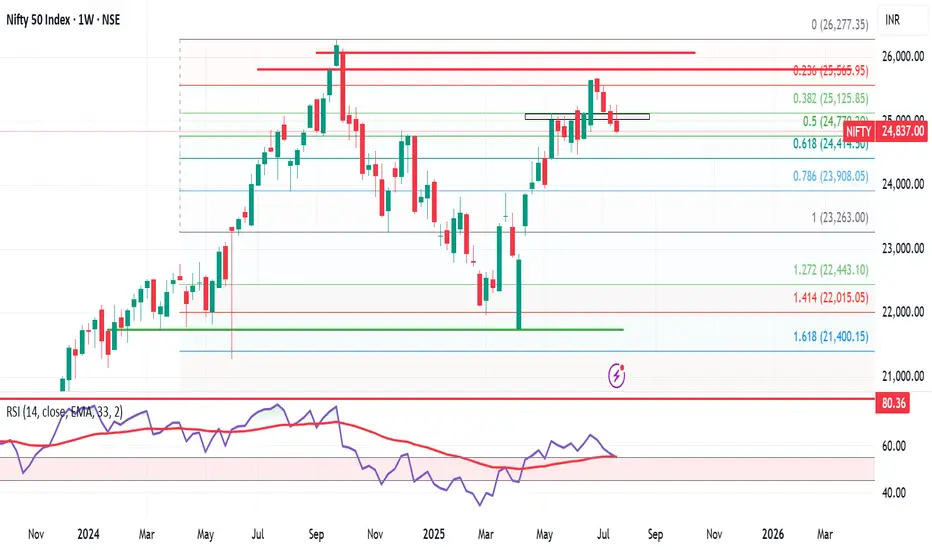
Nifty Weekly Market Update – Brace for Bearish Momentum? Nifty ended the week at 24,837, down 131 points from last week’s close. It made a high of 25,246 and a low of 24,806, staying perfectly within my projected range of 25,400–24,500.
As highlighted earlier, Nifty has now formed an inverted hammer on the weekly chart — a classic bearish reversal candlestick. 🔍
📅 Flashback: On 6th July, I mentioned giving bulls 10–15 days of playtime. That phase seems to be ending. The monthly time frame remains bearish, and now the weekly chart is aligning, indicating a stronger downside risk.
🔮 What’s Next?
👉 Expect Nifty to trade between 25,300–24,400 in the coming week.
👉 A break below 24,400 could open doors to 23,900.
👉 If 24,400 holds, bulls may still have a chance to regroup.
🧠 Pro Tip: Only Nifty Pharma is showing resilience. Those looking for long trades should focus on strong pharma stocks — the rest of the sectors are showing bearish signs.
Meanwhile in the US:
S&P 500 hits another all-time high, closing at 6,388, up 90 points from last week. My long-standing target of 6,568 now looks well within reach.
But here’s the catch — despite US strength, it’s not supporting Indian markets. If US markets correct, expect intensified selling pressure in India.
🎯 Strategy for Indian investors:
Let the bears rule till 7–8 August. Stay alert, and be ready to grab high-quality stocks at bargain prices. This is not the time to panic, but to prepare smartly.
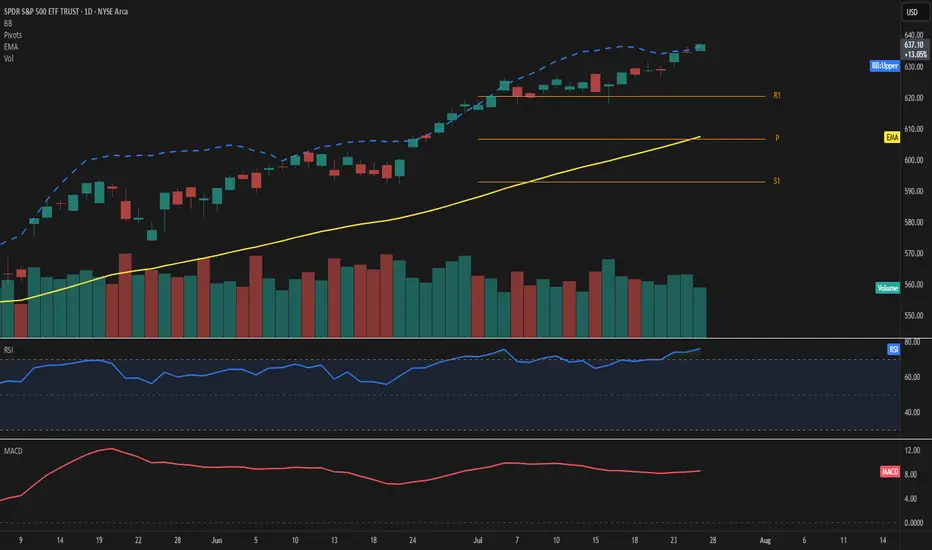
SPY – Explosive strength above resistancePrice extends well above the 50-day EMA and pierces through the upper Bollinger Band, highlighting strong bullish momentum. RSI stands at 76, confirming overbought conditions, while MACD remains firmly positive.
The ongoing move leaves the EMA50 at 608 and the Fibonacci pivot at 607—both now acting as key support levels. With R1 at 620 already surpassed, the next potential resistance zone lies in uncharted territory beyond 636.
Volume has decreased by over 20%, which tempers the move slightly and should be monitored closely.
As long as price holds above 620, the bullish scenario remains valid.
Watch for any sudden spike in volume or a drop back below 636 as a possible shift signal.
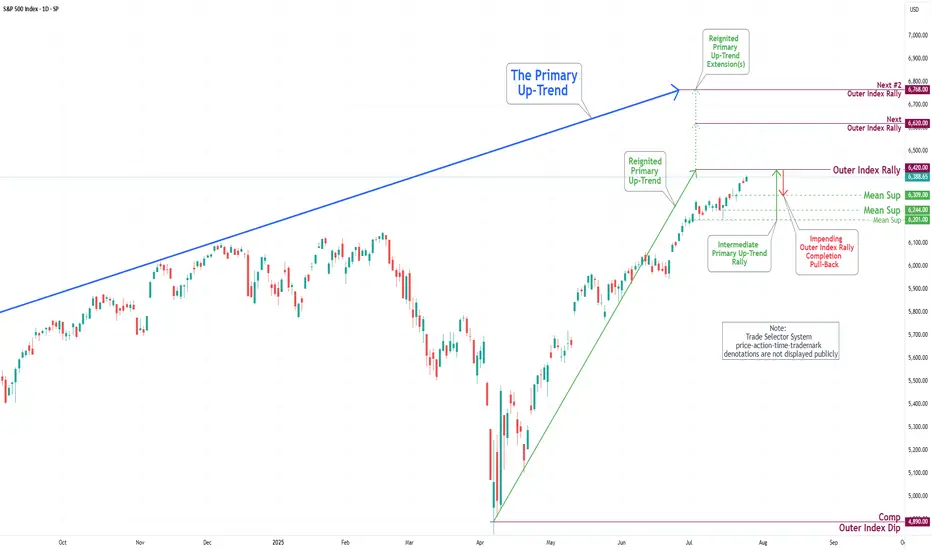
S&P 500 Daily Chart Analysis For Week of July 25, 2025Technical Analysis and Outlook:
In the trading activity observed last week, the S&P 500 Index exhibited a predominantly upward trajectory. It traded around the Key Resistance level of 6314. It successfully broke through this level, with the primary objective being to complete the Outer Index Rally at 6420, as outlined in the previous week's Daily Chart Analysis.
It is crucial to acknowledge that the current price movement may prompt a substantial pullback following the completion of the Outer Index Rally, with the main target identified as the Mean Support level of 6309. Following this potential downward adjustment, it is anticipated that the index will resume its upward trend, targeting a retest of the forthcoming completion of the Outer Index Rally at 6420.
SPX chit chat... we're still up for nowAfter that crazy April 2025 crash, it feels like we should not be this high so fast... that's how I felt before too. But the rising channel is holding up right now. We are approaching the top. In previous times, the market grinded even higher (COVID pandemic was the last example).
Today we squeezed out new ATHs. The month ends next week and a new one begins. Less fear; more charts for the rest of the year.
See you in August!

S&P 500 (CASH500) - Double Top H1Risk/reward = 2.7
Entry price = 6388.4
Stop loss price = 6399.7
Take profit level 1 (50%) = 6360.4
Take profit level 2 (50%) = 6352
Also, waiting on confirmation on some variables

S&P500 (CASH500) SHORT - head and shoulders 30minRisk/reward = 4.1
Entry price = 6378
Stop loss price = 6385.9
Take profit level 1 (50%) = 6349.2
Take profit level 2 (50%) = 6337.2
Still waiting on confirmation of a few variables at close of this 30min candle at 17.00

S&P (CASH500) SHORT - Double top 30minRisk/reward = 2.7
Entry price = 6384
Stop loss price = 6393.8
Take profit level 1 (50%) = 6359.8
Take profit level 2 (50%) = 6351.8
Will get confirmation of remaining variables at close of this 30min candle at 19.30.
Extended rally off April lows should be completing imminentlyEvery so often, a market move defies conventional expectations of retracement—and the rally off the Liberation Day lows is exactly that. It’s extended longer and climbed higher than even the most bullish forecasts imagined in early April. No one remembers the calls for an imminent recession by most large Wall Street firms.
Now, we're pushing into yet another all-time high—despite glaring negative MACD divergence and a financial media landscape that’s nothing short of euphoric.
The narratives being pushed? Honestly, it’s hard to write them with a straight face:
Tariffs are no longer inflationary. Apparently, I wasted time and tuition learning international trade theory and macroeconomics. Who knew deficits and trade imbalances didn’t matter anymore? Who pays tariffs again? ...never mind.
Weak momentum since mid-May signals not exhaustion—but an “unhealthy absence” of institutional selling, which apparently means the retail trader is in full control now. Because that always ends well... right?
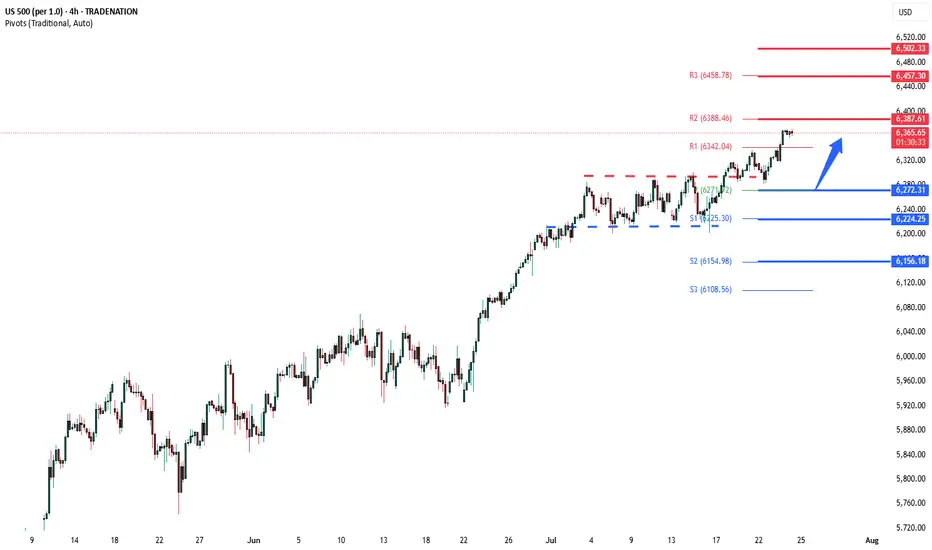
S&P500 push to new ATH? Key Developments:
AI Drives Earnings Momentum
Alphabet reported strong results, but flagged surging AI infrastructure costs, signaling increased capex ahead.
SK Hynix posted record earnings and committed to expanding AI-related investments, reinforcing the sector’s critical growth role.
Investor sentiment remains AI-positive, with capital rotation favoring tech and semiconductors despite margin compression risks.
Banking Sector Boosted by Tariff-Driven Volatility
Deutsche Bank’s FIC (Fixed Income & Currencies) trading revenue jumped 11% to €2.28B, its best Q2 since 2007, aided by global trade uncertainty.
BNP Paribas also beat earnings estimates, continuing the strong showing from European banks amid market volatility.
Trade & Tariff Watch
The EU and US are nearing a deal on a 15% standard tariff rate, potentially stabilizing trade flows and market pricing.
Trump’s broader reciprocal tariff push remains in focus, especially after the US-Japan deal. Investors are watching for signs of escalation or resolution with other partners like the EU and Canada.
Fed in the Political Spotlight
Trump visited the Fed’s construction site, criticizing costs and maintaining pressure on Chair Jerome Powell.
Speculation about Fed leadership changes and political interference is unsettling, though markets have largely shrugged this off for now.
Meanwhile, House Republicans are drafting a follow-up tax-and-spending plan, which could shape future fiscal policy and market expectations.
Conclusion: S&P 500 Trading Outlook
The S&P 500 remains buoyed by strong earnings, particularly from AI-linked sectors and financials, while geopolitical risks and tariff volatility are being absorbed as catalysts for trading profits rather than panic.
Bullish factors: Strong corporate earnings (Alphabet, SK Hynix, Deutsche Bank), potential trade de-escalation (EU-US tariff deal), and AI momentum.
Risks to monitor: Rising AI capex (impact on margins), political tension around the Fed, and tariff uncertainty.
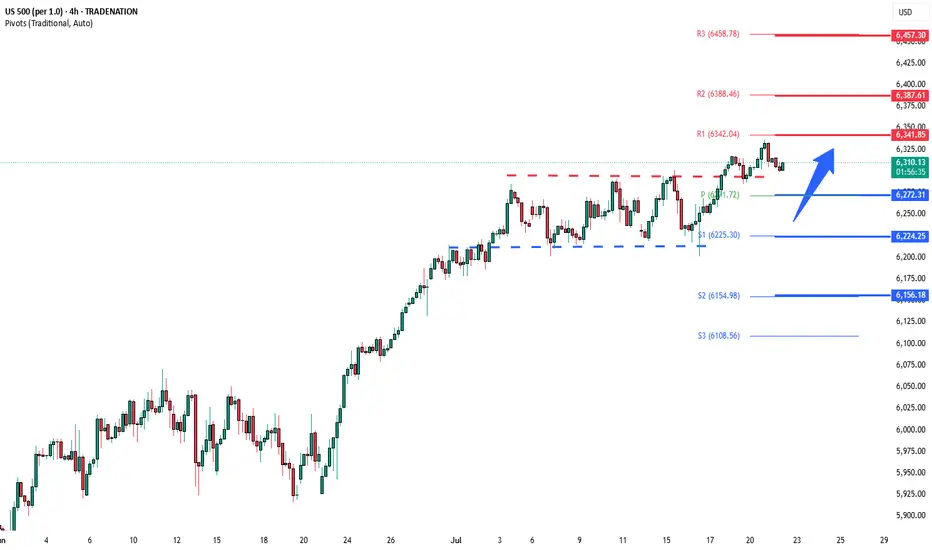
Key Support and Resistance Levels
Resistance Level 1: 6387
Resistance Level 2: 6457
Resistance Level 3: 6502
Support Level 1: 6272
Support Level 2: 6224
Support Level 3: 6156
This communication is for informational purposes only and should not be viewed as any form of recommendation as to a particular course of action or as investment advice. It is not intended as an offer or solicitation for the purchase or sale of any financial instrument or as an official confirmation of any transaction. Opinions, estimates and assumptions expressed herein are made as of the date of this communication and are subject to change without notice. This communication has been prepared based upon information, including market prices, data and other information, believed to be reliable; however, Trade Nation does not warrant its completeness or accuracy. All market prices and market data contained in or attached to this communication are indicative and subject to change without notice.
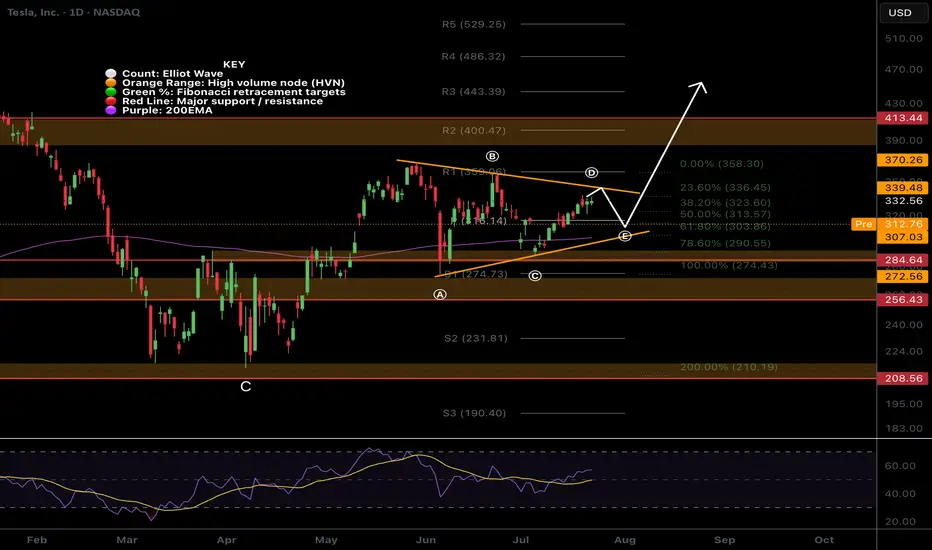
$TSLA Triangle?NASDAQ:TSLA triangle has presented itself with the recent price action. Triangle pattern target is $443 at the R3 daily pivot.
Wave e is expected to end at the daily pivot and wave d break is the signal to go long.
Analysis is invalidated below wave c.
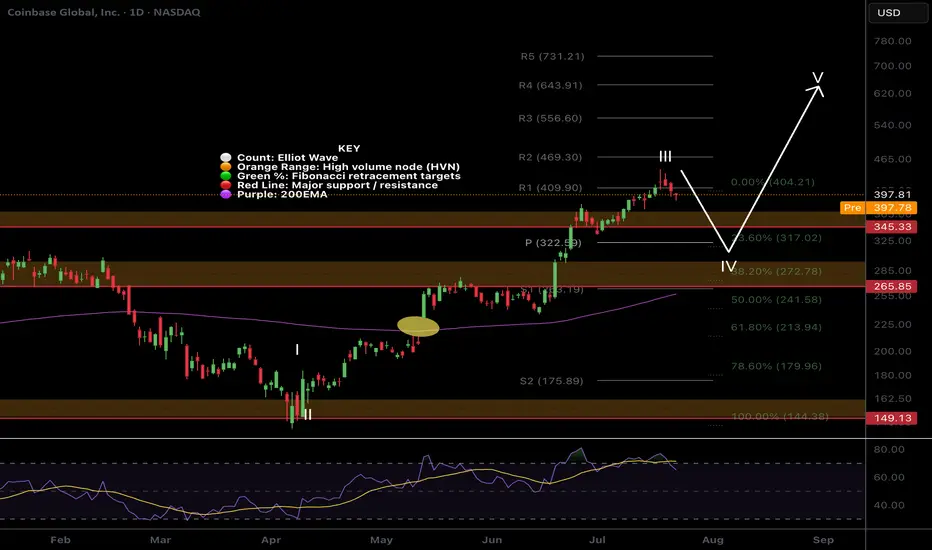
$COIN Wave 4 pullback?NASDAQ:COIN had a tremendous run, a text book Elliot wave 3 but has confirmed bearish divergence on the daily RSI.
The trend is strong so wave 4 could be shallow, only reaching the previous all time high, High Volume Node and 0.236 Fibonacci retracement and daily pivot point between $322-345
Further decline brings up the High Volume Node support at 0.382 Fib retracement and ascending daily 200EMA! Also a highly probable scenario!
Long term outlook remains around $600 target
Safe trading.
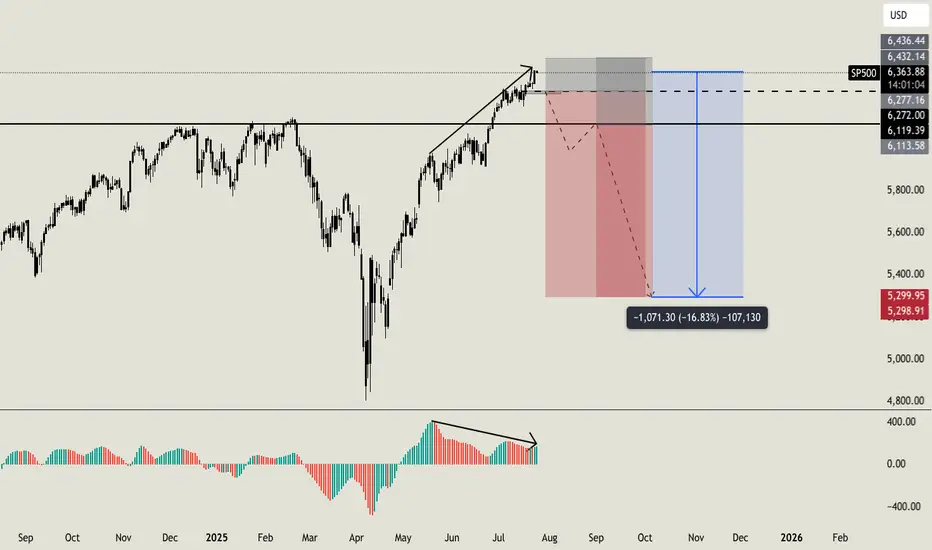
Do you want to keep buying SP500?Hello all. I usually love to work analyzing volumes, times and key level, i am not used to check the standard indicators, but this time i'll made an exception. Lot of indicators (AO, MACD, RSI, OBV) are showing weakness on higher timeframe with a strong bearish divergence (like the one i am sharing now on AO). On smaller timeframe i usually ignore this signals, because they can result in a little retrace, but on higher timeframe like this one can be a strong reversal indicator. But this is not the only things that let me open this position. Going deeper into my analysis, i have a first key level at $6270. Once we will break below this level, i'll open my first sell order with a stoploss a little higher than ATH. If price will break below my second key level at $6120 i'll open my second short order. My main and final target is $5300 (around -16% from now) but i will consider to secure profits before this level. I'll update you guys, and let me know if you are agree with me or not. Cheers
S&P 500 (CASH 500) SHORT - Double top H8Risk/reward = 4.1
Entry price = 6343.3
Stop loss price = 6365.3
Take profit level 1 (50%) = 6268.1
Take profit level 2 (50%) = 6232.1
Still waiting on some variables on checklist to be confirmed before I enter the trade.

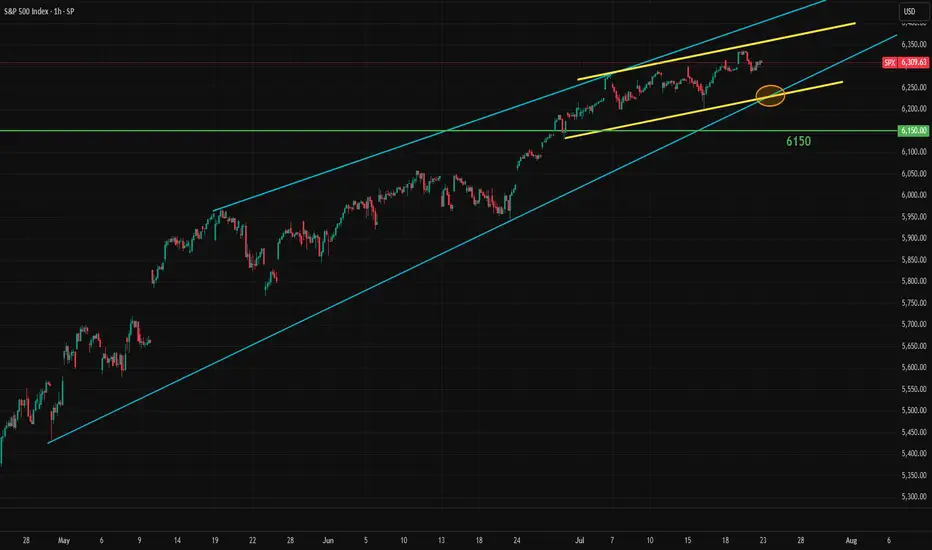
Market Breadth Flashes Warning, but S&P 500 Still Holds SteadyThe S&P 500 continues its slightly positive movement. However, the momentum has been slowing, forming a long, wedge-like pattern. These long wedges have been a recurring feature in the stock market for years. From the monthly timeframe to the 1-hour chart, the market often forms wedges.
Wedge formations tend to break to the downside but can persist for a long time before doing so. The S&P 500 typically makes a sharp correction selloff, then recovers in a "V" shape, followed by the formation of another wedge. This pattern appears to be repeating once again. Still, there are some negative signals that traders should be aware of:
1- The impact of tariffs on growth remains a major unknown. Most tariff deals have not been finalized yet. While the Japan agreement is a positive step, negotiations with the EU will be more significant.
2- Many earnings reports will be released in the coming weeks, potentially shaping market sentiment. These earnings will reflect some of the tariff effects. AI and tech remain the key market drivers, so their results will be especially important.
3- Some breadth indicators are showing early warning signs. One of the most useful is the "percentage of stocks above the 200-day moving average." This metric shows whether the market is broadly participating in the rally or being driven by a few large-cap names. Typically, when the market weakens, traders rotate into mega caps. The rounded numbers below shows the weakness:
March 2024 Top: 5250 - Percantege Above 200 MA: 85%
July 2024 Top: 5675 - Percantege Above 200 MA: 80%
December 2024 Top: 6100 - Percantege Above 200 MA: 74%
July 2025 Current: 6309 - Percantege Above 200 MA: 66%
This shows that fewer and fewer stocks are managing to stay above their 200-day moving average while S&P making new highs. This is not an immediate red flag, but the weakening is apparent.
In summary, the slightly positive outlook remains intact for now and is expected to continue until the wedge breaks with some early warning signs. If that happens, a sharp selloff may follow, creating both selling and buying opportunities. In the short term, 6280 is the immediate support level to watch.
Expect Correction august/septemberMarkets MUST correct, everything is overbought and sentiment is Extreme greed. RSI points to extreme overbought territory, VIX very low and not going any lower (reached bottom).
Usually august/september the market corrects. so i expect a correction around 5-8%.
Be prepared, dont chase FOMO. Be careful.
SP:SPX TVC:SPX CBOE:SPX CBOE:XSP AMEX:SPY

S&P500 (CASH500) SHORT - Head and shoulders Risk/reward = 5.8
Entry price = 6321.1
Stop loss price = 6333.5
Take profit level 1 (50%) = 6257.3
Take profit level 2 (50%) = 6234.9
Still waiting for confirmation on a few variables before I enter the trade.
S&P500 sideways consolidation breakoutKey Developments:
Fed Politics: Treasury Secretary Scott Bessent called for a review of the Fed’s $2.5B HQ renovation, continuing political pressure on Jerome Powell. This adds to the uncertainty around Fed independence and rate path.
Meme Stock Surge:
Opendoor soared 121% amid a retail-driven frenzy.
Major institutional investors are also chasing the rally, pushing broader equities to record highs.
However, upcoming Alphabet and Tesla earnings could be a turning point for momentum.
Corporate News:
Hewlett Packard Enterprise suffered a $985M loss in the Autonomy case—corporate governance and M&A risks in spotlight.
Sarepta paused drug shipments amid backlash—biotech volatility rising.
LA Times plans IPO—media valuations may resurface.
Crypto Moves:
Trump Media bought $2B in Bitcoin and related assets, aiming to become a crypto treasury.
JPMorgan may lend against crypto, signaling broader institutional adoption.
Tech & AI:
MIT’s Andrew Lo predicts AI will make real investment decisions in 5 years.
OpenAI–Oracle to expand US data center capacity by 4.5 GW—significant tech infrastructure tailwind.
Conclusion for S&P 500 Trading:
The S&P 500 remains supported by strong risk appetite, AI optimism, and crypto momentum, but faces near-term tests from key tech earnings (Alphabet, Tesla). Political noise around the Fed and signs of speculative froth (meme stocks) could introduce volatility. Stay bullish with caution—watch earnings and Fed commentary closely for market direction.
Key Support and Resistance Levels
Resistance Level 1: 6340
Resistance Level 2: 6390
Resistance Level 3: 6457
Support Level 1: 6270
Support Level 2: 6224
Support Level 3: 6156
This communication is for informational purposes only and should not be viewed as any form of recommendation as to a particular course of action or as investment advice. It is not intended as an offer or solicitation for the purchase or sale of any financial instrument or as an official confirmation of any transaction. Opinions, estimates and assumptions expressed herein are made as of the date of this communication and are subject to change without notice. This communication has been prepared based upon information, including market prices, data and other information, believed to be reliable; however, Trade Nation does not warrant its completeness or accuracy. All market prices and market data contained in or attached to this communication are indicative and subject to change without notice.
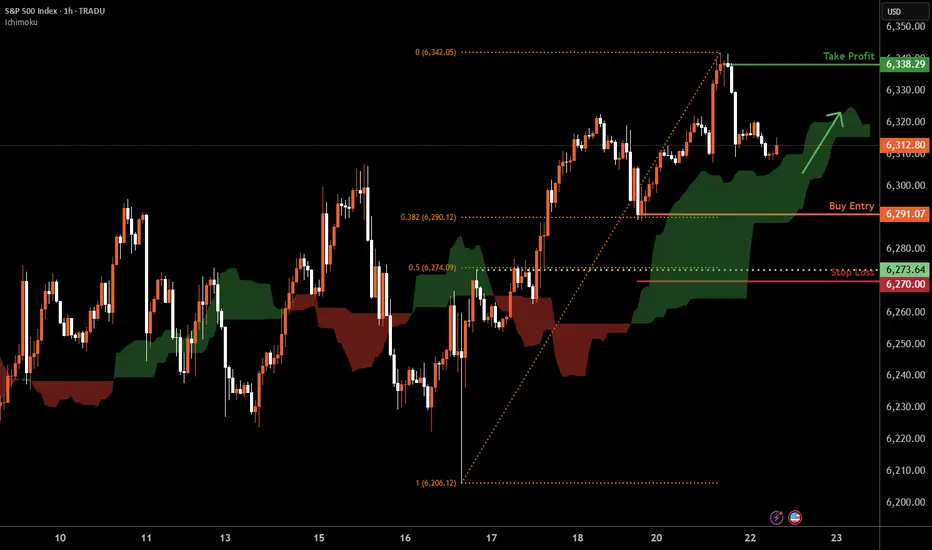
S&P 500 H1 | Swing-low support at 38.2% Fibonacci retracementThe S&P 500 (SPX500) is falling towards a swing-low support and could potentially bounce off this level to climb higher.
Buy entry is at 6,291.07 which is a swing-low support that aligns with the 38.2% Fibonacci retracement.
Stop loss is at 6,270.00 which is a level that lies underneath a pullback support and the 50% Fibonacci retracement.
Take profit is at 6,338.29 which is a swing-high resistance.
High Risk Investment Warning
Trading Forex/CFDs on margin carries a high level of risk and may not be suitable for all investors. Leverage can work against you.
Stratos Markets Limited (tradu.com ):
CFDs are complex instruments and come with a high risk of losing money rapidly due to leverage. 66% of retail investor accounts lose money when trading CFDs with this provider. You should consider whether you understand how CFDs work and whether you can afford to take the high risk of losing your money.
Stratos Europe Ltd (tradu.com ):
CFDs are complex instruments and come with a high risk of losing money rapidly due to leverage. 66% of retail investor accounts lose money when trading CFDs with this provider. You should consider whether you understand how CFDs work and whether you can afford to take the high risk of losing your money.
Stratos Global LLC (tradu.com ):
Losses can exceed deposits.
Please be advised that the information presented on TradingView is provided to Tradu (‘Company’, ‘we’) by a third-party provider (‘TFA Global Pte Ltd’). Please be reminded that you are solely responsible for the trading decisions on your account. There is a very high degree of risk involved in trading. Any information and/or content is intended entirely for research, educational and informational purposes only and does not constitute investment or consultation advice or investment strategy. The information is not tailored to the investment needs of any specific person and therefore does not involve a consideration of any of the investment objectives, financial situation or needs of any viewer that may receive it. Kindly also note that past performance is not a reliable indicator of future results. Actual results may differ materially from those anticipated in forward-looking or past performance statements. We assume no liability as to the accuracy or completeness of any of the information and/or content provided herein and the Company cannot be held responsible for any omission, mistake nor for any loss or damage including without limitation to any loss of profit which may arise from reliance on any information supplied by TFA Global Pte Ltd.
The speaker(s) is neither an employee, agent nor representative of Tradu and is therefore acting independently. The opinions given are their own, constitute general market commentary, and do not constitute the opinion or advice of Tradu or any form of personal or investment advice. Tradu neither endorses nor guarantees offerings of third-party speakers, nor is Tradu responsible for the content, veracity or opinions of third-party speakers, presenters or participants.
July 21 Special Update : Metals, SPY & More. What's Next.This special update is to highlight why I continue to believe traders should stay very cautious of this rally in the SPY/QQQ/BTCUSD.
Underlying economic data suggest that this is one big speculative rally following the April Tariff collapse.
And, the economic data I see from my custom indexes suggests the markets are moving into a very volatile and potentially dangerous topping pattern.
As I've stated many times in this video. I'm not saying the markets have topped and you should SELL EVERYTHING. I'm suggesting this market is extremely over-valued in terms of the underlying risk factors at play and the very clear data that suggests the markets are already in a recessionary price trend.
You may ask, "How can the markets continue to rally like this in a moderate recession?".
The answer is simple.
All bubbles end with a super-speculative phase. This phase is where everyone piles into a euphoric attempt to ride the rally higher.
It happened in the late 1990s. It has happened again through the 2000-2005+ housing bubble. Heck, it has occurred in the collectors market over the past few decades where people spent fortunes on the "hottest items" (think Beanie-Babies) only to find out they bought at the height of the bubble.
That is why I continue to urge traders to remain cautious and to withdraw profits from this speculative rally phase. Protect your investment capital immediately and consider the risks associated with the information I share in this video.
I'm not trying to scare anyone. I'm just trying to be realistic in terms of what I see in my data and why I believe now is the best time to MOVE TO SAFETY.
My data suggests that the markets are about to enter a fragile and potentially dangerous pullback phase. If you want to ride it out - go for it.
Otherwise, prepare for significant volatility over the next six months or more.
Get some.
#trading #research #investing #tradingalgos #tradingsignals #cycles #fibonacci #elliotwave #modelingsystems #stocks #bitcoin #btcusd #cryptos #spy #gold #nq #investing #trading #spytrading #spymarket #tradingmarket #stockmarket #silver

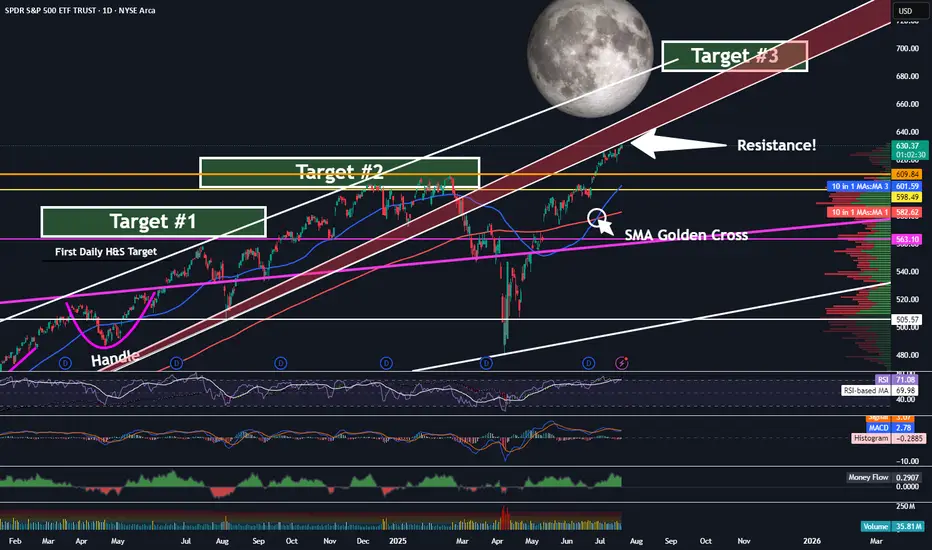
SPY - On Our Way To Target 3 ...But First?Trading Fam,
It's been a while since I updated you all on the SPY, which, as you know, we track closely to help us determine the overall market trend. Since we have now exceeded my Target #2, it's time for me to give you all another update. But first, a little context for my new readers which I have been getting a lot of recently, thanks to my new indicator hitting it out of the park.
So, we began marking targets on our chart here after spotting an inverse H&S on the daily chart a few years ago. Many of my followers back then were doubtful the pattern would fully form, or if it did, that it would actually play out. But the pattern completed about 14 months ago and subsequently broke the neckline in June of last year. I then knew we were going full send and have been predicting a 700 SPY final target since. This target has been made utilizing both that inverse H&S pattern as well as a longer-trend Elliot Wave, which I don't have denoted here at this point. The chart gets too messy with all of my markings. Regardless, we are currently in wave 5 and heading steadily towards that 670-700 target #3, my final target.
But be careful! Today, we have hit the underside of that RED area, which is HUGE resistance. I would expect that we will NOT break straight through this without some pullback prior. Indeed, the market is overextended at this moment, and we'll need the volume to be able to push through. Could this occur? Of course, anything is possible. But, it is not likely right now.
My guess is that we'll at least pull back to one of those levels below us or possibly even re-touch that 200 SMA in red before the final push.
Anyways, it is worth taking note of what may be ahead of us in the next few weeks or months so that you can plan your trades accordingly. Stay with me. We're almost there.
✌️Stew
SPX: Banks beat, stocks peakThe US equity markets remained relatively resilient this week, despite ongoing concerns about trade policy developments. After last week’s slight retreat from its all-time high, the S&P 500 resumed its upward momentum early in the week, continuing to hover near record levels. The index reached a new highest level of 6,315 on Friday before pulling back slightly, closing the week at 6.296.
Bank earrings were in focus of investors during the previous week. Overall, Q2 reports from major U.S. banks showed resilience — better-than-expected earnings, strong interest income, and robust capital actions. So far, the finance sector has seen Q2 earnings rise around 13% y/y and 3,4% revenue growth. In addition, a stress test posted by Fed underpin confidence as all major banks, including JPMorgan and Citi showing resilience also under potential stress conditions. However, both bankers and investors held a cautious tone on macro/public policy risk.
Investors' confidence was additionally boosted by better than expected US macro data posted during the previous week. The inflation rate in June was 0,3% for the month and 2,7% on a yearly basis. At the same time, retail sales beat market expectations with an increase of 0,6% in June. As per analysts reports, currently 27 stocks included in the S&P 500 are trading at the all time highest levels. The ADM company, which is well known for producing Coca Cola, had a drop in the value of shares of 2% after the US President requested from the company to use real cane sugar in their popular drink.
From July 23st a composition of companies included in the S&P 500 index will be changed. A crypto company Block will be included, while the company Hess will be excluded from the index. Shares of the Blok surged by 10% on Friday, after the release of the news.
