NAS100 | Distribution ContinuationPrice is awaiting a movement towards $18,000 and currently in a distribution phase.
S&P 500 (SPX500)

US Technology Sector Futures. The Heartbreak HotelPresident Donald Trump's tariffs on imported tech goods, targeting China, the EU, Canada, and Mexico, are reshaping the U.S. technology sector through higher costs, supply chain disruptions, and retaliatory trade risks. While intended to boost domestic manufacturing and reduce trade deficits, these measures are creating immediate economic strain across critical industries. Below is an analysis of their key negative impacts:
Rising Consumer Prices and Hardware Costs
The 25% tariff on EU semiconductors, 10% levy on Chinese goods, and 25% duties on Canadian/Mexican imports are projected to add $50 billion in new costs to North American tech supply chains. This directly affects consumer electronics:
Smartphones and laptops. Apple’s iPhone production in China exposes it to 10% tariffs, likely forcing U.S. price hikes.
Semiconductors. The U.S. relies on China and Taiwan for 80% of 20-45nm chips and 70% of 50-180nm chips, with tariffs disrupting access to essential components.
Cloud/AI infrastructure. Steel and aluminum tariffs (25%) increase data center construction costs, potentially raising prices for AWS, Google Cloud, and Microsoft Azure services.
Experts warn companies may pass 60-100% of tariff costs to consumers rather than absorb profit losses.
Supply Chain Disruptions and North American Integration
The tariffs jeopardize tightly integrated North American production networks:
Cross-border dependencies. Components often cross U.S.-Mexico or U.S.-Canada borders multiple times during manufacturing. Christine McDaniel of the Mercatus Center notes this integration means tariffs “hurt the pricing power of the U.S.” by inflating domestic costs.
Critical material shortages. Canada supplies nickel and cobalt for batteries, while Mexico handles assembly for firms like Foxconn. Tariffs risk delays and renegotiations with suppliers.
Retaliatory measures. The EU may respond with fines or trade barriers against U.S. tech giants like Apple and Google, escalating tensions.
Sector-Specific Challenges
Semiconductors and Hardware
Chip shortages. With limited domestic foundry capacity, tariffs on EU semiconductors threaten AI development and device manufacturing.
Networking equipment. Proposed 10% tariffs on Chinese-made routers and modems could disrupt cloud providers reliant on these components.
Data Centers and AI
Construction delays. Steel/aluminum tariffs increase costs for server racks and cooling systems, potentially delaying $80 billion in planned U.S. data center investments.
AI infrastructure. Projects like the $500 billion Stargate initiative face higher expenses for imported components, slowing AI adoption.
Macroeconomic Risks
Trade deficit growth. Despite tariffs aiming to reduce the $1 trillion U.S. goods trade deficit, S&P Global warns retaliatory Chinese tariffs could worsen imbalances.
Job losses. Economic modeling suggests tariffs may cost 125,000+ U.S. tech jobs through reduced consumer spending and IT budget cuts.
Innovation slowdown. While firms like TSMC and Intel accelerate U.S. fab construction, short-term supply chain reallocations divert R&D funding.
Corporate Responses and Limitations
Some companies are attempting mitigation strategies:
Stockpiling. NVIDIA and AMD are urging partners to increase pre-tariff production.
Domestic shifts. Apple plans $500 billion in U.S. manufacturing, while TSMC pledged $160 billion for stateside fabs.
However, these efforts face scalability issues. Building advanced chip foundries takes 3-5 years, leaving gaps in critical components. Meanwhile, 65% of IT firms report difficulty finding tariff-free alternatives for Chinese inputs.
Technical challenge
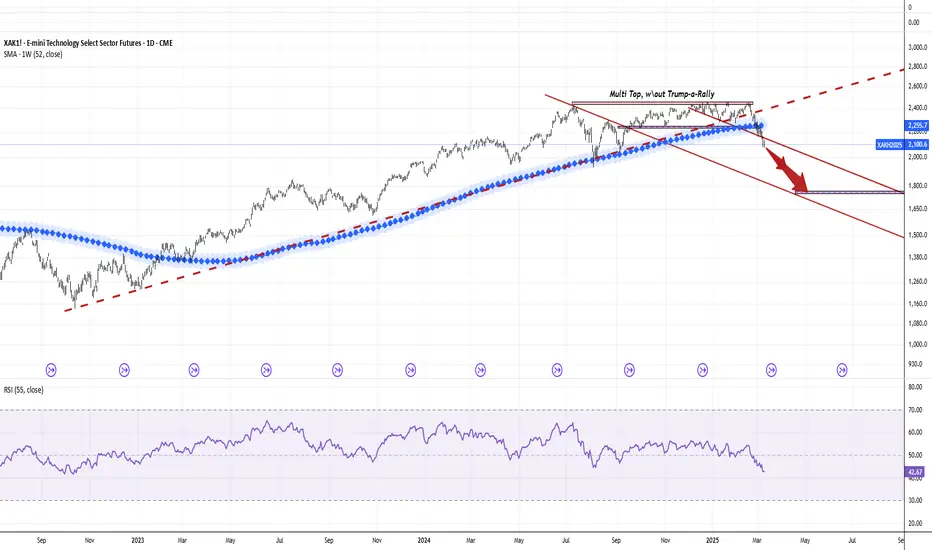
The main technical graph for US Technology Select Sector Futures CME_MINI:XAK1! (CME Group mode of AMEX:XLK - SPDR Select Sector Fund - S&P500 Technology ETF) indicates on further Bearish market in development since major support of 52-week SMA has been broken already, with possible upcoming Bearish cascade effects in the future.
It is also important to note the almost complete absence of a Trump-a-rally in the 2024 holiday quarter, which contributed to the formation of a multi-resistance top.
Conclusion
While the tariffs aim to strengthen U.S. tech autonomy, their immediate effects—higher prices, supply instability, and strained international relations—outweigh potential long-term benefits. With global IT spending still projected to grow 9% in 2025, the sector’s resilience is being tested by policy-driven headwinds that threaten America’s competitive edge in semiconductors, AI, and consumer electronics.
Investing in S&P500 Technology Sector Futures / ETFs seeks to provide precise exposure to companies from technology hardware, storage and peripherals; software; communications equipment; semiconductors and semiconductor equipment; IT services; and electronic equipment, instruments and components industries; allows investors to take strategic or tactical positions at a more targeted level than traditional wide style based investing.
S&P500 Technology Sector Futures / ETFs are designed for investing at a more targeted Technology level, since nearly 50 percent of holdings weight just a five well-known names:
Name Weight
APPLE INC NASDAQ:AAPL 15.61%
MICROSOFT CORP 12.83%
NVIDIA CORP NASDAQ:NVDA 11.91%
BROADCOM INC NASDAQ:AVGO 5.18%
SALESFORCE INC NYSE:CRM 3.11%
--
Best 'Heartbreaking' wishes,
@PandorraResearch Team 😎
SPY/QQQ Plan Your Trade For 3-18-25 : Gap Reversal Counter-TrendFirst off, thank you for all the great comments and feedback. I really love hearing from TradingView subscribers and how my research is helping everyone find success.
Just recently, I received some DMs from viewers saying my research has been "dead on" - which is great.
One thing is for sure, the big move in Gold/Silver is just getting started.
Today's SPY Cycle Pattern is a Gap-Reversal in a Counter Trend mode. The long-term & short-term bias is currently BEARISH - so I believe the GAP Reversal will be to the upside.
Meaning, I suggest we start the day with a mild lower GAP - followed by a moderate price reversal in early trading, leading to a continued melt-up type of trend for the SPY/QQQ
Gold and Silver are likely to attempt to melt a bit higher into the TOP pattern for today. I believe this is just a temporary resistance level for metals.
Bitcoin is struggling to find upward momentum - but I believe BTCUSD still has a $3k-$5k rally left to reach the current Consolidation highs. We'll see if it breaks higher over the next 3-5 days before rolling over into a new downtrend.
Again, I really appreciate all of my followers and viewers. I want all of you to learn to see, read, and understand price action more clearly than ever before.
That's why I don't use any technical indicators on my chart. I want you to understand PRICE is the ultimate indicator.
Get some..
#trading #research #investing #tradingalgos #tradingsignals #cycles #fibonacci #elliotwave #modelingsystems #stocks #bitcoin #btcusd #cryptos #spy #gold #nq #investing #trading #spytrading #spymarket #tradingmarket #stockmarket #silver

SPX500 Move Up Expected!
HI,Traders !
SPX500 made a bullish
Breakout of the key horizontal
Level of 5640.66 and the
Breakout is confirmed
Because the daily candle
Closed above the key level
So on the market open
We will be expecting a
Local pullback and then
A strong move up !
Comment and subscribe to help us grow !

D-Wave Quantum (QBTS): Seeking New All-Time Highs!
Stocks such as Rigetti Computing Inc., Quantum Computing Inc., D-Wave Quantum Inc., and IonQ Inc. have all seen triple-digit gains over the past six months and over the past year. The exchange-traded fund that tracks these stocks, the Defiance Quantum ETF, increased 26.29% over the past six months and 53.69% over the past year. Specifically, D-Wave Quantum Inc. (NYSE: QBTS) increased 405.22% over the past six months and 718.31% over the past year.
Since these quantum computing companies are still in their growth phase and currently have negative earnings, it is not possible to use the price-earnings ratio to estimate their valuation. However, the price-to-sales ratio, which is found by dividing a company's market capitalization by its total sales, can be used to value these companies.
According to Bloomberg data, QBTS's P/S ratio is 104.63.
---> What is the company's technical outlook?
Looking at the table, the company is CLEARLY BULLISH on its main timeframes. Today, it stopped right at a VERY IMPORTANT RESISTANCE level located at 11.97, which also coincided with the day's PIVOT POINT R2.
If it breaks above the 12 level, it would directly test the 13.26 level, its all-time high reached on August 8, 2022.
--> What risks do we face?
The biggest risks observed are:
1) Bad news that may come out about the company or its sector (quantum computing).
2) The high appreciation they have experienced over the last year.
3) That today it reached its first major resistance to overcome and could begin a pullback to attack the zone again.
--> What happens if it starts to pull back?
I've drawn the Fibonacci retracements on the chart to give us an idea of the areas the price could fall to if it were to start a pullback, but as long as it doesn't lose the 7 zone, its upward trend will remain intact.
Best regards and good trading to all.
----------------------------------------------------------------------
**** The small chart above is the WEEKLY timeframe to get a global view of the price.
----------------------------------------------------------------------

Gamma Exposure on SPXToday marks the first day in a long time where we can observe some green, bullish levels on gamma exposure. The daily GexView indicator displays thin green lines, which represent the gamma exposure of zero-days-to-expire contracts. The thick lines, on the other hand, represent the total gamma exposure across all expiration contracts. This is a promising first step, especially if these lines persist over the next few days and continue to develop further.

The Bigger Picture5300 area still looks like it will be possible sometime next week. I explain the leading diagonal count and why I think another ABC down is likely.

S&P INTRADAY bearish & oversold capped by resistance at 5715Key Support and Resistance Levels
Resistance Level 1: 5715
Resistance Level 2: 5770
Resistance Level 3: 5920
Support Level 1: 5500
Support Level 2: 5390
Support Level 3: 5255
This communication is for informational purposes only and should not be viewed as any form of recommendation as to a particular course of action or as investment advice. It is not intended as an offer or solicitation for the purchase or sale of any financial instrument or as an official confirmation of any transaction. Opinions, estimates and assumptions expressed herein are made as of the date of this communication and are subject to change without notice. This communication has been prepared based upon information, including market prices, data and other information, believed to be reliable; however, Trade Nation does not warrant its completeness or accuracy. All market prices and market data contained in or attached to this communication are indicative and subject to change without notice.

SPY/QQQ Plan Your Trade Video for 3-17: GAP PotentialAs we start moving into the Excess Phase Peak pattern consolidation phase, I believe the SPY/QQQ will attempt a moderate rally for about 3-5+ days, then roll into a deep selling mode after March 21-24.
I don't believe we have reached a bottom - yet.
I do see a lot of people talking about "the bottom is in" and I urge all of you to THINK.
What do you believe will be the basis of US and GLOBAL economic growth starting RIGHT NOW?
Can you name one thing that will be the driver of economic expansion and activity?
I can't either.
Thus, I suggest traders prepare for more sideways consolidation range trading over the next 60+ days as hedge assets and currencies attempt to balance risks.
BTCUSD, Gold, Silver should all be fairly quiet this week. I'm not expecting any huge price moves this week.
I expect the SPY/QQQ & BTCUSD to move a bit higher while Gold and Silver melt upward a bit further.
Then, after March 21, I expect bigger volatility and a broad rotation in the SPY/QQQ/Bitcoin where Gold/Silver will start a bigger move higher.
Get some.
#trading #research #investing #tradingalgos #tradingsignals #cycles #fibonacci #elliotwave #modelingsystems #stocks #bitcoin #btcusd #cryptos #spy #gold #nq #investing #trading #spytrading #spymarket #tradingmarket #stockmarket #silver

S&P 500 : How Long Could the Stock Market Correction Last?S&P 500 Analysis: How Long Could the Stock Market Correction Last?
Six days ago, we noted that the Nasdaq 100 had entered a correction phase. Now, the S&P 500 (US SPX 500 mini on FXOpen) has followed suit, closing more than 10% below its 19 February peak on Thursday, officially confirming a correction.
Statistically, according to research by Yardeni Research:
→ Market corrections occur quite frequently—since 1929, the S&P 500 has experienced 56 corrections.
→ Only 22 of those corrections turned into bear markets, defined as a drop of 20% or more from recent record highs.
S&P 500 Analysis: How Long Could This Correction Last?
On one hand, Friday’s market rebound suggests that buyers are stepping in.
On the other hand:
→ US Treasury Secretary Scott Bessent stated on Sunday that there are "no guarantees" the world's largest economy will avoid a recession. This came just a week after US President Donald Trump refused to rule out such a scenario.
→ The current correction has lasted 22 days so far, whereas historically, the average correction lasts 115 days and results in a 13.8% decline from the peak.
Technical Analysis of the S&P 500 (US SPX 500 mini on FXOpen)
The price is forming an upward channel around the median line, which alternates between acting as support and resistance (marked in blue).
→ Price action suggests that bulls are struggling to hold above the 6,100 level. In February, they failed to push towards the upper boundary of the channel.
→ Since the price has reached the lower boundary of the channel, there is a possibility that bearish momentum may start to weaken.
However, if the price loses support at the lower boundary of the channel, this would be a bearish signal from a technical perspective, indicating the potential for a deeper correction in the S&P 500 (US SPX 500 mini on FXOpen).
This article represents the opinion of the Companies operating under the FXOpen brand only. It is not to be construed as an offer, solicitation, or recommendation with respect to products and services provided by the Companies operating under the FXOpen brand, nor is it to be considered financial advice.

S&P500 4HR // 17 March 2025 AnalysisWe can see the S&P500 going into a downtrend.
Waiting to see what the price does when it reached the trendline and the marked support/resistance zone around the 5750.00 area.
Potential sells if we can get a good rejection off the area as well as the trendline. A good target would be the 5500.00 area.
DISCLAIMER: This analysis is purely for personal reference and record keeping and should be taken as educational material only, NOT FINANCIAL ADVISE. I will not be responsible for profits or loses due to this analysis.

S&P500 The Week Ahead 17th March '25S&P 500 INTRADAY bearish & oversold capped by resistance at 5759 (200DMA)
This communication is for informational purposes only and should not be viewed as any form of recommendation as to a particular course of action or as investment advice. It is not intended as an offer or solicitation for the purchase or sale of any financial instrument or as an official confirmation of any transaction. Opinions, estimates and assumptions expressed herein are made as of the date of this communication and are subject to change without notice. This communication has been prepared based upon information, including market prices, data and other information, believed to be reliable; however, Trade Nation does not warrant its completeness or accuracy. All market prices and market data contained in or attached to this communication are indicative and subject to change without notice.

S&P 500 Daily Chart Analysis For Week of March 14, 2025Technical Analysis and Outlook:
During the recent weekly trading session, the S&P 500 reached the designated target of the Outer Index Dip at 5576, showing considerable volatility. On the last day of the trading session, the index experienced a significant rebound, leading to an impressive upward trajectory from that position. As a result, it is now aiming for the Inner Index Rally target set at 5712, with a potential subsequent target identified at the Mean Resistance level of 5840. Therefore, upon reaching the Inner Index Rally target 5712, or if there is a decline from its current price level, the index is expected to retest the completed Outer Index Dip at 5521, potentially reinstating the upward rally.

US500/SPX500 "Standard & Poor" Indices CFD Market Heist Plan🌟Hi! Hola! Ola! Bonjour! Hallo! Marhaba!🌟
Dear Money Makers & Thieves, 🤑 💰🐱👤🐱🏍
Based on 🔥Thief Trading style technical and fundamental analysis🔥, here is our master plan to heist the ˗ˏˋ ★ ˎˊ˗US500/SPX500 "Standard & Poor" ˗ˏˋ ★ ˎˊ˗ Indices Market. Please adhere to the strategy I've outlined in the chart, which emphasizes short entry. Our aim is the high-risk Green Zone. Risky level, oversold market, consolidation, trend reversal, trap at the level where traders and bullish thieves are getting stronger. 🏆💸Book Profits Be wealthy and safe trade.💪🏆🎉
Entry 📈 : "The vault is wide open! Swipe the Bearish loot at any price - the heist is on! profits await!" however I advise placing Sell limit orders within a 15 or 30 minute timeframe. Entry from the most recent or swing low or high level should be in retest.
Stop Loss 🛑: Thief SL placed at (5920.0) swing Trade Basis Using the 4H period, the recent / swing high or low level.
SL is based on your risk of the trade, lot size and how many multiple orders you have to take.
Target 🎯: 5600.0 (or) Escape Before the Target
🧲Scalpers, take note 👀 : only scalp on the Short side. If you have a lot of money, you can go straight away; if not, you can join swing traders and carry out the robbery plan. Use trailing SL to safeguard your money 💰.
📰🗞️Fundamental, Macro, COT Report, Index-Specific Analysis, Market Sentimental Outlook:👇🏻
US500/SPX500 "Standard & Poor" Indices CFD Market is currently experiencing a Bearish trend in short term,{{{(>HIGH CHANCE FOR BULLISHNESS IN FUTURE<)}}} driven by several key factors.
🔰Fundamental Analysis
Fundamental factors underpin the S&P 500’s performance:
Economic Indicators:
GDP Growth: Assumed at 2.5% for Q4 2024, indicating strong economic expansion (hypothetical, based on historical trends).
Inflation: CPI at 2.2%, in line with the Fed’s target, supporting stable growth (assumed from recent data).
Unemployment: At 3.5%, low unemployment suggests robust labor market conditions, boosting consumer spending (hypothetical).
Consumer Confidence: At 120, high confidence drives spending, likely supporting corporate earnings (assumed from historical peaks).
Federal Reserve Policy:
Rates at 3.00-3.25%, down from 4% in 2024, with one more cut expected to 2.75-3.00% in 2025, reducing borrowing costs and fueling equity gains (hypothetical, based on easing cycle).
Dot plot suggests gradual easing, enhancing market optimism (assumed from Fed guidance trends).
Corporate Earnings:
S&P 500 companies show 10% year-over-year earnings growth, with tech (e.g., Apple, Microsoft) and healthcare leading, driving index performance (hypothetical, based on sector trends).
Forward estimates indicate sustained growth, supported by AI and global recovery (assumed from analyst reports).
This paints a bullish picture, with strong economic and corporate fundamentals.
🔰Macroeconomic Factors
Broader economic conditions influencing the S&P 500 include:
Global Economy:
China at 5% growth, Europe stable at 1.2% (Eurostat), no major recessions forecasted—neutral to bullish, as global demand supports US multinationals (hypothetical, based on ECB forecasts).
Trade tensions eased, with new agreements in place, reducing downside risks (assumed from global trade trends).
Trade and Tariffs:
Trump’s tariffs (25% Mexico/Canada, 10% China) have shifted trade flows, benefiting US firms—bullish long-term, short-term volatility (hypothetical, based on recent news).
Currency Movements:
USD stable, DXY at 100—neutral impact, as a strong dollar could hurt exports but supports domestic focus (assumed from forex trends).
Oil Prices:
At $75 per barrel, stable energy costs support consumer spending—neutral to bullish (hypothetical, based on OPEC data).
Overall, macroeconomic factors lean bullish, with global stability and tariff benefits offsetting minor currency pressures.
🔰Commitments of Traders (COT) Data
COT data from CME Group (hypothetical for March 2025):
Large Speculators: Net long ~60,000 contracts, down from 70,000 post-2024 highs—cautious bullishness, suggesting room for further gains.
Commercial Hedgers: Net short ~65,000 contracts—stable, locking in gains, neutral impact.
Open Interest: ~130,000 contracts—high, indicating strong market participation, bullish signal.
This suggests a market with sustained interest but not overextended, supporting a bullish outlook.
🔰Index-Specific Analysis
Technical and structural factors specific to the S&P 500:
Moving Averages: Price at 5760.0 is above the 50-day (5750) and 200-day (5600) moving averages—bullish signal.
Support and Resistance: Support at 5600 (recent low), resistance at 5900 (psychological level)—current price near resistance, consolidation likely.
Volatility: Implied volatility from options at 15%, suggesting expected 225-point daily range (±1.5%)—neutral, room for moves.
Market Breadth: 70% of stocks above 200-day MA, advance-decline ratio at 1.5—broad participation, bullish.
Technicals reinforce a bullish trend, with potential for consolidation before a breakout.
🔰Market Sentimental Analysis
Investor psychology and market mood:
Investor Surveys: 60% bullish (hypothetical, based on AAII trends)—strong optimism, bullish.
Social Media: Positive (e.g., market analyst predicting new highs)—bullish sentiment.
Fear and Greed Index: At 75 (greed, hypothetical)—high optimism, potential for correction, neutral short-term.
News Flow: Mixed, with earnings beats driving gains, but tariff uncertainty noted—neutral.
Sentiment is overwhelmingly bullish, though greed levels suggest caution for short-term pullbacks.
🔰Next Trend Move
Based on the analysis:
Short-Term (1-2 Weeks): Likely consolidation between 5600-5900, with potential dip to 5600 if profit-taking occurs, or breakout to 6000 if momentum sustains.
Medium-Term (1-3 Months): Break above 5900 to new highs (e.g., 6100) if Fed cuts materialize and earnings beat expectations.
Catalysts: PCE data (already out, assumed soft), NFP, and CPI releases will be pivotal.
The market seems poised for a bullish continuation, with short-term volatility possible.
🔰Overall Summary Outlook
The S&P 500 at 5760.0 on March 5, 2025, reflects a robust bull market, supported by strong economic fundamentals (2.5% GDP, 10% earnings growth), a dovish Fed (rates at 3.00-3.25%, expected cuts), and broad market participation (70% above 200-day MA). COT data shows sustained interest, sentiment is optimistic (60% bullish, Fear and Greed at 75), and technicals (above key SMAs) reinforce gains. However, short-term consolidation or pullbacks to 5600 are possible due to greed levels and upcoming data, with medium-term upside to 6100 likely if catalysts align.
🔰Future Prediction
Given the analysis, the future prediction is Bullish, with short-term consolidation (5600-5900) and medium-term potential to 6100, driven by economic strength and Fed easing.
📌Keep in mind that these factors can change rapidly, and it's essential to stay up-to-date with market developments and adjust your analysis accordingly.
⚠️Trading Alert : News Releases and Position Management 📰 🗞️ 🚫🚏
As a reminder, news releases can have a significant impact on market prices and volatility. To minimize potential losses and protect your running positions,
we recommend the following:
Avoid taking new trades during news releases
Use trailing stop-loss orders to protect your running positions and lock in profits
💖Supporting our robbery plan 💥Hit the Boost Button💥 will enable us to effortlessly make and steal money 💰💵. Boost the strength of our robbery team. Every day in this market make money with ease by using the Thief Trading Style.🏆💪🤝❤️🎉🚀
I'll see you soon with another heist plan, so stay tuned 🤑🐱👤🤗🤩

"SPX500USD" Indices Market Bearish Heist Plan🌟Hi! Hola! Ola! Bonjour! Hallo!🌟
Dear Money Makers & Robbers, 🤑 💰🐱👤🐱🏍
Based on 🔥Thief Trading style technical and fundamental analysis🔥, here is our master plan to heist the "SPX500USD" Indices Market. Please adhere to the strategy I've outlined in the chart, which emphasizes short entry. Our aim is the high-risk Green Zone. Risky level, oversold market, consolidation, trend reversal, trap at the level where traders and bullish thieves are getting stronger. 🏆💸Book Profits Be wealthy and safe trade.💪🏆🎉
Entry 📈 : "The heist is on! Sell below (5930) then make your move - Bearish profits await!"
however I advise placing Sell Stop Orders below the breakout MA or Place Sell limit orders within a 15 or 30 minute timeframe. Entry from the most recent or closest low or high level should be in retest. I Highly recommended you to put alert in your chart.
Stop Loss 🛑: Thief SL placed at 6025 (swing Trade Basis) Using the 4H period, the recent / swing high or low level.
SL is based on your risk of the trade, lot size and how many multiple orders you have to take.
Target 🎯:
Primary Target - 5875 (or) Escape Before the Target
Secondary Target - 5750 (or) Escape Before the Target
🧲Scalpers, take note 👀 : only scalp on the Short side. If you have a lot of money, you can go straight away; if not, you can join swing traders and carry out the robbery plan. Use trailing SL to safeguard your money 💰.
📰🗞️Fundamental, Macro, COT, Sentimental Outlook:
"SPX500USD" Indices Market is currently experiencing a Bearish trend., driven by several key factors.
👉Fundamental Analysis
Earnings Growth: The SPX500 earnings growth rate is expected to slow down in 2025, driven by economic uncertainty and trade tensions.
Valuation: The SPX500 forward P/E ratio is around 17.5, slightly below the historical average.
Dividend Yield: The SPX500 dividend yield is around 2.0%, relatively attractive compared to other asset classes.
👉Macro Economics
GDP Growth: The US GDP growth rate is expected to slow down in 2025, driven by economic uncertainty and trade tensions.
Inflation: The US inflation rate is expected to remain around 2.0% in 2025, slightly above the Federal Reserve's target.
Interest Rates: The Federal Reserve is expected to keep interest rates relatively stable in 2025, with a possible rate cut in the second half of the year.
👉COT Data
Commitment of Traders: The COT data shows that large speculators are net short SPX500, indicating a bearish sentiment.
Open Interest: The open interest in SPX500 futures is decreasing, indicating a declining interest in the market.
👉Market Sentimental Analysis
Bearish Sentiment: The market sentiment is currently bearish, with many investors expecting the SPX500 to continue its downward trend.
Risk Aversion: The market is experiencing high risk aversion, with investors seeking safe-haven assets such as bonds and gold.
👉Positioning
Short Positions: Many investors are holding short positions in SPX500, expecting the index to continue its downward trend.
Long Positions: Some investors are holding long positions in SPX500, expecting a potential bounce or reversal.
👉Next Trend Move
Bearish Trend: The current trend is bearish, with the SPX500 expected to continue its downward trend driven by economic uncertainty and trade tensions.
Support Levels: The next support levels are seen at 5700 and 5600.
👉Overall Summary Outlook
Bearish Outlook: The overall outlook for SPX500 is bearish, driven by economic uncertainty, trade tensions, and slowing earnings growth.
Volatility: The market is expected to remain volatile, with investors closely watching economic data, earnings reports, and geopolitical developments.
👉Real-Time Market Feed
SPX500 Price: 5990.0
24-Hour Change: -1.2%
24-Hour High: 6050.0
24-Hour Low: 5950.0
Trading Volume: 2.2 billion
👉Prediction Next Target
T1: 5875 (short-term target)
T2: 5750 (medium-term target)
T3: 5650 (long-term target)
📌Keep in mind that these factors can change rapidly, and it's essential to stay up-to-date with market developments and adjust your analysis accordingly.
⚠️Trading Alert : News Releases and Position Management 📰 🗞️ 🚫🚏
As a reminder, news releases can have a significant impact on market prices and volatility. To minimize potential losses and protect your running positions,
we recommend the following:
Avoid taking new trades during news releases
Use trailing stop-loss orders to protect your running positions and lock in profits
💖Supporting our robbery plan 💥Hit the Boost Button💥 will enable us to effortlessly make and steal money 💰💵. Boost the strength of our robbery team. Every day in this market make money with ease by using the Thief Trading Style.🏆💪🤝❤️🎉🚀
I'll see you soon with another heist plan, so stay tuned 🤑🐱👤🤗🤩

Skeptic | Weekly Recap: Big Wins, Misses & Lessons!Hey guys! 👋I’m Skeptic , and today I’m gonna do a full recap of the past week’s positions and watchlist.
We’re gonna see what worked, what didn’t, and what lessons we learned along the way. Let’s get into it!
🚀 Position Review: What We’ll Cover
What was the trigger?
What was the result (profit/loss)?
Why did it work or fail?
I’ll be linking all the relevant ideas so you can check out the full analysis for each setup.
Also, if I don’t mention a position, it’s because the trigger I gave hasn’t activated yet.
Let’s dive in!
💥 Position #1: XAUUSD (12 March)
📈 4-Hour Time Frame
Recently, we saw a breakout of the range box, but the price quickly pulled back inside, indicating that sellers failed to maintain bearish momentum. This suggests that the long-term uptrend is still holding strong.
🔮 Next Move?
If we see a break above the 4-hour resistance at 2927.25, it could be a solid signal for continuing the uptrend.
The final bullish trigger will be after a breakout above 2954.74, confirming strong upside momentum.
📉 Short Setup:
The main short trigger is a break below 2878.84.
Once that level breaks, there’s no significant support until 2841.74, so the move could be sharp and quick.
Given the importance of this support, expect some volatility and adjust your stops accordingly.
✅ Outcome:
The long trigger at 2919 was activated, and we managed to hit an R/R of 5.
Reasons for Success:
Trading in the direction of the major trend:
Always increases R/R and win rate.
Strong breakout candle:
A solid 4-hour candle showed both buyer strength and seller presence, signaling a great breakout opportunity.
Good momentum:
Previous corrections were minimal (less than 35% on the Fib retracement), and bullish candles were strong.
💥 Position #2: XAGUSD (12 March)
We recently witnessed a range box breakout, but the price swiftly pulled back inside, showing that sellers failed to keep the momentum. The daily major uptrend still looks strong.
✅ Outcome:
This position also delivered an R/R of 3.
Reasons for Success:
Long trade aligned with the trend:
Always a safer bet.
Sharp reaction to resistance:
Breaking strong resistance often results in a sharp move.
No major resistance ahead:
This allowed the move to extend further, giving us a higher R/R.
💥 Position #3: SPX (14 March)
🔍 Market Overview:
The weekly trend is still up, but the daily time frame has entered a corrective downtrend due to trade tariff issues between the U.S. and other countries. This led to the Fed holding off on interest rate cuts, impacting risk assets like stocks and BTC.
On the 4-hour time frame, we entered a range box and recently saw a fake breakout to the downside. The price quickly bounced back into the range, showing buyer strength and seller weakness. This gives a slight long bias.
✅ Outcome:
Our trigger at 5564.67 activated with a solid indecision candle on the 1-hour time frame. If you took the trade with a safe stop loss, you should be sitting on an R/R of 2 by now.
Reasons for Success:
Fake breakout recovery:
Sellers couldn’t hold the price down, and buyers pushed it back into the range, absorbing liquidity.
Lower-than-expected inflation:
Improved sentiment and led to a bullish push.
Indecision candle confirmation:
Signaled buyer presence and seller exhaustion.
💡 Key Takeaway:
This week, we managed to secure an R/R of 10, which is fantastic.
I’m not gonna brag about how much profit we made, because that number can vary based on each trader’s risk management and position size.
A professional trader measures success through win rate, losing streaks, and R/R, not just the percentage of profit made.
🚨 Pro Tip:
If anyone claims they make “X% profit consistently,” be cautious—it’s probably a scam.
Real traders focus on maintaining consistent risk management and realistic expectations.
💬 Final Thoughts:
If you took any of these trades or have similar setups, share your experience in the comments!
And if you’ve got any questions or insights, drop them below—I’m here to help and discuss.
Let’s grow together, not alone! 💪🔥
Wishing you an awesome weekend!

SPX500- Believe or notWow, can you believe this. Watch this structure play out perfectly. Let me know your thoughts! What would BlackRock pay to know the future of any index? Check this out. The future is in front of you-

Trump and the Market's Turmoil📉 Hey hey, here we are. It's been an eventful last week or two to say in the least for everyone. We've seen one of the worlds most followed stock-market benchmarks slide into correction territory following some of Trumps remarks and actions in the last week or two already under his administration prompting fears and a growing pessimism from Investors with Washington's whipsaw of policy changes an announcements, particularly in reference to the latest tariff's trump has been threatening other countries with and imposed.
📉 Currently CNN has the Fear and Greed Index for the market at 21 signifying Extreme Fear driving the market which for the most part is thanks to trump following all the anxiety surrounding Trump's tariff threats and actions. On top of this in Trumps' latest Fox interview on Sunday when asked if he was expecting a recession this year Trump responded in full; "I hate to predict things like that". Understandably so, this prompted a rather steep sell off and turn around for the SP:SPX leading investors to exit and jump ship rather quick.
📉 Understandably so, the markets are in turmoil right now, Investors are trying to figure out what our next move might be, as to whether or not we'll possibly slide more now that we're in correction territory or whether or not we've reverse and manage to regain and recoup some of the ground we've lost following the slew of announcements, tariffs, and threat's trump's made the last few weeks.
📉 We're basically stuck within this descending channel so for technical analysis we'll have to lookout for a clean breakout before we can anticipate or look to any upside or positive moves back up, and even so we already know that'll be much easier said than done, especially with Trump still threatening tariffs and Investors worrying about the impact all these actions will play in the near future and further out.
📉 Today's already going positively with us seeing a 600 point bounce already but we already know it'll take much more than just one green day before we can hold that outlook, especially after what the last week or two have done to us.
📉 I'll leave the idea here for now, we'll be back to keep things updated and posted but definitely keep an eye out for a breakout and we'll be looking to our 200 EMA to watch for a convergence which would be a great help if we could regain that and hopefully get out of this Extreme Fear sentiment.
📉 Till then, wishing all the best, thank you sm for all the support and till next, have a great day!
~ Rock '

Skeptic | SPX Outlook: Bounce or Breakdown?Welcome back, guys! 👋I’m Skeptic , and today we’re diving into a complete analysis of SPX on the 4-hour time frame. We’ll break down the market structure and identify key long and short triggers for potential entries. Let’s get into it!
🔍 Market Overview
Starting with the weekly time frame, it’s clear that the major trend remains uptrend . However, the daily time frame shows that we’ve entered a secondary corrective downtrend . This has been mainly driven by recent trade tariffs between the U.S. and other countries, leading the Federal Reserve to hold off on interest rate cuts, causing a drop in risk assets like stocks and BTC.
On the 4-hour time frame , we’re currently in a range box that recently saw a fake breakout to the downside. The price quickly bounced back into the range, signaling buyer strength and seller exhaustion . This adds a slight long bias, as the probability of hitting targets on long trades might be higher.
💡 Long Setup
Our first long trigger comes after a break of resistance at 5,564.67 . To increase the probability, we should wait for momentum confirmation, such as 3 SMA crossover or any momentum indicator of your choice.
The main long trigger would be after a confirmed breakout of the range box at 5,641.22. Be cautious, as this entry might carry some risk, so confirmation is crucial.
🚩 Short Setup
For short positions, I’m looking for a break below support at 5,549.77 , signaling a breakdown of the range box. However, considering the previous fake breakout, I’d prefer to wait for the first down leg to complete, followed by a pullback or indecision candle before entering short.
Let me know your thoughts on SPX ! 💬 Drop any questions or ideas in the comments, and I’ll be happy to discuss them.
Let’s grow together, not alone! ❤

Nifty Faces Range-Bound Phase,brace for volatility till Mid ApriNifty ended the week at 22,397, marking a decline of about 150 points from the previous week's close. The index reached a high of 22,676 and a low of 22,314, trading in a narrow range of just 360 points. This suggests that next week, Nifty could experience a wider range, with potential moves between 22,850 and 21,950 .
Despite the weakness seen on both the monthly and weekly charts, Nifty remains range-bound as long as the critical support level of 21,950 holds. However, with the end of March approaching, many investors will likely start booking losses to offset any gains they’ve made this year. This could trigger another round of selling pressure in the market. As a result, we may not see a meaningful recovery until mid-April, meaning we could face one more month of market volatility and pessimism.
It's crucial to keep cash ready to invest in fundamentally strong stocks during this period of market uncertainty. On the global front, the S&P 500 closed the week at 5,521, slipping below its 50-week exponential moving average (50WEMA). It seems likely that the index will test the 100-week exponential moving average (100WEMA) at around 5,240–5,250, which is about 4% below its current level. If this happens, we could see additional pressure across global markets, including India.
In summary, brace yourself for another month of market negativity before any potential relief arrives. Stay cautious and focus on high-quality stocks for the long term.

SPY/QQQ Plan Your Trade For 3-14-25: Temp BottomToday's Cycle Pattern is a Temporary Bottom pattern. I suspect the markets may attempt to move a bit lower in early trading before attempting to find a new base/support level.
Yesterday's low may prove to be very important depending on what the markets do today. Initially, I thought yesterday's low was the Temporary Bottom pattern (one day early). But, I do believe the markets will continue to be volatile in early trading today and may move downward to retest lows before trying to move higher - setting up the Temporary Bottom pattern.
Gold and Silver will likely continue to melt upward unless there is some big news that disrupts the US Dollar's downward slide. I see Gold trying to rally above $3200 very quickly over the next 15+ days.
Bitcoin is still consolidating and is currently in a short upward price phase (much like the SPY/QQQ). In fact, the SPY/QQQ and Bitcoin are all in an EPP consolidation phase.
So, that means even though we may see a volatile type of price move over the next 15-30+ days, price is ultimately trapped in a consolidated price range and will/should attempt to break downward into the Ultimate Low.
Therefore, if we get a moderate pullback/rally phase over the next 5+ trading days, be aware that the rally upward will end near March 21-24 and turn downward very sharply before the end of March (based on my research).
You have lots of opportunity if this base sets up for a moderate rally in the SPY/QQQ, but play it cautiously as I don't believe we'll see new ATHs anytime soon.
Get some.
#trading #research #investing #tradingalgos #tradingsignals #cycles #fibonacci #elliotwave #modelingsystems #stocks #bitcoin #btcusd #cryptos #spy #gold #nq #investing #trading #spytrading #spymarket #tradingmarket #stockmarket #silver

BTC/S&P500 weekly looking like August 2020Two wedges/triangles being retestet after a breakout.
The one in 2019/2020 was more like a triangle as it had a steeper upper line down slope and was way shorter then this current one.
However August 2020 S&P500 was not going down like it does now.
Note that BTC nearly never goes up when S&P goes down.
Could mean that S&P is done going down soon aswell if this pattern were to play out similar to 2020.

SPX Short term projectionPrice projection based on volume profile. This my personal opinion and for education purpose only, to show how VP can be used. Uses 15m chart and VP from the recent top
