SPX S&P 500 Gearing Up For A 10x Over Next 10 yearsSPX looks extremely bullish and the patterns are obvious to me. This parabola will continue into the 2030's and be even more vertical than we've seen in any prior runs. This next decade is going to be wonderful. There may be some corrections along the way but in the bigger picture we are going to go absolutely vertical. Hold onto your hats.
None of this is financial advice just my opinion.
S&P 500 (SPX500)

Another 682 point crash for S&P500 to 5,130?It's been a brutal year so far with the Trump Presidency.
And it's been a rough year for the S&P 500, dropping from 6,149 to 5,811.
The main culprit?
Political instability in the U.S.
The current administration’s unpredictable decisions, sudden tariff hikes, and policy shifts have left investors uneasy and consumers lacking confidence.
Here are six executive orders that have dragged the market down:
Tariff Hikes on China, Mexico, Canada and Europe –
Higher import costs hurt U.S. businesses, especially in tech and retail, slashing profits. Remember imposing tariffs are one thing but there will be retaliatory action.
Environmental Rollbacks –
ESG investors pulled back, hitting energy and industrial stocks.
Work Visa Cuts – Tech and healthcare struggled to hire, slowing innovation.
Healthcare Subsidy Cuts – Uncertainty in insurance and pharma led to stock drops.
Also with the cutting of USAID and with turbulence with WHO this isn't helping the situation
Trade Agreement Pullouts – Supply chain chaos hurt multinational corporations.
ALso with the cutting ties with Ukraine and now with the UK prohibiting funding to the Ukraine (latest on)
With shaky policies and no clear direction, market confidence is shot. Until stability returns, expect more turbulence.
With the price action, it is possible to see this M Formation play out for the SP500.
And it is looking bad, really bad - not great - In Trump's voice.
M Formation
Price<20MA
Needs to break <200MA
Then the next target will be around 5,130...
Let's actually hope I am wrong this time and something miraculously happens to pump up the market again.
We can take advantage and short stocks, indices etc... But there is a moral issue involved with wanting the market to crash. Remember that.

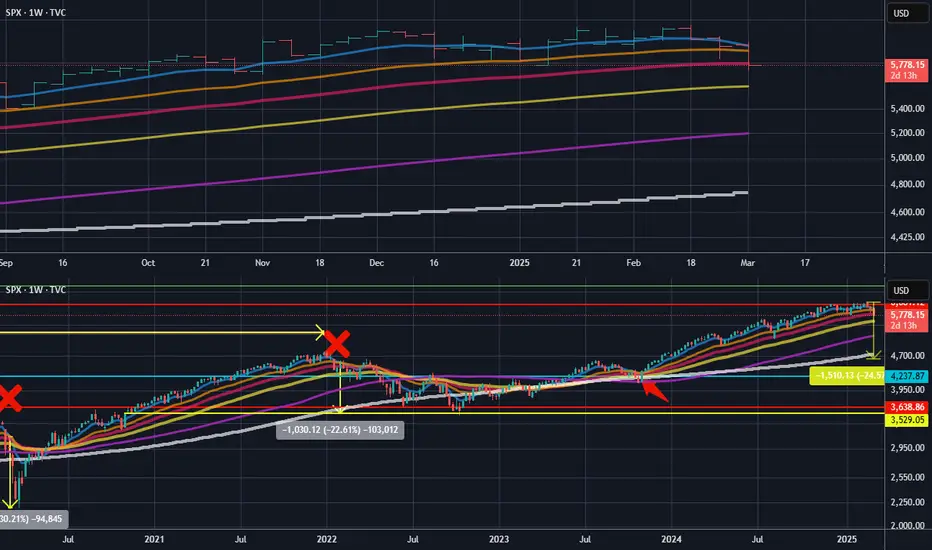
SPX chart update after calling moves to the $ for 3 yearsHere is the 1st chart I did of SPX back in Jan 2022:
I called the drop to the yellow line on chart. Nailed it to nearly the exact $.
Then in October 2023 I mentioned this:
The rally was confirmed for the next 6 months minimum.
Then in Jan 2024 I posted a red horizontal line as target for the rally:
Now you can see on current bottom chart that price hit the red line target.
This chart setup you see on bottom chart also shows relevance to the 1st chart I did on SPX where when the blue EMA8 went below the orange MA21, a drop happened as per the red X marks and price changes shown on chart. This is close to happening currently which is easier to see on the top chart as I give a close up view on current price action and the EMA/MA's.
Are we about to see a drop as per yellow price change on chart or can SPX bounce from here and move up to the green horizontal line on chart? The EMA/MA crossunder will tell us.
Even though I called the moves all correct previously, at this time in the markets, things are alot trickier so I cannot say with conviction this time around as to which way it will go.
I will update the analysis once the bounce or cross under is confirmed.
S&P500 Index Goes 'Draconian', ahead of Roller Coaster ExplosionThe S&P 500's "roller coaster" behavior stems from its sensitivity to various economic, geopolitical, and market-specific factors that influence investor sentiment and corporate performance.
Economic Factors: Changes in interest rates, inflation, and Federal Reserve policies significantly impact the index. For example, rising interest rates can reduce corporate earnings and valuations, leading to market sell-offs. Conversely, expectations of rate cuts can boost optimism and drive rallies.
Investor Sentiment and Volatility: The S&P 500 is closely tied to the CBOE Volatility Index (VIX), often called the "fear gauge." The VIX rises during market downturns as investors seek portfolio protection, amplifying price swings. This inverse correlation highlights how fear or optimism can drive sharp movements in the index.
Global Events: Geopolitical tensions, natural disasters, or pandemics can disrupt markets by creating uncertainty about future economic performance. Such events often lead to sudden spikes or drops in the S&P 500 as investors react to perceived risks.
Valuation Cycles: Overvaluation or bubbles in specific sectors can lead to corrections. For instance, high price-to-earnings ratios combined with slower economic growth can result in prolonged periods of stagnation or volatility.
These factors collectively create the "roller coaster" effect begun in the S&P 500.
// Life is like a roller coaster, as you don't know what's going to be thrown at you next, so all you can do is give us your best shot.
--
Best wishes,
@PandorraResearch Team 😎

SPX500 is heading to a major correction.Just reading the charts—and if history repeats itself, we’ve entered a weekly MACD and RSI downtrend.
I called this for Bitcoin a month ago, and some argued it could be invalidated. Now, we can see that’s nearly impossible.
Macro Outlook
The economy is in bad shape—you see the news.
Trump’s tariffs are scaring investors for a good reason. He wants to avoid money printing and tighten supply, but how will companies and institutions get cash? By selling their stocks.
No more free money—profits will have to come from selling assets, which will intentionally crash the market under Trump’s policy.
Cycles & Recession
We’re at the end of a cycle—everything is overbought and needs a reset before moving higher.
We’re in a recession, even if no one wants to admit it.
Conclusion
📉 Target price: 4850
📅 Estimated bottom: September 15, 2025
Expect volatility, occasional pumps, but on a weekly scale, the trend is down—unless something drastic happens. Q3 and Q4 will be bullish.
🚨 DYOR!

S&P500 $SPY | SPY’s All-Time High - Where to Next? | Feb23'25S&P500 AMEX:SPY | SPY’s All-Time High - Where to Next? | Feb23'25
AMEX:SPY BUY/LONG ZONE (GREEN): $597.50 - $613.23
AMEX:SPY DO NOT TRADE/DNT ZONE (WHITE): $584.88 - $597.50
AMEX:SPY SELL/SHORT ZONE (RED): $574.00 - $584.88
AMEX:SPY Trends:
AMEX:SPY Weekly Trend: Bullish
AMEX:SPY Daily Trend: Bullish
AMEX:SPY 4H Trend: Bullish
AMEX:SPY 1H Trend: Bearish
AMEX:SPY just reached a new all-time high! How did price get there?
AMEX:SPY experienced a small range between 602.45 – 604.00, followed by bearish momentum, leading to a 3% drop in price. However, bullish momentum quickly stepped in, pushing the price up before continuing downward again. This bearish trend was short-lived and appears to have formed a developing range rather than a sustained downtrend.
Shortly after, price broke back above 597.50, signaling the start of a new bullish trend. SPY then established a ranging pattern between 597.50 - 608.00 before ultimately breaking out to a new all-time high of 613.23. Despite the breakout, price action has now dropped back into the range between 597.50 - 608.00.
Where to next? Will SPY hold its new highs, or is this the start of a reversal?
This is what I would personally look at before entering trades, everything is subject to change on a daily basis and as I analyze different timeframes and ideas.
ENTERTAINMENT PURPOSES ONLY, NOT FINANCIAL ADVICE!
trendanalysis, trendtrading, priceaction, priceactiontrading, technicalindicators, supportandresistance, rangebreakout, rangebreakdown, rangetrading, chartpatterntrading, chartpatterns, spy, sp500, s&p, fed, federalreserve, fedrate, AMEX:SPY , snp, snp500, usmarket, usmarkets, stockmarket, overallmarket, spyath, spyalltimehigh, all-time high, price action, bullish trend, bearish momentum, trading range, breakout, support and resistance, choppy market, untradable zone, stock market, technical analysis, market trends, price breakout, volatility, trend reversal, stock trading, SPY analysis, market momentum, trading strategy, sparros, sparrosexchange,

$SPX Fractal IdeaI've been watching this 2023 fractal play out very similarly since Summer '24.
It would mean a drop around 5,500 by late March/early April before continuation of the uptrend into late 2025.

SPY/QQQ Plan Your Trade for 3-4-25: Top Resistance PatternToday's pattern is a Top Resistance pattern.
Usually, these types of patterns reflect a market where price moves higher - attempting to find a peak/resistance level, then rolls downward (confirming that resistance level).
Because of yesterday's strong selling after Trump's Tariff comments, I suggest the peak in today's price activity may be set in very early trading.
We're going to have to watch the charts to see how price reacts to more news and the continued restructuring of global economies.
One thing is obvious: the markets are resettling based on Trump's expectations and tariff comments. I checked out TLT and a few other symbols last night, and it appears the Predator Fed comments I made over the past 12+ months are still holding up very well.
Inadvertently, the US has moved into a position of being the 900 lb gorilla of the global markets.
Higher Fed rates for longer are putting pressure on global currencies and many global economies.
If Trump is able to secure more US manufacturing and a more secure US economy (reducing deficit spending), I can see the next 3+ years being very disruptive for the global markets.
Ultimately, though, building a strong US economy and going through this disruption will lead to explosive growth in 2026 and beyond. You may not see it now, but if we are able to organize our government/finances better going forward - start to think about how powerful that could be for the next 15 to 25+ years.
Next, thank you for all the great comments. Love it.
Gold and Silver are starting to make that recovery rally move after the last 7+ days of selling. This could be a very powerful move to the upside for metals and miners.
Bitcoin is still struggling and will likely stay trapped in a sideways range. that range could be $10k to GETTEX:13K in size - so stay cautious of wild volatility in BTCUSD if you are trading it.
Again,I want to urge all of you to consider your trading as "taking calculated risks" - not gambling.
I talked to a friend just yesterday, and he told me how I changed his life by helping him to stop the gambling-style of trading he was doing. Once you realize that trading is not about those HUGE WINS (sure they are nice) - but it is about staying agile, getting in and out with decent profits, and growing your account efficiently.
So, I urge you to step back and consider every new trade you take as "how much am I really risking if things go wrong". When you do that, you'll find you can still take the trade, but you'll teach yourself to manage your capital more efficiently.
Ok. Go Get Some!
#trading #research #investing #tradingalgos #tradingsignals #cycles #fibonacci #elliotwave #modelingsystems #stocks #bitcoin #btcusd #cryptos #spy #es #nq #gold

SPX 500 - simple trade idea- daily 200 MA
- lower trendline of the broadening wedge
- 5750 is 0.382 fib from 5 aug 2024 to 19 feb 2025
you can expect a bounce around 5750 that could lead to new ATH around mid april/may
if close daily below the trendline maybe hard times ?
lets follow the arrows
Confidence 5/10 as i'm not trading stocks

SPY/QQQ Plan Your Trade Update for 3-3-25 : Absolutely PerfectThis quick little update is for everyone who follows my research.
Today was absolutely PERFECT in terms of my expectations and how the SPY moved so far today.
A nearly perfect downward price trend targeting the 588 level.
Now, we'll see if we get a base and a squeeze higher before the end of trading today.
I'm so impressed with my ability to pinpoint these type of opportunities for everyone.
Remember, trading is about taking the opportunity to position your assets for gains.
Get some.
And please share your success stories if you have them.
#trading #research #investing #tradingalgos #tradingsignals #cycles #fibonacci #elliotwave #modelingsystems #stocks #bitcoin #btcusd #cryptos #spy #es #nq #gold

SPX500: Possible bounce from key support toward 5,980?FOREXCOM:SPX500 has reached a significant support zone, highlighted by previous price reactions and strong buying interest. This area has acted as a key demand zone, increasing the likelihood of a bullish bounce if buyers step in.
The current market structure suggests that if the price confirms support within this zone, we could see a bullish reversal. A successful rebound could push the price toward 5,980 . However, if the price breaks below this zone, the bullish outlook may be invalidated, opening the possibility for further downside.
Just my take on support and resistance zones—not financial advice. Always confirm your setups and trade with solid risk management.
Best of luck!

SPY/QQQ Plan Your Trade For 3-3-25 : Up-Down-UP Pattern CounterToday's pattern, and Up-Down-Up in counter-trend mode, suggests the markets will attempt to move downward after the open and attempt to retrace some (or most) of Friday's gain.
I do believe this downward price move is essential for the markets to build a moderate base before attempting to move higher into the march 11-16 topping pattern my research suggests will prompt another breakdown in price.
Ultimately, these moves up and down over the past 30+ days are establishing a sideways (mega-phone type) price structure that I warned was likely to happen more than 90+ days ago (back in December 2024).
What we are seeing right now is a rolling of price while uncertainty continues to drive capital away from technology, semis and innovation - moving into safety and security.
This will continue until July or August 2025, then capital will suddenly shift back into risk-ON in my opinion.
By the time everyone thinks the markets are breaking downward (crashing), that is when I think the markets will make a sudden shift toward growth and innovation as the US resumes a growth phase in late 2025 (carrying into 2026).
Currently, we are in a minor little "pause/rally" phase after the last bout of selling. This rally will likely end sometime after March 11 - leading to a breakdown in price starting between 3-14 and 3-17.
This is a trader's market.
Gold/Silver appear to have found a footing and seem to be bouncing. We'll see if Gold/Silver move above critical resistance and continue to rally higher.
BTCUSD has rebounded back to support/resistance, but has also moved into a new DUAL Excess Phase Peak pattern that suggests increased price volatility for Bitcoin. I still believe we are moving into a very side-range consolidation pattern for Bitcoin.
I suggest staying fairly cautious today and setting up some trades for the pause/rally I expect to carry through this week for the SPY/QQQ. No need to get too greedy on a Monday.
Get some.
#trading #research #investing #tradingalgos #tradingsignals #cycles #fibonacci #elliotwave #modelingsystems #stocks #bitcoin #btcusd #cryptos #spy #es #nq #gold

S&P Oversold bounce backThe S&P 500 (US500) index maintains a bullish bias within the broader long-term uptrend. However, recent price action suggests a period of consolidation following the retest of the all-time high on February 19, 2025. The market is currently at a critical juncture, with the 5918 level acting as a key support zone.
Bullish Scenario:
The 5918 level serves as a newly established support, aligning with the consolidation range and prior resistance.
A corrective pullback towards this level, followed by a bullish bounce, could confirm continued upside momentum.
Upside targets include:
6000 (50-day moving average)
6055 (20-day moving average)
6100 over the longer term
Bearish Scenario:
A confirmed loss of 5918 support with a daily close below this level would invalidate the bullish outlook.
This could trigger a deeper retracement, exposing the following downside levels:
5854 (next key support)
5800, with a potential extension to 5777 if selling pressure accelerates
Market Outlook:
The 5918 level remains pivotal—holding above this support sustains the bullish bias, while a decisive break below it signals potential downside continuation. Traders should closely monitor price action and volume around this key level to assess the market’s next move.
This communication is for informational purposes only and should not be viewed as any form of recommendation as to a particular course of action or as investment advice. It is not intended as an offer or solicitation for the purchase or sale of any financial instrument or as an official confirmation of any transaction. Opinions, estimates and assumptions expressed herein are made as of the date of this communication and are subject to change without notice. This communication has been prepared based upon information, including market prices, data and other information, believed to be reliable; however, Trade Nation does not warrant its completeness or accuracy. All market prices and market data contained in or attached to this communication are indicative and subject to change without notice.

Weekly Market Forecast Mar 3-7: Stock Indices, Gold, Oil, moreThis is a FUTURES market outlook for the week of Mar 3-7th.
In this video, we will analyze the following futures markets:
ES | S&P 500
NQ | NASDAQ 100
YM | Dow Jones 30
GC | Gold
SIL | Silver
PL | Platinum
HG | Copper
The indices took a bearish turn at the end of last week. Trump announcements, tariffs, Ukraine and Russia injected uncertainty into the markets, and investors moved money into safe havens.
Patience is required to trade in this environment. Wait until there are clear signs of shifts in the market before deciding on a bias. Setup confirmations are always the best course of action.
Enjoy!
May profits be upon you.
Leave any questions or comments in the comment section.
I appreciate any feedback from my viewers!
Like and/or subscribe if you want more accurate analysis.
Thank you so much!
Disclaimer:
I do not provide personal investment advice and I am not a qualified licensed investment advisor.
All information found here, including any ideas, opinions, views, predictions, forecasts, commentaries, suggestions, expressed or implied herein, are for informational, entertainment or educational purposes only and should not be construed as personal investment advice. While the information provided is believed to be accurate, it may include errors or inaccuracies.
I will not and cannot be held liable for any actions you take as a result of anything you read here.
Conduct your own due diligence, or consult a licensed financial advisor or broker before making any and all investment decisions. Any investments, trades, speculations, or decisions made on the basis of any information found on this channel, expressed or implied herein, are committed at your own risk, financial or otherwise.

SPX: break of long term trend-lineThe game of nerves could be one of descriptions of developments on the US equity markets during the previous week. It was a heavy week due to a significant drop in the value of the S&P 500 but also other US equity indexes. The index declined about 1% during the previous week, and 1,4% since the beginning of February. Friday brought back significant buyers, where the index managed to end the week at the level of 5.954. The lowest weekly level was at 5.840.
Tech companies were trying to hold, however, the majority ended February in a negative territory. Tesla is one of the most hit companies, with a weekly loss of around 16%. Analysts are noting that this represents the highest weekly loss of TSLA since December 2022. Other large companies also had significant drop, where Nvidia lost around 10%, while Palantir was down by around 19%, after recently reaching the historically highest level. On the other hand, companies within the financial sector performed in a positive manner, rising 1,3% for the week.
When looking at the daily chart of S&P 500, the major support line was clearly breached. This line connects historical lows from October 2023, August 2024 and January 2025. It has been clearly breached on Thursday, however, Friday trading session brought the index back toward this line, but this time from the down side. Whether Friday's positive sentiment will continue is to be seen on Monday. For the moment the US equity market is under strong influence of geopolitical topics and potential trade tariffs. In addition, it should be considered that NFP data will be published in a week ahead, which might influence some higher volatility.

Where is the Indices going and Bitcoin? This is my opinion of what I think will happen in March after February sell off. I have bullish bias for both indices and Bitcoin as long as 80K Level stays intact in case of BTC.
Also RSI and Volume divergence can be seen for extra confirmation
Disclaimer: Not a financial advice. Do your own analysis

S&P 500 Daily Chart Analysis For Week of Feb 28, 2025Technical Analysis and Outlook:
In the recent weekly trading session, the S&P 500 did not succeed in retesting the Mean Resistance level of 6082. Instead, the index experienced a notable decline, reaching the Mean Support level of 5939 and narrowly approaching the Key Support level of 5827.
Following this downturn, a significant rebound occurred, resulting in the establishment of a new Mean Support level at 5860. The index is now positioned to target the Mean Resistance level of 5967. Should the index initiate an upward movement from its current level and successfully surpass the critical Mean Resistance of 5967, it may continue to rise toward the Mean Resistance level of 6032, potentially reaching the Key Resistance level of 6143.
Conversely, if the index declines from its present position, it may create a retest pullback to revisit the Mean Support level of 5860 before resuming further upward momentum.

S&P Retest of IMPORTANT support, The week ahead 03rd March '25 The S&P 500 (US500) index maintains a bullish bias within the broader long-term uptrend. However, recent price action suggests a period of consolidation following the retest of the all-time high on February 19, 2025. The market is currently at a critical juncture, with the 5918 level acting as a key support zone.
Bullish Scenario:
The 5918 level serves as a newly established support, aligning with the consolidation range and prior resistance.
A corrective pullback towards this level, followed by a bullish bounce, could confirm continued upside momentum.
Upside targets include:
6000 (50-day moving average)
6055 (20-day moving average)
6100 over the longer term
Bearish Scenario:
A confirmed loss of 5918 support with a daily close below this level would invalidate the bullish outlook.
This could trigger a deeper retracement, exposing the following downside levels:
5854 (next key support)
5800, with a potential extension to 5777 if selling pressure accelerates
Market Outlook:
The 5918 level remains pivotal—holding above this support sustains the bullish bias, while a decisive break below it signals potential downside continuation. Traders should closely monitor price action and volume around this key level to assess the market’s next move.
This communication is for informational purposes only and should not be viewed as any form of recommendation as to a particular course of action or as investment advice. It is not intended as an offer or solicitation for the purchase or sale of any financial instrument or as an official confirmation of any transaction. Opinions, estimates and assumptions expressed herein are made as of the date of this communication and are subject to change without notice. This communication has been prepared based upon information, including market prices, data and other information, believed to be reliable; however, Trade Nation does not warrant its completeness or accuracy. All market prices and market data contained in or attached to this communication are indicative and subject to change without notice.

SPY/QQQ Plan your Trade For 2-28 : Gap Up - LowerToday's pattern suggests the markets will open with a slight GAP UP (higher), then transition into a downward price trend throughout the rest of the day.
After yesterday's deep selling, I suspect there may be a bit more of an uptrend in early trading.
The 584-585 level on the SPY was hit. That was my original projected downside target for the Feb 21-24 breakdown in price.
We've also seen Bitcoin collapse a little over 25%.
I believe this deep selling in Bitcoin prompted a "sell-everything" type of breakdown in the SPY/QQQ and other assets (gold/silver).
Once this move subsides/bases, I believe we'll see 2-3 days of basing/bottoming, then a reasonably strong reversion rally in the SPY/QQQ as the sell-everything fear settles.
This would be a good time to look for initial "anchor" positions in certain assets related to a moderate recovery rally between now and March 11-14 - maybe a bit later.
Overall, we are moving solidly into my expanding megaphone pattern and should continue to see increased price volatility.
The next phase of the market trends is a moderate recovery rally. Then, as we approach the March 21-24 breakdown phase, we will see more selling.
Get ready for a base/bottom setup. Then, we'll see the price move into a recovery phase, and the SPY may target 600 to 604 before topping again.
Get some.
#trading #research #investing #tradingalgos #tradingsignals #cycles #fibonacci #elliotwave #modelingsystems #stocks #bitcoin #btcusd #cryptos #spy #es #nq #gold

S&P INTRADAY previous support new resistance?S&P (US500) index pair price action sentiment appears bullish, supported by the longer-term prevailing uptrend. The recent intraday price action appears to be a sideways consolidation after a retest of an all-time high on 19th Feb ‘25.
The key trading level is at the 5918 level, the consolidation price range and also the previous support is now a newly formed resistance zone. An oversold rally from the current levels and a bullish breakout above the 5918 level could target the upside resistance at 5967 followed by the 6014 and 6056 levels over the longer timeframe.
Alternatively, a confirmed rejection at the 5918 resistance and a daily close below that level would negate the bullish outlook opening the way for a further retracement and a retest of 5853 support level followed by 5827 and 5780.
This communication is for informational purposes only and should not be viewed as any form of recommendation as to a particular course of action or as investment advice. It is not intended as an offer or solicitation for the purchase or sale of any financial instrument or as an official confirmation of any transaction. Opinions, estimates and assumptions expressed herein are made as of the date of this communication and are subject to change without notice. This communication has been prepared based upon information, including market prices, data and other information, believed to be reliable; however, Trade Nation does not warrant its completeness or accuracy. All market prices and market data contained in or attached to this communication are indicative and subject to change without notice.

SPX500 Bearish Breakout!
HI,Traders !
SPX500 is going down
And the Indice made a bearish
Breakout of the key horizontal
Level of 5938.38 and the
Breakout is confirmed so we
Are bearish biased and we
Will be expecting a further
Bearish move down!
Comment and subscribe to help us grow !

Can the Nasdaq sustain its rally?NASDAQ:IXIC
SP:SPX
FX_IDC:JPYKRW
Over the past two years, the S&P 500 and Nasdaq have experienced an unprecedented rally. However, now, with the S&P 500 hovering around 6,000 points and the Nasdaq near 20,000, the market appears to have lost its momentum.
I believe that for stock prices to rise further, there must first be a significant market pullback. A major decline implies that someone has already realized substantial gains, and understanding this dynamic is crucial.
Looking further back in time, investors who bought stocks at lower prices will eventually sell them at higher prices. This cycle continues to repeat itself.
There is no such thing as perpetual growth, just as there is no endless decline. Keeping this principle deeply in mind can lead to better investment decisions.

S&P 500 Breakdown | What’s Causing the Drop? The S&P 500 has broken down from a rising wedge pattern, triggering a sharp decline. Let’s break down why this is happening and what it could mean for the market.
🔍 Key Reasons for the Sell-Off
1️⃣ Rising Yields and Interest Rate Fears
The Federal Reserve’s stance on interest rates remains a major driver of market movement.
Recent economic data has delayed expectations of rate cuts, leading to a spike in Treasury yields.
Higher yields make equities less attractive, pushing investors toward bonds instead of stocks.
2️⃣ Overextended Market & Profit-Taking
The S&P 500 hit all-time highs recently, and many stocks had become overbought.
Large funds and institutions may be taking profits, especially in high-growth tech stocks.
This type of rotation can trigger a broader market pullback as traders lock in gains.
3️⃣ Technical Breakdown of Key Support Levels
The S&P 500 broke below critical support at 5,866, which has now turned into resistance.
The index also failed to hold key moving averages, confirming a technical breakdown.
Volume on red days has increased, showing strong selling pressure.
4️⃣ Weakness in Mega-Cap Tech Stocks
Big Tech stocks like NVDA, AAPL, and GOOGL, which have led the rally, are seeing a pullback.
This weakness drags down the overall index, as these stocks have an outsized influence on the S&P 500.
5️⃣ Geopolitical & Economic Uncertainty
Global tensions and rising oil prices are adding pressure to markets.
Concerns about slowing economic growth are also weighing on investor sentiment.
Earnings reports from major companies have been mixed, adding to the uncertainty.
What’s Next?
The S&P 500 could find support around 5,750 - 5,800 if the selling continues.
A rebound above 6,000 would signal strength, but failing to reclaim key levels could mean further downside.
The 200-day SMA is still holding, so bulls still have hope unless we see a deeper break.
Is this just a pullback, or are we seeing the start of a larger correction? Let me know your thoughts!
