BTC/USDT 125k? or 110k fall again?BTC/USDT 4H Analysis – July 20, 2025
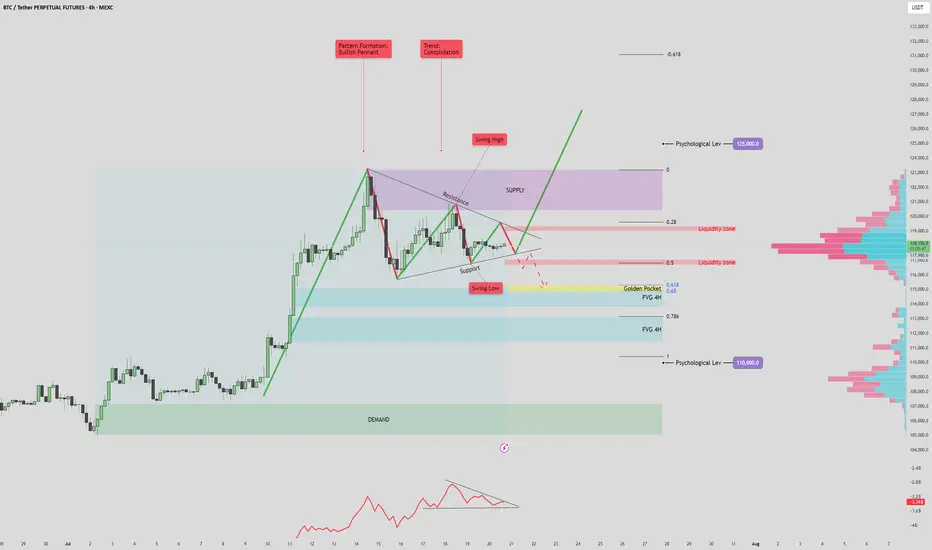
The current market structure shows a bullish pennant forming after a strong impulsive move upward, with price consolidating between key support and resistance levels. This pattern, combined with volume signals and key price zones, suggests a potential for a high-volatility breakout.
🔷 Volume Profile & OBV Insights
The On-Balance Volume (OBV) indicator is forming a symmetrical triangle, indicating a volume squeeze. This suggests a potential sudden spike in volume that could confirm the next major move.
Anchored Volume Profile (VPVR) on the right shows a notable low-volume area between 112K–115K. If price breaks below this zone, it could lead to a rapid selloff toward deeper fair value areas due to reduced liquidity support.
📈 Bullish Scenario
If price breaks above the pennant resistance and 119.5K liquidity zone, it may signal bullish continuation.
A successful retest of the breakout level as support would confirm strength, opening the door to:
Short-term target: 123K (supply zone and previous swing high)
Mid-term target: 125K (key psychological level and potential ATH)
Watch for confirmation via OBV breakout and strong bullish volume. Failure to sustain above the 118K–119K area could signal a bull trap.
📉 Bearish Scenario
A breakdown below pennant support and the 115K level would likely trigger a move into the low-volume range.
First key downside target: 114.7K–115.7K, which aligns with the Golden Pocket (Fib 0.618 zone) and a 4H Fair Value Gap (FVG).
This zone may act as a support or a liquidity grab reversal area.
If this zone fails to hold, deeper downside targets become likely:
FVG 2 (~112K)
Psychological support at 110K, which aligns with strong historical demand and a major VPVR node.
This bearish move may either confirm further downside momentum or present a fakeout opportunity if price sharply reverses from one of these deeper levels.
✅ Summary
BTC is coiled within a bullish pennant, with both bullish continuation and bearish breakdown scenarios in play. Volume confirmation and breakout direction will be key. Traders should monitor how price reacts around the 115K–118K zone for directional clarity. A move beyond this range, especially with volume support, will likely define the next trend leg.
S&P 500 (SPX500)
Wkly Market Wrap: Nifty Under Pressure, S&P 500 Hits Record HighThe Nifty 50 closed the week at 24,968, down 180 points from the previous week's close. It traded within a tight range, posting a high of 25,255 and a low of 24,918—perfectly aligning with the range I’ve been tracking between 25,600 and 24,700.
As I’ve been highlighting over the past few weeks, the monthly chart continues to show weakness, and now even the weekly chart is starting to reflect bearish signals. This growing weakness is a notable concern.
What to Watch for Next Week:
If Nifty sustains above 25,100, we could see a potential rebound toward the 25,400–25,450 resistance zone.
However, a breakdown below this week's low of 24,918 opens the door to a retest of key support near 24,500.
What’s interesting is that, despite Nifty’s indecision, the number of bullish stocks on the monthly time frame has increased significantly. Last week, there were 18 such stocks on my radar; now that number has jumped to 26, even after excluding about 10 others that showed bullish patterns but had high volatility.
This divergence—index showing weakness while quality stocks turn bullish—could indicate a possible bear trap being set by institutional players. If true, we might see a sharp short-covering rally after a final shakeout.
Nifty Outlook:
For the upcoming week, I expect Nifty to remain range-bound between 25,400 and 24,500. A decisive breakout or breakdown from this range could lead to sharp directional movement, so traders should stay alert.
Global Markets: S&P 500 Soars to New Highs
The S&P 500 closed at a record high of 6,296, with a weekly high of 6,315 and low of 6,201. The index remains in strong uptrend mode.
A breakout above 6,315 could see it testing 6,376, 6,454, and potentially 6,500 in the coming sessions.
My next major Fibonacci target is 6,568.
As long as 6,149 holds on a weekly closing basis, I continue to view every dip as a buying opportunity.
Final Thoughts:
The Indian markets are sending mixed signals, with the broader index showing caution while individual stock strength is quietly building. This divergence warrants a tactical approach—stay nimble, respect levels, and be ready for sharp reversals or breakouts.
Next week could be crucial. Stay focused, stay disciplined.

S&P 500: Buyers Are Still In Control! Continue To Look For LongsWelcome back to the Weekly Forex Forecast for the week of July 21-25th.
In this video, we will analyze the following FX market:
S&P 500 (ES1!)
The Stock Indices are strong, and showing no signs of selling off. Buy it until there is a bearish BOS.
Enjoy!
May profits be upon you.
Leave any questions or comments in the comment section.
I appreciate any feedback from my viewers!
Like and/or subscribe if you want more accurate analysis.
Thank you so much!
Disclaimer:
I do not provide personal investment advice and I am not a qualified licensed investment advisor.
All information found here, including any ideas, opinions, views, predictions, forecasts, commentaries, suggestions, expressed or implied herein, are for informational, entertainment or educational purposes only and should not be construed as personal investment advice. While the information provided is believed to be accurate, it may include errors or inaccuracies.
I will not and cannot be held liable for any actions you take as a result of anything you read here.
Conduct your own due diligence, or consult a licensed financial advisor or broker before making any and all investment decisions. Any investments, trades, speculations, or decisions made on the basis of any information found on this channel, expressed or implied herein, are committed at your own risk, financial or otherwise.

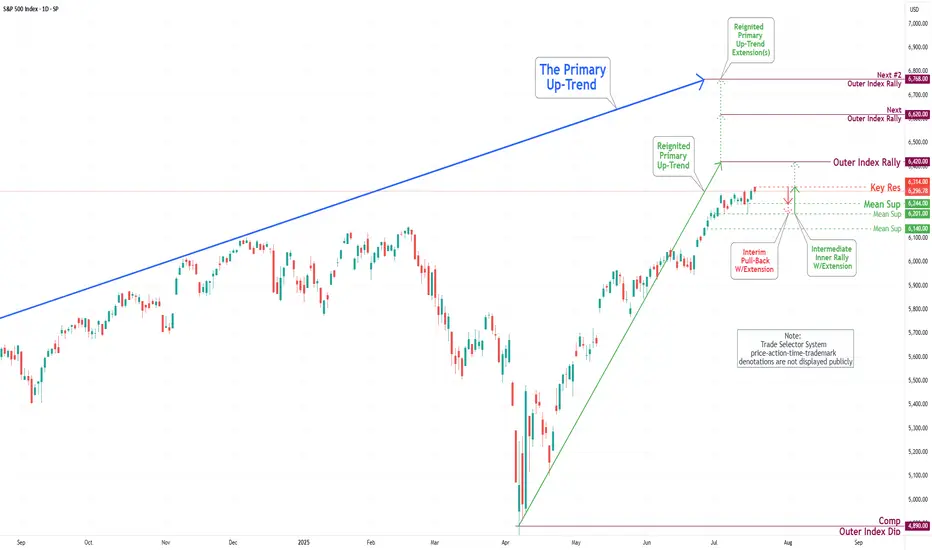
S&P 500 Daily Chart Analysis For Week of July 18, 2025Technical Analysis and Outlook:
During the current trading week, the S&P 500 Index has demonstrated a predominantly upward trajectory. It has successfully retested the Mean Support level at 6200 and established a new Key Resistance level at 6314. Currently, the index displays a bullish sentiment, with the objective for the Outer Index Rally set at 6420.
Nevertheless, it is essential to recognize that the current price action may result in a decline, potentially leading to a retest of the Mean Support at 6244 and extending to the Mean Support at 6201. Following this potential downward movement, it is anticipated that the index will resume its upward trend, driving the price action towards the Key Resistance level at 6314 and ultimately achieving the Outer Index Rally target of 6420.
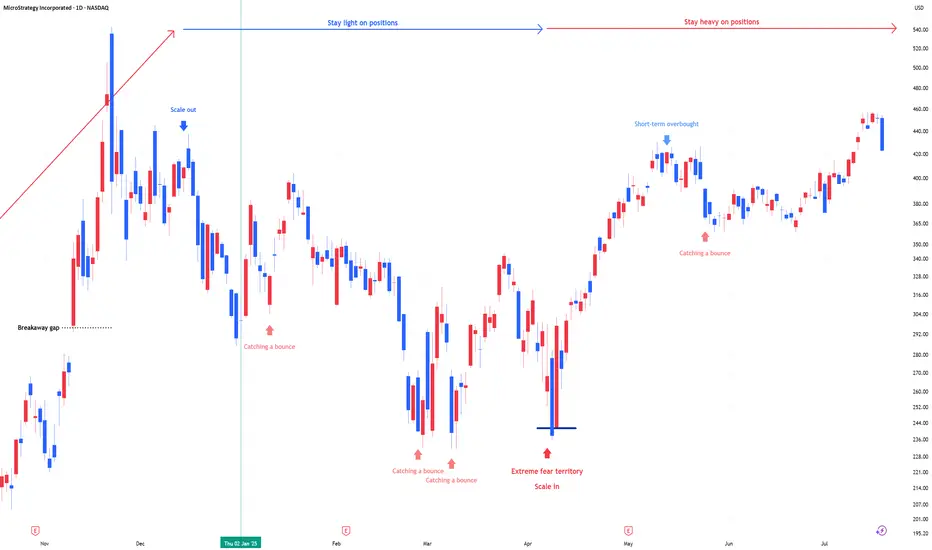
MSTR: Stay heavy on positions"MSTR position size is adjusted in line with US market and bitcoin signals for underweight or overweight allocations. During panic phases, 2x leverage ETFs are on the table."
Stay heavy on positions
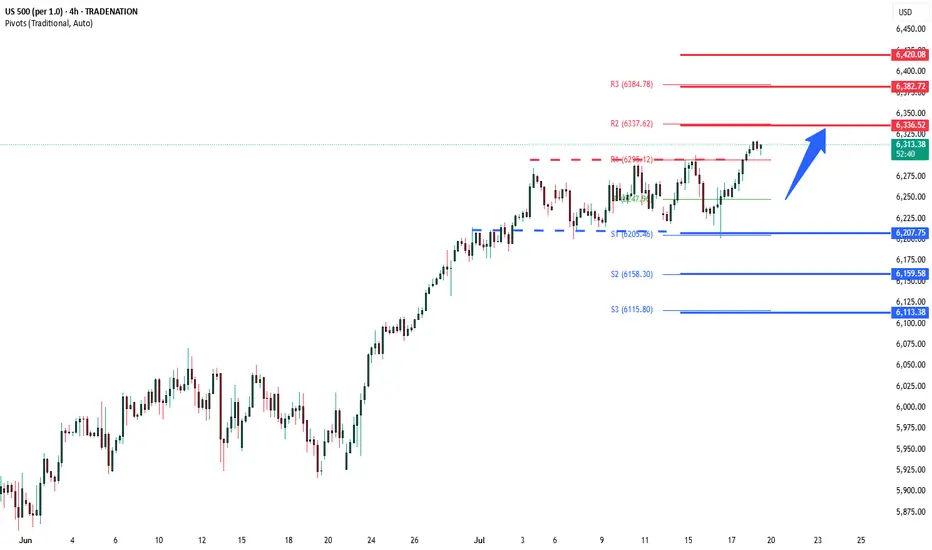
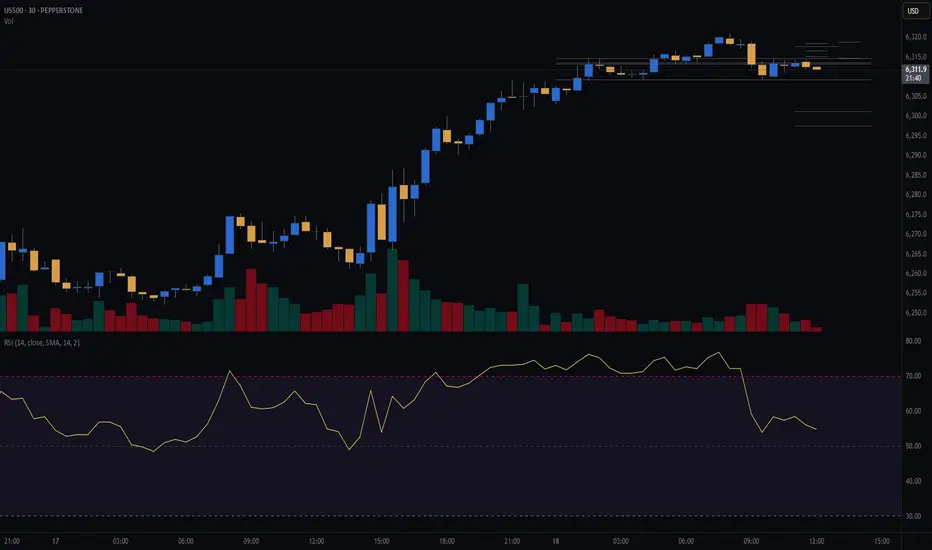
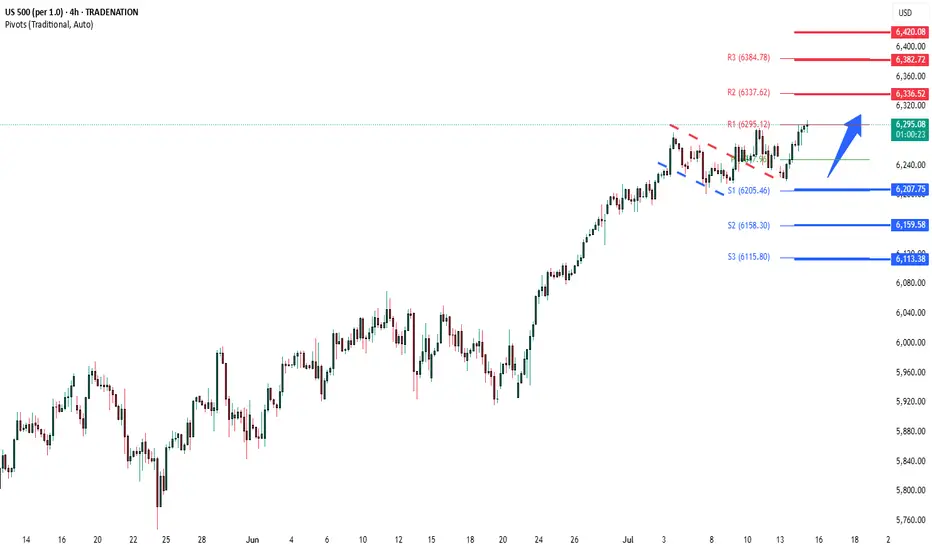
S&P overbought sideways consolidation supported at 6207 Fed Signals Rate Cut Ahead
US Federal Reserve Governor Christopher Waller called for a quarter-point interest rate cut this month, citing cooling inflation and minimal upside price risks. His dovish stance diverges from the broader FOMC consensus, which still views the labor market as resilient.
UK-Germany Defense Pact
UK PM Keir Starmer signaled potential alignment with Germany to purchase US weapons for Ukraine, following the signing of the “Kensington Treaty.” The accord emphasizes mutual defense cooperation, raising expectations of deeper UK involvement in European security initiatives.
Intel Concerns with Spain
US lawmakers raised concerns over intelligence sharing with Spain, due to the country's reliance on Huawei for its wiretap infrastructure, highlighting geopolitical tech tensions.
Trump Authorizes Epstein Testimony Release
President Donald Trump has authorized the release of grand jury testimony from the Epstein case, yielding to public and political pressure for greater transparency.
S&P 500 Outlook:
Waller’s call for a rate cut adds bullish momentum for equities, especially rate-sensitive sectors like tech and real estate. While geopolitical tensions and defense headlines introduce headline risk, the dovish Fed signal is likely to dominate sentiment in the near term. Expect S&P 500 support near 6207 with upside potential if more Fed officials echo Waller’s stance.
Key Support and Resistance Levels
Resistance Level 1: 6336
Resistance Level 2: 6383
Resistance Level 3: 6420
Support Level 1: 6207
Support Level 2: 6160
Support Level 3: 6113
This communication is for informational purposes only and should not be viewed as any form of recommendation as to a particular course of action or as investment advice. It is not intended as an offer or solicitation for the purchase or sale of any financial instrument or as an official confirmation of any transaction. Opinions, estimates and assumptions expressed herein are made as of the date of this communication and are subject to change without notice. This communication has been prepared based upon information, including market prices, data and other information, believed to be reliable; however, Trade Nation does not warrant its completeness or accuracy. All market prices and market data contained in or attached to this communication are indicative and subject to change without notice.
S&P500 (CASH500) (SPX500) SHORT - Head and shoulders 30minRisk/reward = 3.3
Entry price = 6314.8
Stop loss price = 6318.4
Take profit level 1 (50%) = 6301.3
Take profit level 2 (50%) = 6297.5
Waiting on validation from a few other variables.
For example, waiting for the current 30min candle to close in range.
Letssss goooooo
NVIDIA: Stay heavy on positionsNVDA position size is adjusted in line with US market signals for underweight or overweight allocations. During panic phases, 2x leverage ETFs are on the table
Stay heavy on positions.

RobinHood Markets: Stay heavy on positionsHOOD position size is adjusted in line with US market signals for underweight or overweight allocations. During panic phases, 2x leverage ETFs are on the table
Stay heavy on positions.

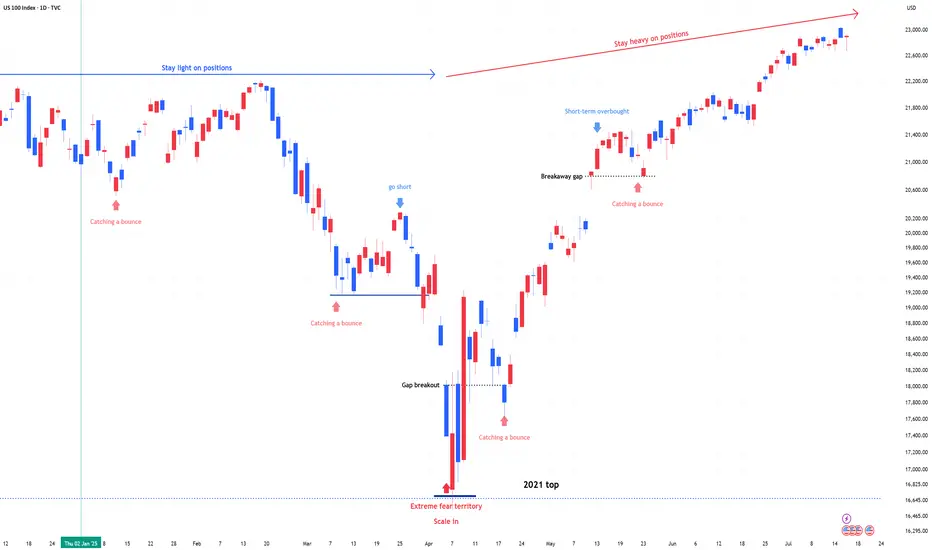
US 100 (NDQ) : Stay Heavy on Positions1) April Fear & Buy Signals
In early April, the Nasdaq 100 experienced a sharp sell-off, triggering extreme fear sentiment across the market.
At that point, scale-in buy signals appeared—classic "buy the fear" conditions.
2) Current Market State: No More Fear, but Watching
Since then, the market has stabilized.
The fear has disappeared, but we are still in a wait-and-see mode as traders assess the next move.
Momentum is holding, but participation remains cautious.
3) Stay Heavy on Positions
Despite short-term uncertainty, I’m maintaining an overweight position on the Nasdaq 100.
As long as we don’t see a major breakdown, the bias remains bullish.
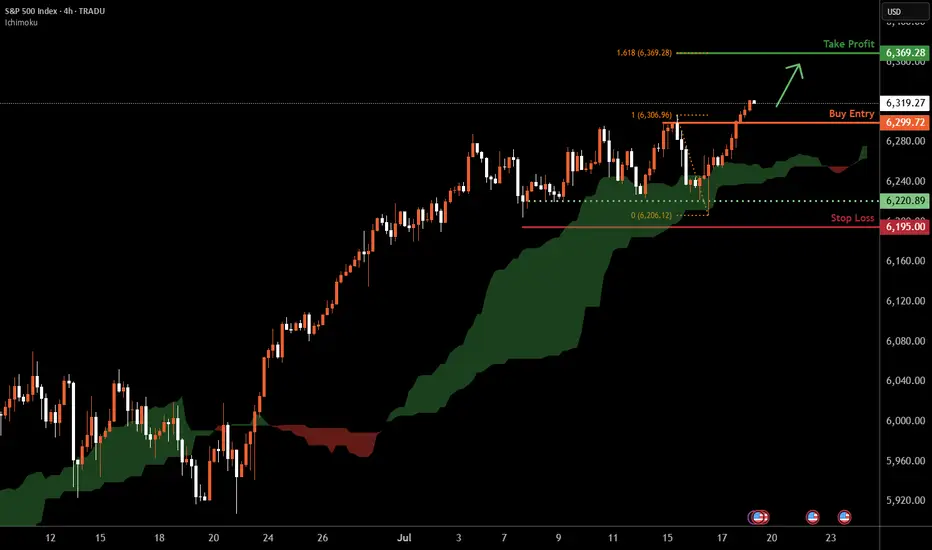
S&P 500 H4 | Making a run towards a new ATH?The S&P 500 (SPX500) is falling towards a pullback support and could potentially bounce off this level to climb higher.
Buy entry is at 6,299.72 which is a pullback support.
Stop loss is at 6,195.00 which is a level that lies underneath a multi-swing-low support.
Take profit is at 6,369.28 which is a resistance that aligns with the 161.8% Fibonacci extension.
High Risk Investment Warning
Trading Forex/CFDs on margin carries a high level of risk and may not be suitable for all investors. Leverage can work against you.
Stratos Markets Limited (tradu.com ):
CFDs are complex instruments and come with a high risk of losing money rapidly due to leverage. 66% of retail investor accounts lose money when trading CFDs with this provider. You should consider whether you understand how CFDs work and whether you can afford to take the high risk of losing your money.
Stratos Europe Ltd (tradu.com ):
CFDs are complex instruments and come with a high risk of losing money rapidly due to leverage. 66% of retail investor accounts lose money when trading CFDs with this provider. You should consider whether you understand how CFDs work and whether you can afford to take the high risk of losing your money.
Stratos Global LLC (tradu.com ):
Losses can exceed deposits.
Please be advised that the information presented on TradingView is provided to Tradu (‘Company’, ‘we’) by a third-party provider (‘TFA Global Pte Ltd’). Please be reminded that you are solely responsible for the trading decisions on your account. There is a very high degree of risk involved in trading. Any information and/or content is intended entirely for research, educational and informational purposes only and does not constitute investment or consultation advice or investment strategy. The information is not tailored to the investment needs of any specific person and therefore does not involve a consideration of any of the investment objectives, financial situation or needs of any viewer that may receive it. Kindly also note that past performance is not a reliable indicator of future results. Actual results may differ materially from those anticipated in forward-looking or past performance statements. We assume no liability as to the accuracy or completeness of any of the information and/or content provided herein and the Company cannot be held responsible for any omission, mistake nor for any loss or damage including without limitation to any loss of profit which may arise from reliance on any information supplied by TFA Global Pte Ltd.
The speaker(s) is neither an employee, agent nor representative of Tradu and is therefore acting independently. The opinions given are their own, constitute general market commentary, and do not constitute the opinion or advice of Tradu or any form of personal or investment advice. Tradu neither endorses nor guarantees offerings of third-party speakers, nor is Tradu responsible for the content, veracity or opinions of third-party speakers, presenters or participants.
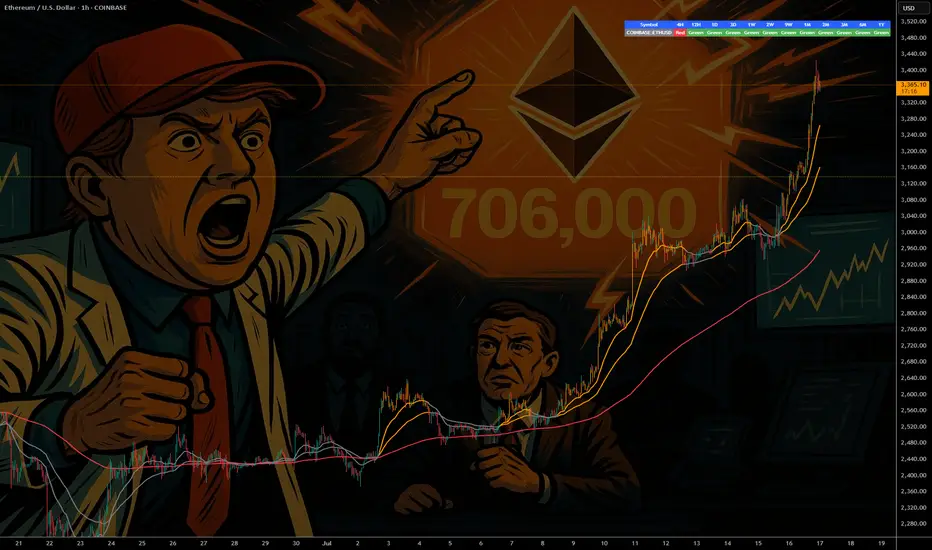
ETH - If You Know ...... You Know whats Coming
NYSE:BLK $BUIDL tokenized U.S.-Treasury fund launched on COINBASE:ETHUSD in Mar 2024—Wall Street is already settling real dollars on-chain.
NYSE:JPM JPMD stablecoin just went live on Base (an COINBASE:ETHUSD L2), piping wholesale payments from a $4 T balance-sheet straight through COINBASE:ETHUSD rails.
COINBASE:ETHUSD isn’t just riding the next crypto cycle—it’s becoming Wall Street’s settlement layer. From BlackRock’s on-chain Treasury fund to JPMorgan’s and soon Bank of America’s dollar tokens, a tidal wave of institutional stable-coin flows is lining up behind ETH. Fewer coins, more real-world volume—if you know, you know what’s coming.
NYSE:BAC CEO says they’ll issue a dollar-backed token the moment regulators nod—another tier-1 bank boarding the Ethereum train.
Stablecoin cap has blasted past $230 B , with 80 %+ of all on-chain transfers riding Ethereum (plus BSC) blocks.
Corporate settlements via stablecoins grew 25 % YoY in 2024 as multinationals replaced SWIFT with instant on-chain clearing.
Daily stablecoin throughput averages $7 B—each hop burning ETH and tightening supply.
BCG projects tokenized real-world assets to exceed $16 T by 2030 , with EVM chains as the default plumbing.
Over 500 M wallets already interact with stablecoins , a 30 % YoY surge led by emerging-market demand.
L2s like BINANCE:ARBUSDT & BINANCE:OPUSDT cut transaction fees 35 % yet still settle back to mainnet—meaning ETH captures the fee stream and the burn.
Bottom line: a tidal wave of bank-grade stablecoins + tokenized assets is lining up behind ETH; supply shrinks, demand soars—if you know, you know what’s coming.
quote] Marty Boots | 17-Year Trader — smash that , hit LIKE & SUBSCRIBE, and share your views in the comments below so we can make better trades & grow together!
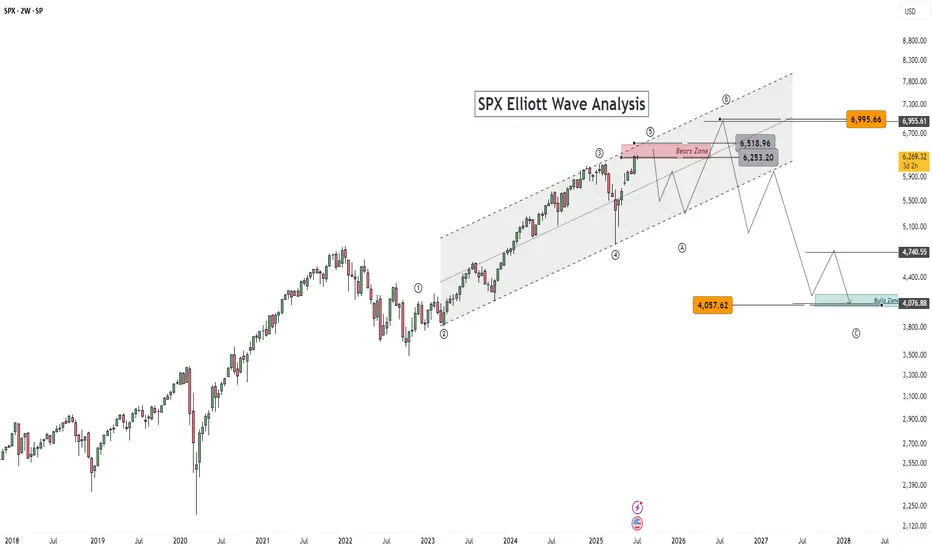
SP500 ES Weekly Recap | ATH Deviation → Pullback or Powell Pump?Overview:
ES made a new all-time high last week, sweeping the previous high with strong momentum.
However, the move ended up being a deviation, and the price quickly reversed — suggesting short-term exhaustion.
Bearish Scenario (Baseline):
🔻 Rejection from ATH
🔻 Possible retracement targets:
12H Swing Low (turquoise line)
Weekly Fair Value Gap (purple zone)
I believe a pullback into those levels could provide bullish continuation setups for new highs. I’ll look for LTF confirmation once price reaches those zones.
Bullish Scenario (Catalyst-Driven):
🚨 If Fed Chair Powell resigns this week (a circulating macro rumor), the market may not wait for retracement.
This could lead to an aggressive breakout, driving ES and risk assets straight into new ATHs again.
Plan:
✅ Watch for LTF confirmation after pullback
✅ Stay open to both scenarios
✅ Focus on HTF bullish structure as long as key levels hold

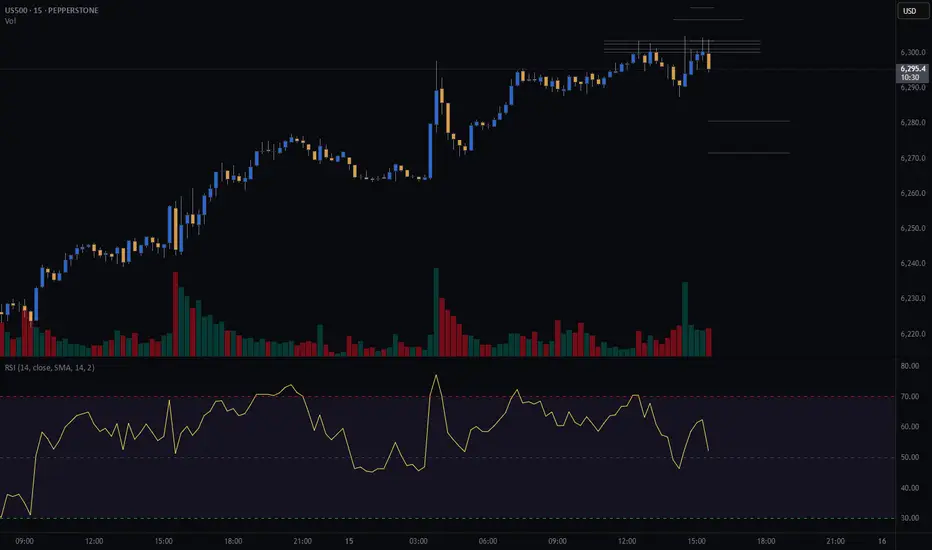
SPX500 Short From Resistance!
HI,Traders !
#SPX500 is trading in an
Uptrend but the price will
Soon hit a horizontal resistance
Area around 6285.44 from
Where we will be expecting
A local bearish correction !
Comment and subscribe to help us grow !

BITCOIN- MONSTER ORDERS IN THE BOOK -> You Know What This Means COINBASE:BTCUSD “Monster orders” are exceptionally large buy-limit orders clustered roughly 7 % beneath the current market price.
Large buy-limit walls can act like a price magnet—deep liquidity attracts algos and traders hunting fills, often pulling price straight toward the level.
Once the wall absorbs the selling pressure, the magnet flips: liquidity dries up, supply thins, and price can rip away from that zone with force.
They create a visible demand wall in the order book, signalling that whales / institutions are ready to absorb a dip and accumulate at that level.
Price will often wick into this zone to fill the wall, then rebound sharply—treat the 7 % band as potential support or entry.
Such walls can act as liquidity traps : market makers may push price down to trigger retail stop-losses before snapping it back up.
Confirm that the wall persists as price approaches and that spot + derivatives volume rises; if the wall disappears, it may have been spoofing.
Always combine order-book context with trend, momentum and higher-time-frame support for higher-probability trades, Just like the extremely powerful indicators on the chart.
🚀 Marty Boots | 17-Year Trader — smash that 👍, hit LIKE & SUBSCRIBE, and share your views in the comments below so we can make better trades & grow together!

Market Mood Sours as Inflation Surprises AgainU.S. stock markets were under pressure on Tuesday after new inflation data came in higher than expected. This has made investors rethink how soon the Federal Reserve might cut interest rates.
What Happened?
● The Consumer Price Index (CPI) recorded its biggest monthly rise in 5 months.
● Core inflation (which excludes food and energy) jumped by 2.9% compared to last year — more than the Fed's 2% target.
What It Means
● Investors had expected the Fed to cut interest rates multiple times in 2025.
● After the inflation report, they now think the Fed will cut less than expected.
● The chances of a rate cut in September also dropped sharply.
Market Impact
● Bond yields went up — the 10-year U.S. government bond yield rose to 4.49%, making borrowing more expensive.
● Stock futures fell (Dow, S&P 500, Nasdaq), as higher yields tend to hurt company profits and stock prices.
S&P 500 and Dow Struggle at Resistance
● Both the S&P 500 and Dow Jones faced resistance near all-time highs.
● This rejection suggests potential for further short-term pullback, especially if macro pressures like inflation and rate uncertainty persist.
Near-Term Outlook
With inflation running hotter than expected, hopes for early Fed rate cuts have cooled. Traders and investors should remain cautious, manage risk actively, and prepare for continued volatility in the coming weeks.

SPX500 LongThere is a lot of support at this level
There is a shark pattern on M15 and M30
All timeframes are oversold and there are multiple bottoms with divergence
This trade is with the trend
25 Pip stop loss

S&P 500 H4 | Approaching a multi-swing-low supportThe S&P 500 (SPX500) is falling towards multi-swing-low support and could potentially bounce off this level to climb higher.
Buy entry is at 6,220.89 which is multi-swing-low support that aligns with the 23.6% Fibonacci retracement.
Stop loss is at 6,170.00 which is a level that lies underneath a multi-swing-low support.
Take profit is at 6,299.72 which is a swing-high resistance.
High Risk Investment Warning
Trading Forex/CFDs on margin carries a high level of risk and may not be suitable for all investors. Leverage can work against you.
Stratos Markets Limited (tradu.com ):
CFDs are complex instruments and come with a high risk of losing money rapidly due to leverage. 63% of retail investor accounts lose money when trading CFDs with this provider. You should consider whether you understand how CFDs work and whether you can afford to take the high risk of losing your money.
Stratos Europe Ltd (tradu.com ):
CFDs are complex instruments and come with a high risk of losing money rapidly due to leverage. 63% of retail investor accounts lose money when trading CFDs with this provider. You should consider whether you understand how CFDs work and whether you can afford to take the high risk of losing your money.
Stratos Global LLC (tradu.com ):
Losses can exceed deposits.
Please be advised that the information presented on TradingView is provided to Tradu (‘Company’, ‘we’) by a third-party provider (‘TFA Global Pte Ltd’). Please be reminded that you are solely responsible for the trading decisions on your account. There is a very high degree of risk involved in trading. Any information and/or content is intended entirely for research, educational and informational purposes only and does not constitute investment or consultation advice or investment strategy. The information is not tailored to the investment needs of any specific person and therefore does not involve a consideration of any of the investment objectives, financial situation or needs of any viewer that may receive it. Kindly also note that past performance is not a reliable indicator of future results. Actual results may differ materially from those anticipated in forward-looking or past performance statements. We assume no liability as to the accuracy or completeness of any of the information and/or content provided herein and the Company cannot be held responsible for any omission, mistake nor for any loss or damage including without limitation to any loss of profit which may arise from reliance on any information supplied by TFA Global Pte Ltd.
The speaker(s) is neither an employee, agent nor representative of Tradu and is therefore acting independently. The opinions given are their own, constitute general market commentary, and do not constitute the opinion or advice of Tradu or any form of personal or investment advice. Tradu neither endorses nor guarantees offerings of third-party speakers, nor is Tradu responsible for the content, veracity or opinions of third-party speakers, presenters or participants.

This is just my Elliott Wave Analysis not financial Advice. $SPThis is just my Elliott Wave Analysis not financial Advice. SP:SPX #SPX SP:SPX
S&P500 (CASh500) Short - double top 15minEntry = 6303.4
SL = 6312.8
Take profit level 1 = 6280.7
Take profit level 2 = 6271.6
S&P500 Bullish breakout supported at 6207Trump’s $3.4 Trillion Tax Plan
Favors wealthy investors: Tax burden shifts based on how you earn, not how much.
Winners: Business owners, investors, high-income earners.
Losers: Immigrants, elite universities.
Trade Tensions
EU Tariffs: Brussels targets $72B in US goods (e.g., Boeing, cars, bourbon) in response to Trump’s tariff threats.
Impact: Risk to transatlantic trade; US open to talks.
US-China Tech Relations
Nvidia: Resumes H20 AI chip sales to China after US approval—boosted chip stocks.
Trump: To announce $70B in AI & energy investments today in Pennsylvania.
Trend: Signs of easing tensions between US and China.
Earnings Focus: Big US Banks
Q2 results (JPM, Citi, WFC, BNY Mellon, BlackRock) will highlight:
Net interest income: How rate levels affect profits
Loan growth & credit quality: Signs of lending strength or weakness
Capital markets activity: Trading & investment banking trends
Key Support and Resistance Levels
Resistance Level 1: 6335
Resistance Level 2: 6380
Resistance Level 3: 6420
Support Level 1: 6207
Support Level 2: 6160
Support Level 3: 6115
This communication is for informational purposes only and should not be viewed as any form of recommendation as to a particular course of action or as investment advice. It is not intended as an offer or solicitation for the purchase or sale of any financial instrument or as an official confirmation of any transaction. Opinions, estimates and assumptions expressed herein are made as of the date of this communication and are subject to change without notice. This communication has been prepared based upon information, including market prices, data and other information, believed to be reliable; however, Trade Nation does not warrant its completeness or accuracy. All market prices and market data contained in or attached to this communication are indicative and subject to change without notice.
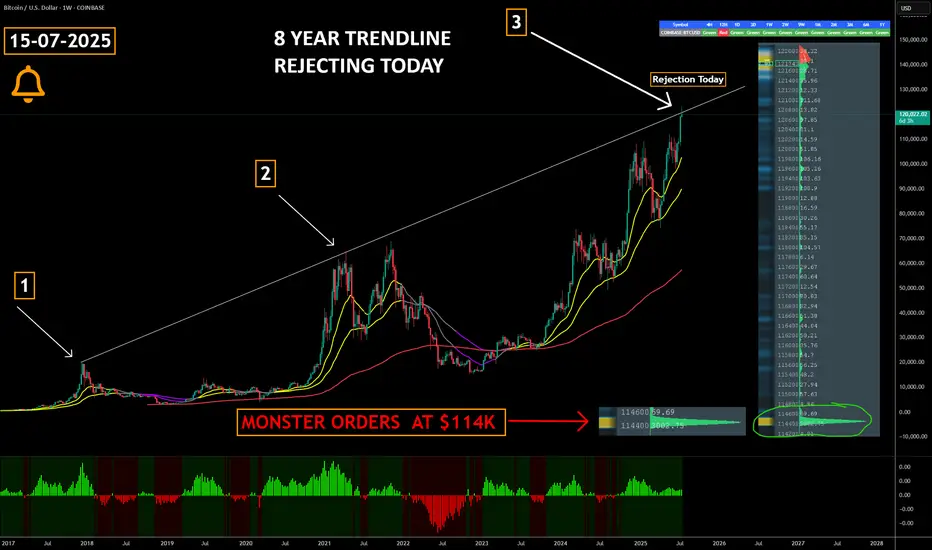
Did Bitcoin Just TOP OUT ??????
COINBASE:BTCUSD has just collided with an 8-year rising trendline that capped the market’s last two cyclical peaks—historically, this level has triggered multi-month corrections and Bear Markets.
Triple-test significance : a third touch of a long-term trendline ➜ heightened odds of a reaction; failure to break cleanly often confirms a major top.
Watch for confirmation signals —weekly bearish RSI divergence, waning volume, or rejection wicks can validate a reversal scenario.
Breakout = regime change : a decisive close and hold above the line flips it to support, opening the door to fresh price discovery and potential parabolic upside.
Large Orders at $114k create a visible demand wall in the order book, signalling that whales / institutions are ready to absorb a dip and accumulate at that level.
Risk-management alert : consider tightening stops, reducing leverage, or hedging until trendline fate is resolved.
The buy pressure has been relentless but this is always worth paying attention to
Marty Boots | 17-Year Trader — smash that , hit LIKE & SUBSCRIBE, and share your views in the comments below so we can make better trades & grow together!
SPX500 Update: Monster Trigger Ready to Launch!Welcome back, traders, it’s Skeptic from Skeptic Lab! 😎 With news of the unemployment rate rising, stock and crypto markets have been surging hard, and right now, we’ve got a killer trigger on SPX500 you don’t want to miss. Its breakout could spark the next major bullish leg. Let’s dive into the Daily and 4-hour timeframes to unpack this setup. here’s the play:
✔️ Daily Timeframe:
After a strong rally, SPX500 hit an all-time high (ATH) at 5,249.14 before entering a deep correction. Here’s what many traders miss: support/resistance levels aren’t static—they shift over time. The resistance that was at 6,146.89 has now climbed to 6,290. Breaking 6,290 signals the start of a major bullish trend after 146 days of correction. This is our primary long trigger.
📊 4-Hour Timeframe (Futures Triggers):
Long Trigger: After a solid uptrend with strong momentum, we entered a time-based correction within a box pattern. Breaking the box ceiling at 6,290 is the long trigger, aligning with the Daily breakout.
Short Trigger: Breaking the box floor would trigger a short, but this goes against the trend, so stop-loss risk is higher, and your win rate could take a hit—stay cautious.
📉 Key Insight: The 6,290 breakout is the big move to watch, fueled by market momentum from the unemployment news. Shorts are riskier due to the bullish trend, so prioritize longs with volume confirmation.
🔔 Confirmation: For longs, confirm the 6,290 break with RSI entering overbought.Risk management is critical—cap risk at 1%–2% per trade to survive the market’s swings.
🔼 I’ll update if the structure shifts! Thanks for vibing with this analysis! <3
💬 Let’s Talk!
Which SPX500 trigger are you locked on? Hit the comments, and let’s crush it together! 😊 If this update lit your fire, smash that boost—it fuels my mission! ✌️
