2025-01-15 - priceactiontds - daily update - sp500Good Evening and I hope you are well.
tl;dr
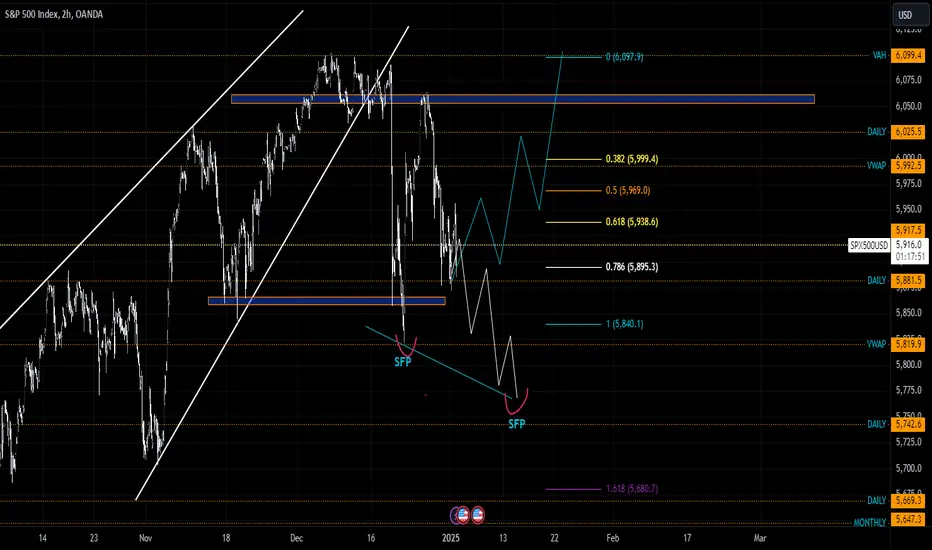
sp500 e-mini futures - Neutral around 6000. Market is close to the daily 20ema, bear trend line and big round number 6000. I won’t even think about longing this but it’s obviously wrong to short too early. As long as bulls keep it above 5950, they are good and in full control of the market. Targets above are 6030 and then 5050. If bulls break above the bear trend line, there aren’t many reasons why we could not just melt to 6100+.
comment: Huge bull day but right at multiple prior resistances. Bad buy no matter how you put it. I would actually not be surprised if we trade below 5950 or lower tomorrow. We have been going wildly up and down in this bear wedge/channel and that pattern is valid until clearly broken.
current market cycle: trading range (bear channel/wedge on the daily tf)
key levels: 5900 - 6030
bull case: Bulls got the big move from the CPI news and they want to test the bear trend line and break above it. It’s just not a good buy and hoping for a breakout. I won’t make stuff up here. If bulls break above 6020, next target is 6068 and then 6100.
Invalidation is below 5795.
bear case: Bears need anything to stop the rally. They have good arguments with the daily ema, bear trend line and big round number 6000. They came around the prior weeks and until that bear trend line is broken, I expect them to keep this a lower high as well. It would be pretty funny if we completely reverse today before we go into the weekend.
Invalidation is above 6030.
short term: Bearish below 5950 and bullish only above 6020. Neutral in between.
medium-long term - Update from 2024-12-22: Ultimately 5200-5300 in 2025. Again, rough guess as of now and since we have not seen a strong first bear leg, these targets are the lowest I am willing to give an honest outlook about. If bears surprise and we see a huge leg down to 5500, we will go much lower for the second and third leg.
current swing trade: None
trade of the day: Buying the double bottom on the 15m chart around 5956 was good.
S&P 500 (SPX500)

SPY/QQQ Plan Your Trade 1-15 Followup: Rally Into Jan 20-23This video was started to highlight the incredible predictive capabilities of my SPY Cycle Patterns and longer-term Cycle Research.
It seems almost impossible to be able to somewhat accurately predict future price moves - but I'm able to do it with moderate success - sometimes months and years into the future.
What does that mean to you - well, it should mean you want to pay attention to my research/videos and learn how to take advantage of my continued research.
This video highlights why the Doom-sayers are wrong. The markets will continue to trend upward until the 2030-2033 peak. That's when traders need to be prepared for a broad market downtrend.
But, it sure is fun getting emails and announcements from all the people that are now calling for a "great reset" to take place.
It may happen in certain countries, but this is a market of economies - not a single economic market. What happens in some countries does not always happen to all countries.
As the old saying goes - this is a market of stocks, not a stock market.
Get ready - the next 5+ years should be full of incredible opportunities for skilled traders.
Get some.
#trading #research #investing #tradingalgos #tradingsignals #cycles #fibonacci #elliotwave #modelingsystems #stocks #bitcoin #btcusd #cryptos #spy #es #nq #gold

S&P Scenario 2.1.2025In this market, in order to consider some long setups, we need to hold the 6060 level or something around it, and since we didn't hold this support, we had a way to go short after the breakout. Now I see a scenario like this: the market should come for the sfp below the low as shown, or it will start to rise directly into the long, but as long as we are below the 6060 level, I'm considering a long setup. I would take that if the sfp below the low was met.
SPY/QQQ Plan Your Trade For 1-15 : Inside BreakawayToday is going to be a very interesting day.
Mortgage data came in very strong, while CPI data came in moderately weaker. That is setting up a very strong GAP RALLY phase in the markets.
Shorts are going to get SQUEEZED HARD this morning, and I suspect we may see a carry-through rally lasting most of the day.
Be cautious of a pullback after the big GAP opening (higher) this morning.
Gold and Silver are attempting to move higher - which is perfect if the US Dollar weakens moderately. Overall, Gold and Silver are attempting to hedge risk factors into 2025.
Bitcoin will likely run into resistance just below $100k and attempt to fall downward again.
This is a very exciting week because it appears the markets are shaking off the debt/credit/yields concerns and moving back to normal.
Remember, where else will investors place their capital for Growth and Returns - other than the US? As I see it, the US markets are still the 900lb Gorilla in the global markets simply because of the ability of the US economy to rebound and recover much quicker than other foreign economies.
Get some.
BIG SHORT SQUEEZE this morning.
#trading #research #investing #tradingalgos #tradingsignals #cycles #fibonacci #elliotwave #modelingsystems #stocks #bitcoin #btcusd #cryptos #spy #es #nq #gold

Market Analisys: S&P 500SP:SPX
In recent months, the S&P 500 has experienced notable fluctuations:
1. All-Time High : The index reached a record high of 6,099.97 points on December 6, 2024.
2. Correction : It then faced a correction, dropping to a low of 5,805.65 points by January 8, 2025.
3. Current Performance : As of January 14, 2025, the index closed at 5,842.91 points, reflecting a slight 0.11% increase compared to the previous day.
4. Technical Outlook : Analysts highlight potential weakness, with the next support level identified at 5,771.5 points.
In summary, the SP:SPX has exhibited volatility, peaking in December 2024 and entering a correction phase in early 2025.
Let's analyze in detail the various phases that have led us to this point – starting from October 27, 2023, the last moment with a significant downturn.
Since then, we’ve seen an increase of about 50%, with a maximum drawdown of 10%. This represents a more than positive performance. Prior to this, we experienced a brief decline lasting around 90 days, with a drop of approximately 11%.
Subsequent rallies have generally been strong, although they have been shorter and more contained. In total, we’ve experienced 5 rallies and 5 pullbacks. Currently, we are in a downtrend.
As mentioned earlier, except for the first rally, the most significant one, recent bull runs have been consistently interrupted by unwelcome news, data that does not meet investor expectations, and announcements from the FED and ECB indicating that interest rate cuts will be smaller than anticipated. All of this has brought us to the current situation.
We are now facing a maximum decline of about 5-6%, with a bounce on the trendline that has been guiding us since October 2023. This is all happening as inflation data is released today. The market seems to have entered a phase where it seeks further confirmations from the economy, and the technical chart is showing exactly that. Additionally, we have several other key economic data releases scheduled for this week.
What do you think the market’s next move will be?

Awaiting Confirmation of Bullish ReversalFundamentally not so strong but the bearish moment is now fighting.
We do not have only one confirmation.
On Weekly Chart, We have a sluggesh Head and Shoulder pattern .before its tripple bottom .
The two patterns were undervalued by investors which lead the weekly close below its monthly support (note: monthly support was also confirmed by 61% Fibb Level on Monthly chart from its bottom till up.)
In my opinion, a weekly close above will create an engulfing bullish with the greater volume. Which may indicate the price to @280 area and a weekly close above @280 will disclose the price beyond 500:
OFFCOURSE ITS A LONG TERM GAME!

S&P 500 key levels and scenariosAfter Monday's reversal-looking candle, all eyes today will be on whether the bulls will be able to take charge and further erode the bears' control.
Earlier, weaker PPI data helped to fuel a rise in US futures, but since then we have seen a bit of a pullback from the highs, although nothin too alarming so far.
Key support to watch include Monday's high at 5843, followed by 5831. A daily close below this 5831-5843 area would be a bearish development. In that scenario, a drop to take out liquidity below Monday's range would then become a likely scenario.
Key short-term resistance comes in around 5873-5882 (shaded in grey). A daily close above this area could signal a trend resumption.
By Fawad Razaqzada, market analyst with FOREX.com

Earnings Season Cranks Up for Gainless S&P 500. What to Expect?The S&P 500 SPX is now showing nearly zero growth since Election Day, November 5. Markets were euphoric to see Donald Trump win the White House for another four years and pushed the S&P 500 to the rarefied air of 6,000 points and above. But that’s not the case anymore.
A flurry of data has poured cold water on that breakneck rally, including the latest nonfarm payrolls, which showed employers tapped a whopping 256,000 workers in December, far outpacing expectations of 156,000. The news fanned fears that the Federal Reserve might take its time in cutting interest rates — every investor’s biggest concern right now.
It’s up to the earnings season to rejuvenate a falling stock market. To many, the fourth-quarter earnings updates will be the most consequential event as it will also mark President Joe Biden’s departure and the arrival of the main character, Donald Trump.
First through the door, as is tradition, are the heavyweight players on Wall Street. This week traders will get to see the earnings results from big banks including JPMorgan JPM , Wells Fargo WFC and Goldman Sachs GS . In addition, the world’s largest asset manager BlackRock BLK will also post its performance.
The banks’ updates will provide a glimpse into investor appetite for big-shot dealmaking, business sentiment and also how daring and bold consumers were in their spending activity. Things like net interest income — how much the bank earned on interest after paying out deposits — will be a key gauge for the banking system’s health.
Here’s what’s coming from Wall Street’s household names (and some extra).
➡️ Wednesday, January 15, before the bell:
Citi C
Goldman Sachs GS
JPMorgan JPM
Wells Fargo WFC
BlackRock BLK
Bank of New York Mellon BK
➡️ Thursday, January 16, before the open:
Bank of America BAC
Morgan Stanley MS
U.S. Bancorp USB
Other earnings include UnitedHealth UNH .
Once markets digest the updates from the lending giants, the focus will shift to the next big thing — the Magnificent Seven . It’s a high bar once again for America’s most powerful corporate juggernauts.
Investors expect Mag 7 earnings to be up 22% from the same period last year while revenue is eyeballed to have grown 12.3%. The consensus views follow the elite club’s 32.9% earnings jump in the third quarter on revenue increase of 15.4%.
Fun fact: the Mag 7 members accounted for 23.1% of all profits in the S&P 500 for the quarter ending September. For the three months to December, they are expected to consume about a quarter of the earnings pie.
And for 2025, their market cap is projected to devour more than one-third of the S&P 500’s value, which is around $50 trillion. For the tech geeks, here’s the Mag 7 earnings slate:
➡️ Wednesday, January 29, after the closing bell:
Microsoft MSFT
Facebook parent Meta META
Tesla TSLA
➡️ Thursday, January 30, after the closing bell:
Apple AAPL
Amazon AMZN
➡️ Tuesday, February 4, after the closing bell:
Google parent Alphabet GOOGL
➡️ Wednesday, February 19 (tentative), after the closing bell:
Nvidia NVDA
Overall, the foresighted market gurus (i.e. the analysts) expect all companies in the S&P 500 to report a roughly 12% advance in quarterly profits compared to the year-ago quarter. For 2025, the consensus call is a 15% increase in corporate profits from last year.
There are, of course, the permabears among us who spell doom and gloom. They say that Donald Trump’s proposed tariffs could hinder corporate growth by raising prices for US companies that rely on overseas products. And if those companies decide to pass these costs to customers, then inflation might rear back up, throwing the markets into another painful cycle of higher interest rates.
What’s your take? Are you optimistic about the corporate earnings season? And are you excited to see more growth in 2025? Share your thoughts in the comments and let’s spin up the discussion.

SPY/QQQ Plan Your Trade For 1-14 : Harami/Inside PatternToday's pattern suggests the markets will stay somewhat flat/sideways related to building a base.
Yesterday, 1-13, my broad cycle patterns suggested the markets would establish a "base" - leading to a "peak" on 1-18 and a major top on 1-20. Because of this, I believe the markets will attempt to melt upward into a peaking pattern (with the SPY possibly reach 595-598) before stalling out ahead of the Inauguration event.
Gold and Silver may follow this trend after stalling a bit today. Overall, I believe Gold & Silver will move upward attempting to hedge against global risk factors playing out over the next 30+ days.
Bitcoin rejected the breakdown move yesterday - setting up another attempt at a THIRD sideways FLAG formation in an EPP pattern. This is very unusual - but given what the markets have been doing over the past 30 days - it is what it is.
More than likely, we'll see Bitcoin rally a bit higher (near $100k), then stall again and attempt another breakdown event.
Yesterday's new low suggests a breakdown is likely.
Get some.
#trading #research #investing #tradingalgos #tradingsignals #cycles #fibonacci #elliotwave #modelingsystems #stocks #bitcoin #btcusd #cryptos #spy #es #nq #gold

S&P ES Short setup target 5811 / Put SPY target 574Fibonacci technical analysis : S&P 500 E-mini Futures ( CME_MINI:ES1! ) has already found resistance at the Fib level 78.6% (6057.75) of my Down Fib. Last Daily candle (Jan 7) has closed below retracement Fib level 38.2% (5963.75). My Down Fib guides me to look for CME_MINI:ES1! to eventually go down to hit first target at Fib level -27.2% (5811.50).
S&P CME_MINI:ES1! – Target 1 at 5811.50, Target 2 at -61.8% (5731) and Target 3 at -78.6 (5691.75)
Stop loss slightly above the 50.0% retracement Fib level (5991.25).
Option Traders : My SPY AMEX:SPY chart (Down Fib from 602.48 to 580.50) shows price to go down to Target 1 at -27.2% (574.52), Target 2 at -61.8% (566.92) and Target 3 at -78.6 (563.22)
Stop loss slightly above the 50.0% retracement Fib level (591.50).

2025-01-13 - priceactiontds - daily update - sp500Good Evening and I hope you are well.
comment: Strong buying into US close and I expect 5900 to be hit tomorrow or Wednesday. The bear channel is valid until broken, so I want to either long closer to 5800 or short closer to 5900.
current market cycle: trading range (descending triangle on the daily tf)
key levels: 5800 - 6020
bull case: Bulls want to hit 5900 again and the bear trend line from the descending triangle. Their breakout late today is reasonably strong to expect follow-through tomorrow. I would not be surprised if we see early weakness and then a lower high around 5830/5840 before we move higher.
Invalidation is below 5795.
bear case: Bears will likely wait for 5900 and the bear trend line before they initiate bigger shorts again. Overall we see more two-sided trading today than a strong bull trend, which means the upside is likely limited and prior resistance will hold. Bears want to hit 5800 and likely somewhat lower to retest the October and November lows.
Invalidation is above 6030.
short term: Bearish closer to 5900 to trade back down to 5800 and longs only on a decent dip below 5850 again for target 5900.
medium-long term - Update from 2024-12-22: Ultimately 5200-5300 in 2025. Again, rough guess as of now and since we have not seen a strong first bear leg, these targets are the lowest I am willing to give an honest outlook about. If bears surprise and we see a huge leg down to 5500, we will go much lower for the second and third leg.
current swing trade: None
trade of the day: Buy low, sell high. Clear range 5820 - 5840 which was amazing to trade back and forth.

SPX500 Will Keep Falling!HI,Traders !
SPX500 broke the key
Horizontal level of 5825.23
While trading in a downtrend
So we are bearish biased and
We will be expecting a further
Bearish move down !
Comment and subscribe to help us grow!

SPY/QQQ Plan Your Trade For 1-13-25 : Inside BreakawayToday's video highlights some of the deeper, more detailed research I do behind the scenes for all of you.
My SPY Cycle Patterns are just one part of what I attempt to develop to identify opportunities and to help guide all of you toward success.
And, trust me, creating and reviewing all of this data, creating all this content, and staying ahead of the markets is not an easy task. It takes insight, knowledge, and experience to be able to try to read these charts, plan for what the markets are likely to attempt to do in the future, and try to convey that information to you in a concise format.
You'll see my suggestion the markets will attempt to establish a new low early this week, then REJECT and move higher into the Inauguration.
I know it seems counter-intuitive to suggest the markets are breaking downward while telling you to expect a REJECTION and a brief move higher - but price moves in waves - not in a straight line.
Gold and Silver are pulling down as the initial selling pressure drives a bit of a panic in metals. This downward move should end with a strong rally where Gold attempts to move above $2800.
Bitcoin, on the other hand, is the hard asset I believe will see the bigger decline - possibly targeting the $72-74k level before the end of February.
I believe the Excess Phase Peak pattern is confirming the move down to consolidation right now, and that low (possibly near $72-74k) will act as temporary support before a much deeper low is set.
Remember, we are just getting started into 2025. so we have lots of time to try to manage and trade our accounts into profits.
Get some.
#trading #research #investing #tradingalgos #tradingsignals #cycles #fibonacci #elliotwave #modelingsystems #stocks #bitcoin #btcusd #cryptos #spy #es #nq #gold

Strategy Winter — Spring 2025. S&P500 Index Choking DiagonalUS markets were shacked on Friday, January 10th, after the December NFP jobs report came in much stronger than expected.
The US economy added 256,000 jobs in December, well above the average economist estimate of 155,000. The unemployment rate unexpectedly fell to 4.1% from 4.2% in November, although it remains above its 6-month simple moving average.
The Nasdaq-100 immediately fell about 1%, while the yield on the 10-year US Treasury note jumped nearly 10 basis points to 4.785%, its highest since October 2023.
The strong payrolls report further strengthened the case for the Federal Reserve not to cut interest rates again until at least 2025.
The move in stocks and bonds is a continuation of what has been happening in recent weeks: After a period of mega-euphoric optimism, investors have begun to expect higher inflation driven by President-elect Donald Trump’s proposed trade and fiscal policies. If bond yields continue to rise, Americans will feel the brunt of it.
The CME FedWatch Tool shows that markets now expect just one rate cut of 25 basis points this year, down from as many as three at the end of last year. The odds of no rate cuts in 2025 more than doubled to 28% on Friday morning.
The dollar index TVC:DXY skyrocketed to the Moon, while the yield on 10-year U.S. sovereign bonds TVC:TNX stays well above 4.5%.
Endogenously, the market has been preparing for such turbulence for a long time, as discussed in the previously published idea “Strategy 2025. BTC Airless Scenario Below $100'000 Choking Point” .
I have to remind that the financial market had tough weeks in December 2024, but it could also face a tough year in 2025, as I noted then.
The market was on track for its worst weeks in years after the Federal Reserve gave a hawkish forecast for interest rate cuts in 2025. But looking at the market internals, it was clear that the damage had been done well before the December Fed meeting – and this signal was a historical indicator of tough times ahead.
Thus, Dow Jones Futures CBOT_MINI:YM1! ended 2024 with the 3rd RED WEEK in a row, forming the Bearish Candlestick Pattern "Three Black Crows" on the weekly timeframe, which developed, remarkably, from the all-time highs of the Dow Jones index.
Last week, Dow Jones Futures ended with the 6th RED WEEK in a row - and this is a rather rare event.
Historical backtest analysis over the past 25 years shows that this can lead to a further (at least) 10-percent drop for the Top-30 stock club.
Bulls have done a lot of work, advanced more than 2,000 points in 2023-24, for the S&P500 index. However they were unable to finalize their achievements confidently above the round 6-thousand mark by the end of 2024.
By the way, the same inability in Bitcoin to finalize 2024 above the round 100,000 mark is now repeatedly throwing the market back to lower price marks, as discussed in the recently published idea.
The main technical chart indicates a suffocating bearish diagonal in development for the S&P500 index, with targets for decline down to 5'250 points.

S&P 500 Index Drops to 2-Month LowS&P 500 Index Drops to 2-Month Low
On Friday, the US unemployment data was released, as reported by ForexFactory:
→ The unemployment rate dropped from 4.2% to 4.1%;
→ The number of new jobs (Non-Farm Employment Change) increased by 256,000 over the month, although analysts had forecast an increase of 164,000 (previous value = 212,000).
According to Reuters, the strong labour market data strengthened the market participants' view that the Federal Reserve will be cautious in cutting interest rates in 2025.
Based on CME Group’s FedWatch tool, traders expect the Fed to reduce borrowing costs for the first time in June and then keep it at that level for the remainder of the year.
Expectations that tight monetary policy will persist longer than usual have led to bearish sentiment. As a result, the S&P 500 index (US SPX 500 mini on FXOpen) dropped below the 5,800 mark this morning, its lowest point since early November.
Technical analysis of the S&P 500 index (US SPX 500 mini on FXOpen) shows:
→ A bearish Head and Shoulders (SHS) pattern is visible on the chart;
→ The price has broken below the median of the ascending channel (marked in blue).
The strengthening bearish sentiment may lead to:
→ The price fluctuating within the descending channel, the boundaries of which are already visible (marked in red);
→ The median of this red channel currently acting as support.
It is possible that the intensification of bearish sentiment will result in the S&P 500 index (US SPX 500 mini on FXOpen) declining towards the 5,700 level, which may be reinforced by the proximity of the lower boundary of the ascending channel.
This article represents the opinion of the Companies operating under the FXOpen brand only. It is not to be construed as an offer, solicitation, or recommendation with respect to products and services provided by the Companies operating under the FXOpen brand, nor is it to be considered financial advice.

Hellena | SPX500 (4H): Short to support area 5718 (Wave C).Dear colleagues, I believe that the downward movement will continue within the correction (A B C). I expect wave “C” to start moving very soon.
I think that the nearest target is the area of 5718 level, because there is a strong support area.
Manage your capital correctly and competently! Only enter trades based on reliable patterns!
