SPX500 Range-Bound Between 6223–6246 |Breakout Will Define TrendSPX500 – Technical & Fundamental Outlook
The SPX500 is currently trading within a narrow consolidation zone between 6223 and 6246.
A 1H or 4H candle close below 6223 would confirm a bearish breakout, with downside targets at 6191 and 6143.
Conversely, a 1H close above 6246 would signal bullish continuation, potentially driving the price toward the next resistance at 6287, followed by 6305.
Support: 6223 / 6191 / 6143
Resistance: 6287 / 6305
Fundamental Note:
The tariff situation remains a major driver.
Successful negotiations would likely boost bullish sentiment across indices.
Lack of progress may trigger renewed bearish momentum.
S&P 500 (SPX500)

Are We Completing the Larger Ending Diagonal Now?The last time I updated followers of my work; I stated that the pattern was advancing, but NOT with confidence, and that it is marked with choppy, overlapping price action that appears to be an ending diagonal. Those sentiments have not changed.
However, what has changed is I was forecasting a more pronounced drop first before getting to new highs. It is now possible; this move higher is completing that move on a more immediate basis. Although I cannot rule out the previous larger ABC... it is more likely once this high completes, it could represent the end of the bull market.
Only the structure of the decline will inform us what is playing out.
I will warn followers that once this more immediate high completes, I am expecting a forceful and swift reversal that will undoubtedly catch most traders off guard.
Best to all,
Chris

Decade-Long Uptrend Holds Strong – SPX Hits Fresh HighsS&P 500 Just Hit a New All-Time High (ATH) 🚀
The index has been in a strong uptrend for over a decade, consistently printing higher highs (HH) and higher lows (HL).
Every major resistance level has flipped into support, classic bull market structure.
Even during corrections, the 33 EMA and 100 EMA have acted like dynamic support zones.
Now that SPX has cleared its previous ATH, the structure remains intact, unless a strong breakdown occurs, momentum is still with the bulls.

SPX500 Bearish Breakout!
HI,Traders !
#SPX500 was trading along
The rising support line but
Now we are seeing a bearish
Breakout so we are bearish
Biased and we will be expecting
A further bearish move down !
Comment and subscribe to help us grow !

SPX500 Holding Bullish Structure – Eyes on 6287 BreakoutSPX500
The price maintains bullish momentum as long as it remains above 6225 and 6246.
Currently, the market is approaching the 6287 resistance level. A confirmed 4H candle close above 6287 is required to validate continuation of the bullish trend toward 6325.
However, a rejection from 6287 may trigger a short-term bearish correction, with potential pullbacks toward 6246 and 6225.
A sustained break below 6225 would shift the momentum to the downside, targeting the 6143 support level.
Pivot Level: 6264
Resistance: 6287 – 6325
Support: 6246 – 6225 – 6143

GOOGLE Count changed, Bullish outlook.I have adjusted NASDAQ:GOOG NASDAQ:GOOGL Elliot wave count with a wave 1 completing a leading diagonal backed up by a deep wave 2 correction into High Volume Node support (HVN). We potentially have another 1-2 with fast drop and recovery to the S1 daily pivot which would make long term outlook extra bullish by extending target.
Wave 3 is underway with a target of the all time hime high HVN for wave 5. The next resistance HVN is $191.
Price above the daily pivot and is continuing upwards after testing as support.
Analysis is invalidated below $162 swing low.
Safe trading

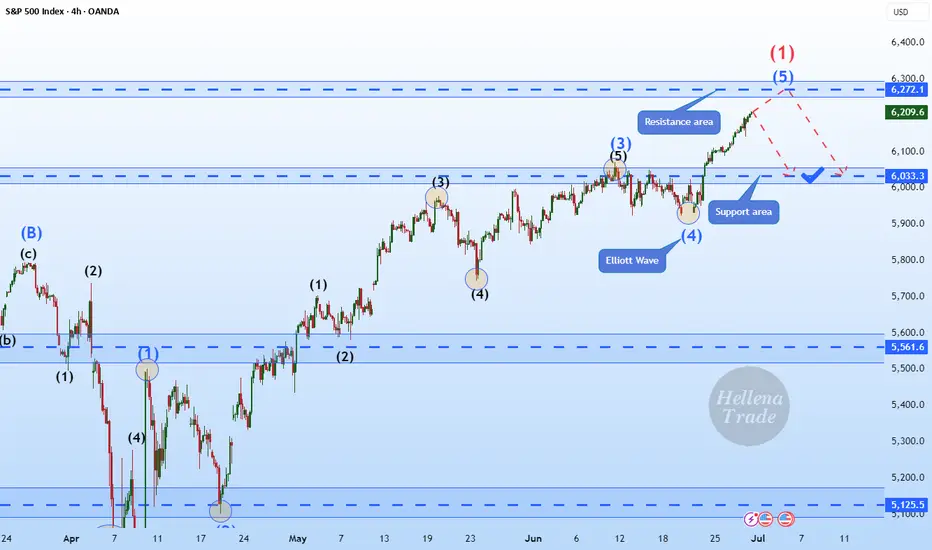
Hellena | SPX500 (4H): SHORT to support area of 6033.Colleagues, I assume that wave “1” completes the upward movement and somewhere around here a major correction ‘2’ should begin, which will consist of waves “ABC” and may continue to the level of 5700. But for now, I think we need to focus on the nearest targets.
I see the support area of 6033 as the first target.
Manage your capital correctly and competently! Only enter trades based on reliable patterns!
SPY (S&P500 ETF) - Daily Golden Cross and All-Time-High PriceSPY (S&P500 ETF) price has reached all-time-highs in July 2025, after a SMA Golden Cross printed on the daily chart.
SPY is still in a price uptrend since May 2025, however a higher-low pullback has not occurred for the past two weeks.
Resistance levels: $625, $630, $635, $640.
Support levels: $622, $617, $614, $611.
A significant reversal or bearish candle pattern has not occurred yet on either the daily or weekly charts.
The Stochastic RSI indicator has reached overbought levels, both on the Daily chart and Weekly chart.
Stock market earnings season begins in July 2025, trade deal negotiations and new tariffs are in progress this week. Volatility could increase this month due to these news catalysts.

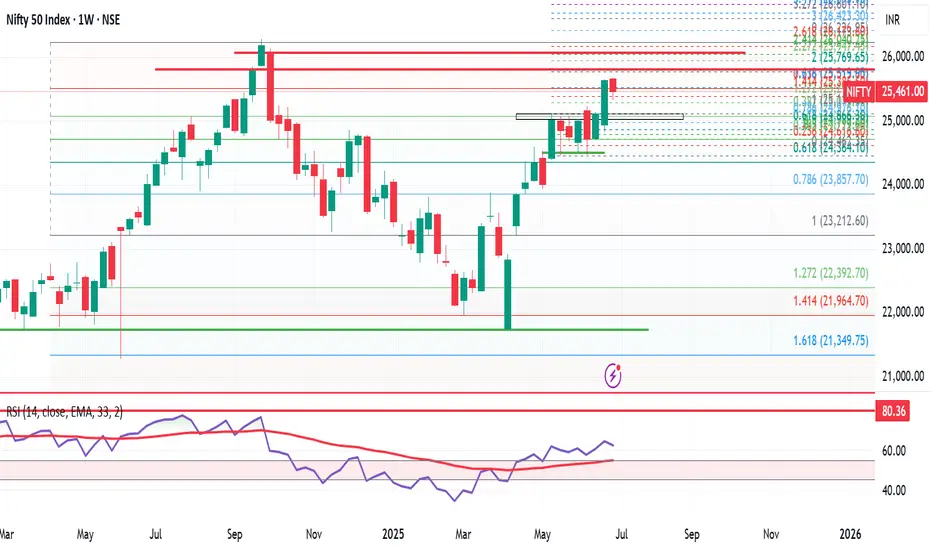
Nifty Wkly Update: Market Cools Off,But Bulls May Regain ControlNifty closed the week at 25,461, down 176 points from last week's close. It touched a high of 25,669 and a low of 25,331—a clear sign of consolidation and short-term correction.
As I highlighted last week, it was a smart move to book partial profits or trail your stops, especially after the strong upmove. And here we are—a healthy pullback, exactly what we anticipated.
But things are about to get interesting...
Reliance, the heavyweight of Nifty, is turning bullish on the monthly chart—a strong signal for potential upside. As long as Reliance remains bullish, it's wise to focus on bullish opportunities only.
Nifty Outlook for Next Week:
Expected Range: 25,000 – 25,900
Strategy: Buy on dips while Reliance stays strong.
Sentiment: Cautiously bullish
Global Cue: S&P 500 Hits All-Time High!
The S&P 500 closed at a record 6,279, up nearly 100 points from last week. If it breaks above 6,284, we could see a rally toward:
6,376
6,454
6,500
6,568 (key level to watch)
However, a break below 6,177 could pull it back to 6,050/6,040.
My take: S&P 500 is in beast mode, and as it climbs, it’s likely to drag Nifty higher too. The broader market is turning bullish—momentum is shifting in favor of the bulls.
Final Thought:
Bulls are loading their guns, and bears might want to take a nap for the next 10–15 days. The trend is your friend—for now, let the bulls enjoy the ride!
SPX Expansion with Historical DataGood morning everyone!
This week I wanted to elaborate more on my previous idea of SPX with the historical data that led to this analysis. This is almost all fundamental analysis adding in the retracement percentages which can also be evaluated through some technical instruments.
Unemployment rate is currently at 4.1%, with inflation at 2.4%. Based on the data, it is evident the market is currently in an expansion period which is why the narrative that we will see 2 interest rate drops by the end of year continues to diminish. I think we will probably see 1 before the year ends and that would just fuel the market and gain momentum to the upside.
If we were to measure the expansion of SPX going back to the 2000's, we get an extension of at least 75%. If we were to extend 75% based on the previous swing high (6,147) we could see future SPX price at 8,500. Now, do your own research, but the data is here. I expect the market to possibly retest previous high, but if you did not enter during the dip, no worries. There is still plenty of upside potential and better late than never.
Remember... CASH FLOW IS KING!
Avoid all the noise and distractions. The job of many platforms out there is to have something to put out for the public EVERYDAY! A good amount of that is noise. Look for macroeconomic news and let that be your indicator.
Historical Data:
(1) .com Bubble (2000 - 2002) We had a 50% drop of SPX. This lasted for almost 2 years before recovery.
(2) Housing Market (2007 - 2009) The SPX dropped 57% due to the collapse of subprime lenders collapsing. Housing prices decline drastically leaving people with high mortgage payments than what their homes are actually worth leading to a wave of foreclosures.
(3) Covid (2020) This was a global event with government mandated shutdowns causing the entire financial markets to come to a halt. Many business closures that led to jobs loss with an unemployment rate of approximately 15%.
(4) Inflation & Rate Hikes (2022) When Covid happened, upon recovery market expanded way too fast causing inflation to rise and the Feds to increase interest rates to slow down the economy.
(5) Tariffs (2025) Will stay away from politics on this one, however, a rebalancing of trade has taken place with some countries still working on tariff deals with the U.S. This has caused huge uncertainty for companies and corporation. VIX (fear index) reached 60.13.
Hope you enjoyed this post. Have a great rest of your week, don't forget to like and follow and Happy Trading!

SPX: highly optimisticThe US market celebrated on Friday the US Independence Day, after highly optimistic last two weeks. Almost every day, the S&P 500 was reaching new all time highest levels, finishing Thursday trading session at 6.279. At this moment this is officially treated as a new ATH for the index. The optimism was supported by better than expected US jobs data posted during the previous week. The NFP added 147K new jobs in June, which beated market expectations. The strong US payrolls reinforced market confidence despite concerns over trade tariffs. With inflation remaining sticky and solid jobs growth, markets have increased expectations of the Fed's rate cut in September. Currently, there is relatively low odds that the next rate cut might occur at the Julys FOMC meeting.
Tech companies were again those who led the index to the upside. The leader was for one more time Nvidia, with a weekly surge of 9,7%. AMZN was traded higher by 6,3%, MSFT by 3,9%. TSLA was struggling a bit, ending the week 0,33% higher from the week before.
Weekly news regarding trade tariffs include a US-Vietnam trade deal of 20% tariffs on imports from Vietnam. At the same time, the US exports to Vietnam will be tariffs-free. However, markets are still concerned regarding the final resolution of imposed 90-days delay of implemented tariffs for almost 180 countries around the world, a period which expires in July. On the other hand, Trump's tax mega bill was passed by the US Senate on Tuesday, and is currently awaiting final approval from the House. There were many discussions during the previous period that this tax mega bill might further increase US debt levels, which will be negatively reflected in the economy.

SPX Is Pure RiskAbsolutely insane for people to be saying things like "a new bull market" when it never ended. All of the risk is to the downside. If markets ran another 10% to the upside that gives investors a chance to determine if they want to buy a correction to see new highs or not. But to say that a bull market is coming is the antithesis of thinking when current risk is all downside.
This is risk management 101:
Lets say you have a SP:SPX target of 10,000, would you rather buy it at 6,500 where you know your downside is 7-8% or right here at 6300 with a potential downside of 22%+?
Who in the market is long right now? Everyone because all the short sellers are stopped out, and the dumbest of money the guys who just got promoted to the rank of captain in the branch of hindsight bought the "breakout."
The retracement to the highs has been one of the most hated rallies off of a bounce ever seen and why? Because it required a large amount of vibes and to a degree stupidity to buy where it bounced but it paid off. So if it was borderline stupid to do that, what does it mean to lever up at the top?
The correct method is to either be short here or be patient for a breakout with volume and a successful retest. There you can limit your downside and have nearly unlimited upside if it plays out that way.

SPY/QQQ Plan Your Trade End Of Week Update For 7-4Happy 4th of July
I've been very busy with projects and new tools for traders, as well as the new book I'm working on, and thought I would deliver an End Of Week update for everyone.
In this video, I cover the past Cycle Patterns and how they played out for the SPY/QQQ, Gold/Silver, and Bitcoin, as well as add some of my own insight related to the market trends.
All of my systems are still LONG and have not changed. I still believe this market is extremely overbought, and I believe it could roll over at any moment into a pullback - but we need to wait to see if/when that may/does happen.
Gold made a big move higher this week, and I believe that move could continue throughout July.
Bitcoin made a surprising Double-Top and is not rolling downward. Could be a breakdown in the markets as BTCUSD tends to lead the QQQ/NQ by about 3-5 days.
The SPY/QQQ rallied like a rocket all week. It was absolutely incredible to see the markets rally like this. But, I'm still cautious of a sudden rollover top.
I managed to catch some nice trades with options spreads this week, and my metals positions were on fire. I'm still trading from a "hedge everything" mode as I don't trust this rally, and I'm still watching for REJECTIONS near these new highs.
Stay safe and GET SOME.
DM me if you have any questions.
#trading #research #investing #tradingalgos #tradingsignals #cycles #fibonacci #elliotwave #modelingsystems #stocks #bitcoin #btcusd #cryptos #spy #gold #nq #investing #trading #spytrading #spymarket #tradingmarket #stockmarket #silver

S&P 500 Daily Chart Analysis For Week of July 3, 2025Technical Analysis and Outlook:
During this abbreviated trading week, the S&P 500 Index has primarily shown an upward course, hitting and surpassing our target for the Outer Index Rally of 6235. Currently, the index demonstrates a consistent bullish trend, with the following objective for the Outer Index Rally set at 6420, followed by forthcoming targets of 6620 and 6768. Nevertheless, it is crucial to acknowledge the current price action may cause prices to retrace from their current fluctuation to test the Mean Support at 6200 before resuming their upward movement.

SPX500 Holds Above 6,225 – Bullish Trend Intact for NowSPX500 Update – Bullish Pressure Holds Above Pivot
SPX500 continues to show bullish momentum, as highlighted in our previous analysis. The price remains supported by strong buying volume above the key pivot zone at 6,225.
As long as the price stays above this level, a retest toward 6,225 remains possible before another leg higher.
However, a confirmed break below 6,225 would signal potential bearish momentum and shift the short-term structure.
Key Levels:
• Pivot Line: 6,246
• Resistance: 6,265 / 6,287 / 6,325
• Support: 6,225 / 6,191 / 6,143

S&P 500 Hit Record High Ahead of Holiday BreakS&P 500 Hit Record High Ahead of Holiday Break
Today, financial markets in the United States are closed in observance of Independence Day. Investor sentiment was likely buoyed by the latest rally in the S&P 500 index (US SPX 500 mini on FXOpen), which set a new all-time high yesterday, surpassing 6,280.
The bullish momentum has been driven by robust labour market data in the US. According to ForexFactory, analysts had anticipated a rise in the unemployment rate from 4.2% to 4.3%, but instead, it unexpectedly declined to 4.1%.
Can the stock market continue to climb?
Technical Analysis of the S&P 500 Chart
Analysing the 4-hour chart of the S&P 500 index (US SPX 500 mini on FXOpen)on 30 June, we observed the following:
→ An ascending channel was formed (indicated in blue);
→ A developing bullish impulse (marked with an orange line) suggested the price would move towards the upper boundary of the channel – a scenario that materialised with yesterday’s rally (as shown by arrow 1).
However, from a price action perspective, the recent downward move (arrow 2) has now gained significance. It may indicate that sellers are becoming more active around the identified resistance level.
Should the price decline towards the lower orange line, this could negate the current bullish impulse altogether, effectively reflecting a classic bearish engulfing pattern.
Given the above, there is reason to believe that bears are attempting to regain control after the S&P 500 (US SPX 500 mini on FXOpen) surged over 5% in the past 10 days. As such, a potential breakout below the orange line cannot be ruled out, with price action possibly targeting the median of the blue ascending channel.
What happens next?
The market’s trajectory will largely hinge on developments related to tariffs. Trade policy will remain in the spotlight next week, as key deadlines set by the White House approach — events that traders will be closely monitoring.
This article represents the opinion of the Companies operating under the FXOpen brand only. It is not to be construed as an offer, solicitation, or recommendation with respect to products and services provided by the Companies operating under the FXOpen brand, nor is it to be considered financial advice.

SPX500 at New ATH – Will NFP Fuel the Next Leg Up? SPX500 Outlook: Trade Optimism Fades as Focus Shifts to U.S. Jobs Data
Caution prevails ahead of today’s high-impact U.S. Nonfarm Payrolls report, which could be pivotal for the July rate cut narrative. A weaker print may support risk assets and push SPX500 higher, while a strong report could dampen momentum.
Technical Analysis (SPX500):
SPX500 has printed a new all-time high and is now targeting 6287, especially if the index closes above 6246 on the 1H chart.
As long as price holds above 6225 (pivot), the bias remains bullish, with potential upside targets: 6287 & 6325
However, a 4H close below 6213 would suggest a correction toward: 6190 & 6143
Key Levels:
• Resistance: 6287 / 6325
• Support: 6190 / 6143
Stay alert — today's NFP report could trigger major moves across indices and FX.

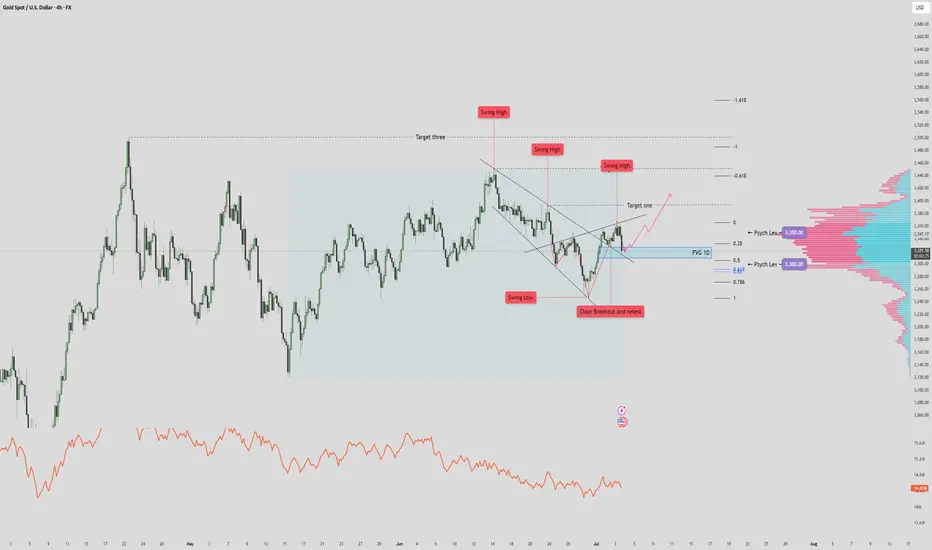
XAUUSD $3500 Recovery? Reverse Heads and Shoulders? 🔎 STRUCTURE & TECHNICAL ELEMENTS
1. Pattern:
A falling wedge was formed and broken cleanly to the upside → bullish reversal structure.
Breakout was followed by a successful retest at prior structure lows (marked “Clear Breakout and Retest”).
2. Fair Value Gap (FVG 1D) Zone:
Currently being tested. This zone coincides with:
Minor support from prior consolidation
Fib retracement (0.5 level)
Potential demand area (watch for bullish reaction/candle structure here)
3. Volume Profile:
3,350 = POC (Point of Control) → heavy resistance.
3,300 = Secondary HVN → strong support below current price.
Low-volume nodes just under current price → if broken, price likely accelerates into the GP zone.
4. Fibonacci & Liquidity Confluence:
Golden Pocket (3287) just below 3,300 = ideal liquidity draw if FVG fails.
Target 1 / 2 / 3 above are Fibonacci-based projections + historical swing zones.
✅ SCENARIO 1: Bullish Case – FVG Holds
If price respects the FVG 1D zone, expect:
Continuation up toward Target One (~3,430)
Extension to Target Two (~3,470) and even Target Three (~3,540+) possible
Confirmation: Bullish engulfing / high-volume bounce / sweep of intraday lows without close below FVG
Bias: Bullish continuation as long as price holds above FVG/0.5 Fib
🚨 SCENARIO 2: Bearish Case – FVG Breaks Down
If price closes below FVG zone, particularly below 3,312:
High probability drop toward 3,300 (psych level)
Liquidity sweep and deeper correction into Golden Pocket (~3,287) likely
This area can act as a high-probability long re-entry zone
Bias: Short-term bearish if close below FVG + swing structure invalidation
⚖️ REFINED SUMMARY
Price rejects off FVG - we can expect target 1 and 2 tagged.
Price breaks & closes below FVG zone - we can expect it to drop/wick to 3,300
S&P500 bullish ahead of US employment- NFP numbersHouse Republicans moved Trump’s major tax and spending bill closer to a final vote, which could happen before his July 4 deadline. The package includes tax cuts, immigration funding, and the rollback of green energy incentives. Gamblers are raising concerns about a tax increase in the bill that could affect them.
In trade news, the US eased export rules on chip design software to China as part of an ongoing deal. China’s tone has shifted more positively, with a top official saying he’s hopeful about US-China relations and that conflict between the two is “unimaginable.”
At the Fed, Chair Jerome Powell hasn’t said if he’ll step down when his term ends in May, adding uncertainty. Trump, who wants a loyal replacement, has called for his resignation after a federal agency accused Powell of giving misleading testimony about expensive Fed building renovations.
On Wall Street, value investing made a comeback last quarter. Over 60% of active value fund managers beat their benchmarks by buying cheap industrial stocks and avoiding underperforming sectors like utilities and consumer staples.
Conclusion:
US equities are steady but cautious. Uncertainty around Fed leadership and Trump’s economic plans is keeping markets in check, while improving US-China trade relations and a shift toward value stocks are offering support.
Key Support and Resistance Levels
Resistance Level 1: 6260
Resistance Level 2: 6307
Resistance Level 3: 6355
Support Level 1: 6130
Support Level 2: 6090
Support Level 3: 6055
This communication is for informational purposes only and should not be viewed as any form of recommendation as to a particular course of action or as investment advice. It is not intended as an offer or solicitation for the purchase or sale of any financial instrument or as an official confirmation of any transaction. Opinions, estimates and assumptions expressed herein are made as of the date of this communication and are subject to change without notice. This communication has been prepared based upon information, including market prices, data and other information, believed to be reliable; however, Trade Nation does not warrant its completeness or accuracy. All market prices and market data contained in or attached to this communication are indicative and subject to change without notice.

$TSLA Time to Fade or..?NASDAQ:TSLA (like NASDAQ:GOOG ) is standing out to me as bullish, yet, corrective Elliot Waves a higher degree series of ABCs appear to be underway.
A final wave C appears to be underway which would take price too all time highs in an expanded flat correction pattern. My count could be wrong and the interference could be from the increase it sentiment volatility connected to the US headlines lately and Trump posting on socials. Things may get back to normal after the summer and a clearer pattern may emerge.
Price is struggling to get past the weekly pivot point bullishly or the weekly 200EMS bearishly and is trapped within that range.
For now long term target is the R2 daily pivot at $693 as the higher probability is continued upside
Safe trading

$SPX500 Most Hated Rally to Continue?FOREXCOM:SPX500 continues into price discovery suggesting a wave (3) is still underway but nearing a its minimum target of the 1.618 Fibonacci extension target $6310. Overextension of this target will demonstrate an even stronger bullish outlook.
Long term terminal targets remains above $7000 for me.
A short term pull back is a high probability but markets can stay irrational longer than participants can stay liquid.
Safe trading

Datadog's S&P 500 Entry: A New Tech Paradigm?Datadog (DDOG), a leading cloud observability platform, recently marked a significant milestone with its inclusion in the S&P 500 index. This pivotal announcement, made on July 2, 2025, confirmed Datadog's replacement of Juniper Networks (JNPR), effective before the opening of trading on Wednesday, July 9. The unscheduled change followed Hewlett-Packard Enterprise Co.'s (HPE) completion of its acquisition of Juniper Networks on the same day. The market reacted robustly, with Datadog shares surging by approximately 9.40% in extended trading following the news, reaching a five-month high and underscoring the anticipated "index effect" from passive fund inflows. Datadog's market capitalization, approximately $46.63 billion as of July 2, 2025, significantly exceeded the updated S&P 500 minimum threshold of $22.7 billion, effective July 1, 2025.
Datadog's financial performance further solidifies its position. The company reported $762 million in revenue and $24.6 million in GAAP net income for the first quarter of 2025. For the full year 2024, Datadog generated $2.68 billion in revenue. While the document suggested a cloud observability market valued at "over $10 billion," independent verification from sources like Mordor Intelligence indicates the "observability platform market" was valued at approximately $2.9 billion in 2025, projected to grow at a Compound Annual Growth Rate (CAGR) of 15.9% to reach $6.1 billion by 2030. Other analyses, like Market Research Future, project the "Full-Stack Observability Services Market" to be $8.56 billion in 2025 with a higher CAGR of 22.37% through 2034, highlighting varying market definitions. Datadog operates within a competitive landscape, facing rivals such as Elastic and cloud giants like Amazon and Microsoft, alongside Cisco, which completed its acquisition of Splunk on March 18, 2024.
The S&P committee's decision to include Datadog, despite other companies like AppLovin boasting a higher market capitalization of $114.65 billion (as of July 2, 2025), underscores a strategic preference for foundational enterprise technology addressing critical infrastructure needs. This move signals an evolving S&P 500 that increasingly reflects software-defined infrastructure management and analytics as a core economic driver, moving beyond traditional hardware or consumer-facing software. While Workday's inclusion was cited as occurring in 2012 in the original document, it was added to the S&P 500 effective December 23, 2024, preceding its significant growth in the enterprise SaaS sector. Datadog's ascension thus serves as a powerful signal of the technological segments achieving critical mass and institutional validation, guiding future investment and strategic planning in the enterprise technology landscape.

SPY/QQQ Plan Your Trade For 7-1 : Post Market UpdateToday was a very powerful day for the Cycle Patterns - particularly for Gold and BTCUSD.
Gold rallied as the Cycle Pattern predicted a RALLY in TREND mode.
BTCUSD collapsed on a CRUSH Cycle Pattern.
The SPY Cycle Pattern predicted a Gap Reversal pattern. We did see the Gap today and a moderate reversal in price. But the SPY, as usual, continued to try to melt upward.
I highlighted a very interesting TWINNING pattern in Bitcoin in this video. Pay attention.
Get some.
#trading #research #investing #tradingalgos #tradingsignals #cycles #fibonacci #elliotwave #modelingsystems #stocks #bitcoin #btcusd #cryptos #spy #gold #nq #investing #trading #spytrading #spymarket #tradingmarket #stockmarket #silver
