S&P 500 (SPX500)

S&P 500 Daily Chart Analysis For Week of June 13, 2025Technical Analysis and Outlook:
The S&P 500 Index has displayed both upward and downward movements throughout this week's trading session, narrowly missing the targeted Outer Index Rally level of 6073. Currently, the index is characterized by a bearish trend, warranting attention towards the Mean Support level of 5940, with additional critical support identified at 5888.
Conversely, there exists a significant potential that, upon reaching the Mean Support of 5940, the index may recover and rise to the Mean Resistance level of 6046. This upward movement could facilitate an interim rally, culminating in the completion of the Outer Index Rally at 6073 and enabling the index to address the Key Resistance level positioned at 6150.

SPY (S&P500) - Price Testing Support Trendline - Daily ChartSPY (S&P500 ETF) price has just closed below $600 and is currently under a support trendline.
If price cannot breakout above the $600 and $605 resistance level this month, a pullback could occur down to the support zone.
SPY price could potentially pullback to various levels of support due to:
-USA domestic conflict
-International military conflicts
-Technical chart bearish divergence
-USA federal reserve interest rate news
-Government and corporate news
Support Levels: $595, $590, $585, $580.
Resistance Levels: $600, $605, $610, $615.
The 50EMA/200EMA Golden Cross is still on-going, and support prices of $580 and $568 have yet to be tested significantly.

SPY/QQQ Plan Your Trade For 6-13 : Harami-Inside PatternToday's pattern suggests the markets may stall into a sideways price range.
After the news of Israel targeting Iran in a preemptive strike late yesterday afternoon, the markets moved dramatically lower while Gold & Silver moved higher on the news.
I, personally, see this market trend as a shift in thinking ahead of a long Father's Day weekend.
I see traders trying to position their accounts/trades for uncertainty.
I believe we could see a bit of a shift today - particularly in Metals and the QQQ/NASDAQ/BTCUSD.
Overall, I strongly suggest traders prepare for extreme volatility this weekend as any further news of a counter-strike or further military action in the Middle East could roil the markets.
Happy Friday the 13th - everyone.
Going to be an interesting day to say the least.
Get some.
#trading #research #investing #tradingalgos #tradingsignals #cycles #fibonacci #elliotwave #modelingsystems #stocks #bitcoin #btcusd #cryptos #spy #gold #nq #investing #trading #spytrading #spymarket #tradingmarket #stockmarket #silver

SPX500 | Bearish Below 6010 Amid Rising Geopolitical TensionsSPX500 | OVERVIEW
The index remains under bearish pressure due to escalating geopolitical tensions, particularly the ongoing conflict.
As long as these conditions persist, the market is likely to maintain a downward bias.
Technical Outlook:
As long as the price trades below the 5990–6010 pivot zone, the bearish trend is expected to continue toward 5938.
A confirmed stability below 5938 may lead to further downside toward 5902 and 5858.
A bullish reversal is only likely if hostilities cease or negotiations begin between the conflicting parties.
Pivot Zone: 5990 – 6010
Support Lines: 5938, 5902, 5858
Resistance Lines: 6041, 6098, 6143
previous idea:

S&P 500 Breaks UptrendS&P 500 Breaks Uptrend
Only yesterday we questioned the sustainability of the stock market’s upward trend amid alarming news from the Middle East and the evacuation of the US embassy in Iraq — and today, the S&P 500 chart (US SPX 500 mini on FXOpen) shows a break below the lower boundary of the ascending trend channel.
According to media reports:
→ Steve Witkoff, US President Donald Trump’s special envoy to the Middle East, was expected to meet Iran’s Foreign Minister in Oman on Sunday.
→ Friday the 13th became the date when Israel launched strikes on Iran’s nuclear facilities, dramatically altering the outlook for a potential US-Iran nuclear agreement.
→ Secretary of State Marco Rubio stated that the US was not involved in the operation, while Israel’s state broadcaster reported that Washington had been informed ahead of the strikes.
Technical Analysis of the S&P 500 Chart
Yesterday morning, we noted that the Q-line, which divides the lower half of the channel into two quarters, had shifted from acting as support to becoming resistance. This was confirmed during the US trading session (as indicated by the arrow).
Selling pressure intensified, and the psychologically important 6,000 level — which showed signs of support earlier in June — now appears to be acting as resistance. It is in this area that the E-Mini S&P 500 (US SPX 500 mini on FXOpen) broke below the lower boundary of its uptrend channel.
In addition to ongoing discussions about potential Fed rate cuts this summer, geopolitical risk assessments are now also in focus. It remains unclear how Washington will respond if Iran retaliates.
Meanwhile, Israel’s Defence Minister has declared a state of emergency, warning of an imminent missile and drone attack — further fuelling fears of a possible escalation.
This article represents the opinion of the Companies operating under the FXOpen brand only. It is not to be construed as an offer, solicitation, or recommendation with respect to products and services provided by the Companies operating under the FXOpen brand, nor is it to be considered financial advice.

Small Stocks vs. GoldThis index represents small caps minus big caps, divided by gold. A good representation of how small companies in USA are doing related to gold (hard asset). You could argue that this is more representing of real economy and it's health.

S&P 500 Breaks Out — Trump, Tariffs & Bullish Island PatternDonald Trump has mentioned the US stock market in every meeting he has held in the past few days, which has caused the US stock market indices , including the S&P500 Index ( SP:SPX ), to rise:
"Better go out and buy stocks now".
President Donald Trump told a crowd in Saudi Arabia on Tuesday that the markets are just getting started. “It’s going to get a lot higher,” he said, right as the S&P 500 posted its first gain since late February.
But one of the main reasons for the increase in the S&P 500 Index and US stocks is The United States has dropped its tariffs on Chinese goods to 30% , down from a brutal 145% , while China is slashing its own duties on US imports to just 10% , temporarily, for the next 90 days .
-------------------------------------------------
Now let's take a look at the S&P 500 Index chart on the daily time frame .
S&P500 Index managed to break the Resistance zone($5,737_$5,506) and 21_SMA(Weekly) by Breakaway Gap .
In terms of Classic Technical Analysis , the S&P500 Index has managed to form a Bullish Long Island Pattern , and this pattern is one of the continuing patterns and will be a sign of the continuation of the S&P500 Index's upward trend .
In terms of Elliott Wave theory , it seems that the S&P500 index has completed the corrective wave and is in new impulsive waves , which could cause a new All-Time High(ATH) to form.
I expect the S&P500 index to increase by at least +5% as it approaches the Uptrend line , and we will see the possibility of a new ATH .
Please respect each other's ideas and express them politely if you agree or disagree.
S&P 500 Index Analyze (SPX500USD), Daily time frame.
Be sure to follow the updated ideas.
Do not forget to put a Stop loss for your positions (For every position you want to open).
Please follow your strategy and updates; this is just my Idea, and I will gladly see your ideas in this post.
Please do not forget the ✅' like '✅ button 🙏😊 & Share it with your friends; thanks, and Trade safe.

SPY/QQQ Plan Your Trade For 6-12: BaseRally In Trend ModeToday's pattern suggests the markets may attempt to identify a base and move higher (rally) off that base level.
Given the overnight price activity, I suggest the process of identifying the base level could prompt a deeper early decline in price - possibly attempting to retest 595-597 lows before finding support and attempting to rally.
As I've been warning over the past few weeks/months, I'm still seeing the Excess Phase Peak pattern playing out as a Flag Termination - rolling into a downtrend and attempting to move back towards the $480 lows as a real possibility. I've been warning and watching for the breakdown in trend - but we've not seen it yet.
Thus, we are still BULLISH until we get a confirmation of a solid breakdown. That would be a move below the 580-585 level at this point. We need to see some type of solid breakdown in price, breaking away from the FLAG setup and moving downward, before I could confidently suggest the Flag Breakdown has happened.
Gold and Silver are making a big move higher. Gold is finally starting to move back above $3400 and I believe watching Silver, Gold, & Platinum rally suggests FEAR is elevating as we move into the end of June.
I still believe Gold has a chance to rally above $4k before the end of June. We'll see if it happens.
BTCUSD is moving into a DUAL-EPP pattern. This is very interesting. Watch the video as I highlight why this could prompt a dual-stage EPP breakdown in Bitcoin over the next 20 to 50+ days.
Get some.
#trading #research #investing #tradingalgos #tradingsignals #cycles #fibonacci #elliotwave #modelingsystems #stocks #bitcoin #btcusd #cryptos #spy #gold #nq #investing #trading #spytrading #spymarket #tradingmarket #stockmarket #silver

S&P500 INTRADAY consolidation range Boeing Crash: An Air India Boeing 787 crashed after takeoff from Ahmedabad to London, killing all 242 on board. It’s the worst accident involving this model. Boeing shares dropped on renewed safety concerns.
Trump Tariffs: Donald Trump plans to set new tariff rates within 1–2 weeks before a July 9 deadline. The EU may be last to get a trade deal. Japan is cautious about any agreement.
US-UK Trade Deal: The US and UK plan to move quickly on a trade deal. The EU is expected to face delays.
Tariff Pause: The US may extend a 90-day pause on tariffs for countries negotiating seriously.
Middle East Tensions: The US is pulling embassy staff as tensions rise. Iran warned of retaliation if nuclear talks fail. Reports say the US is preparing for a possible Israeli strike on Iran. Oil prices eased.
Key Support and Resistance Levels
Resistance Level 1: 6060
Resistance Level 2: 6120
Resistance Level 3: 6172
Support Level 1: 5960
Support Level 2: 5900
Support Level 3: 5800
This communication is for informational purposes only and should not be viewed as any form of recommendation as to a particular course of action or as investment advice. It is not intended as an offer or solicitation for the purchase or sale of any financial instrument or as an official confirmation of any transaction. Opinions, estimates and assumptions expressed herein are made as of the date of this communication and are subject to change without notice. This communication has been prepared based upon information, including market prices, data and other information, believed to be reliable; however, Trade Nation does not warrant its completeness or accuracy. All market prices and market data contained in or attached to this communication are indicative and subject to change without notice.

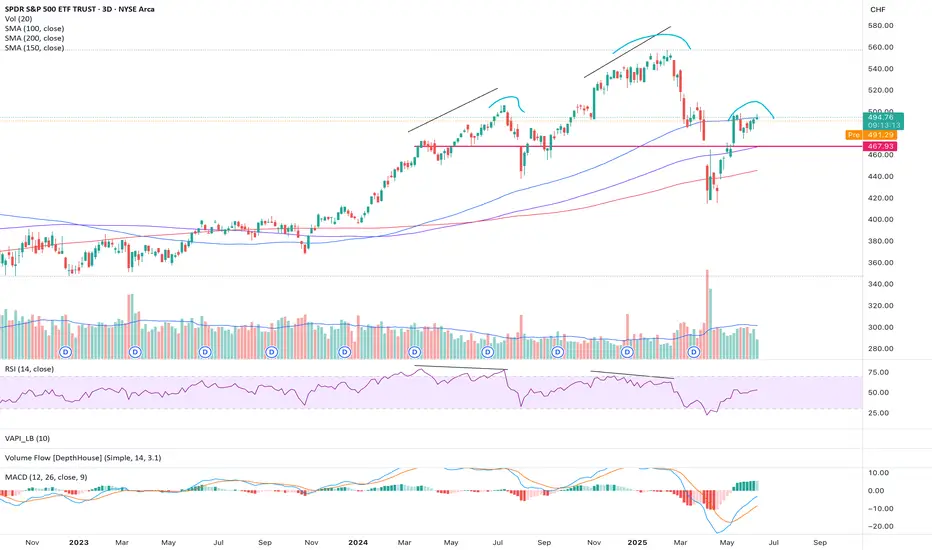
SP500 in CHF terms, bearish outlook- checking the SP500 in USD seems misleading these days
- therefore I checked it with CHF and earlier movements made more sense
- RSI bearish divergences were followed in earlier periods
- now we have a potential head and shoulders formation
- seems more likely to head south
S&P 500 Maintains Uptrend — But for How Long?S&P 500 Maintains Uptrend — But for How Long?
As the chart of the S&P 500 (US SPX 500 mini on FXOpen) shows, price movements in June continue to form an upward trend (highlighted in blue).
The bullish momentum is being supported by:
→ News of a potential trade agreement between the United States and China;
→ The latest inflation report. Data released yesterday showed that the Consumer Price Index (CPI) slowed from 0.2% to 0.1% month-on-month.
President Donald Trump described the inflation figures as “excellent” and said that the Federal Reserve should cut interest rates by a full percentage point. In his view, this would stimulate the economy — and serve as another bullish driver.
However, as illustrated by the red arrow, the index pulled back yesterday from its highest level in three and a half months, falling towards the lower boundary of the channel. This decline was triggered by concerning developments in the Middle East. According to media reports, the US is preparing a partial evacuation of its embassy in Iraq, following statements by a senior Iranian official that Tehran may strike US bases in the region if nuclear talks with Washington fail.
Technical Analysis of the S&P 500 Chart
Currently, the price remains near the lower boundary of the ascending channel, reinforced by the psychologically significant 6,000-point level.
However, note that line Q — which divides the lower half of the channel into two quarters — has flipped from support to resistance (as indicated by black arrows). This suggests increasing bearish pressure, and there is a possibility that sellers may soon attempt to push the price below the channel support.
Be prepared for potential spikes in volatility on the E-Mini S&P 500 (US SPX 500 mini on FXOpen) chart as markets await the release of the Producer Price Index (PPI) at 15:30 GMT+3 today.
This article represents the opinion of the Companies operating under the FXOpen brand only. It is not to be construed as an offer, solicitation, or recommendation with respect to products and services provided by the Companies operating under the FXOpen brand, nor is it to be considered financial advice.

SPX'S BULLS !6200 Will get touched easily soon !
because the much vol up there waiting to be hunted at 6100+
𓄀𝓈𝓉𝒶𝓎 𝓉𝓊𝓃ℯ𝒹 𓃓

S&P500: Within reachThe S&P 500 has edged past the 88.70% retracement and is now trading within our magenta Target Zone (Coordinates: 5,880 points to 6,166 points). This places magenta wave (B) likely near its peak - a move that could soon give way to a sharper decline as part of the anticipated wave (C). At current levels, the setup remains favorable for initiating short positions. To manage risks, a stop just 1% above the upper boundary of the Target Zone is recommended. If the index breaks above resistance at 6,6675 points, however, we would shift to an alternative interpretation: a bullish continuation in the form of the wave alt.(III) in blaue. We currently assign a 40% probability to this scenario. One final note: the minimum technical requirement for wave (B) has already been fulfilled by the entry into the Target Zone. This means wave (C) could begin any time.
Over 190 precises analyses, clear entry points and defined Target Zones - that's what we do.

SPY/QQQ Plan Your Trade For 6-11: Bottom-Base Rally Counter TrndToday's counter-trend Bottom-Base Rally pattern suggests the markets may attempt to find a peak and roll over into a downtrend.
The normal Bottom-Base Rally pattern is similar to the start of a moderate price base/bottom, then moving into a moderate rally phase.
In counter-trend mode this pattern would be inverted - forming a Top and then moving into a downward price trend.
I've been warning of the potential of a rollover top type of pattern in the SPY over the past few weeks - but it never really setup/confirmed.
I'll be curious to see if this counter-trend pattern, today, sets up some type of big top formation in the SPY/QQQ. It might be related to news as well.
Gold and Silver have a Gap-Stall-Revert-FLUSH pattern. This is always an interesting pattern because is suggests price is going to attempt to either gap and trend or stall and revert. My guess is we are looking at more trending in metals today.
Platinum is RIPPING higher (PL1!). Because of this, I believe Silver and Gold will attempt to follow Platinum and move to the upside today.
BTCUSD is stalling a bit. We'll see if we get any big price move in Bitcoin today. After the big rally over the past few days, it will be interesting to see if BTCUSD reverts downward or continues higher.
Overall, today's patterns suggest the markets are seeking direction. Get ready for an exciting day in the markets.
Get some.
#trading #research #investing #tradingalgos #tradingsignals #cycles #fibonacci #elliotwave #modelingsystems #stocks #bitcoin #btcusd #cryptos #spy #gold #nq #investing #trading #spytrading #spymarket #tradingmarket #stockmarket #silver

Prepare For A Stock Market Crash
S&P 500 E-mini Futures, Daily Chart.
Potential Ending Diagonal.
Nothing serious. Just a Stop-hunt. But Fast & Furious...
......................................................................................................................
We are not registered or licensed in any jurisdiction whatsoever to provide investing advice or anything of an advisory or consultancy nature.
and are therefore are unqualified to give investment recommendations.
Always do your own research and consult with a licensed investment professional before investing.
This communication is never to be used as the basis of making investment decisions, and it is for entertainment purposes only.

SPY/QQQ Plan Your Trade For 6-10 : POP PatternToday's POP pattern suggests a potential big price move will take place. Given the overnight activity on the ES (rallying higher then rolling over), I suggest today's price move may attempt to retest these overnight highs, then repeat the breakdown phase into the close.
The markets continue to try to melt upward. This trend will continue until the markets decide to break downward.
After the deep low created by the tariff news, the markets continue to try to rally to new highs. It is very likely that Q2 earnings data may push the SPY to new ATH levels before we see any big rotation in price.
The markets have a tendency to move just above recent highs, then stall and revert downward as a pullback. This move may be no different.
The continued stalling of price trying to move higher recently suggests the markets are running into moderate resistance and I believe traders are actively pulling capital away from this rally.
The trend is still BULLISH. Stay cautious of this upward move as a breakdown could happen at any time.
Gold and Silver are moving into an impressive rally phase. Silver and Platinum have moved considerably higher over the past 10+ days. I believe Gold is lagging and will make a big move higher over the next 5 to 10+ days.
Silver is targeting $41-44+. Gold should target $3400 to $3500+ near the same time.
Bitcoin made a huge rally yesterday - reaching my 110,500 upper resistance level. Now, we see if Bitcoin has the momentum to carry higher or if it will fail and rollover into a downtrend.
It seems we are right as a MAKE or BREAK level in the markets. I'm still a believer of MELT UP until it fails.
I continue to watch for technical failure - but I've not seen it happen yet.
Get some.
#trading #research #investing #tradingalgos #tradingsignals #cycles #fibonacci #elliotwave #modelingsystems #stocks #bitcoin #btcusd #cryptos #spy #gold #nq #investing #trading #spytrading #spymarket #tradingmarket #stockmarket #silver

S&P500 INTRADAY uptrend continuation supported at 5960Key Support and Resistance Levels
Resistance Level 1: 6120
Resistance Level 2: 6170
Resistance Level 3: 6220
Support Level 1: 5960
Support Level 2: 5900
Support Level 3: 5800
This communication is for informational purposes only and should not be viewed as any form of recommendation as to a particular course of action or as investment advice. It is not intended as an offer or solicitation for the purchase or sale of any financial instrument or as an official confirmation of any transaction. Opinions, estimates and assumptions expressed herein are made as of the date of this communication and are subject to change without notice. This communication has been prepared based upon information, including market prices, data and other information, believed to be reliable; however, Trade Nation does not warrant its completeness or accuracy. All market prices and market data contained in or attached to this communication are indicative and subject to change without notice.

A Potentially Dangerous Pattern Takes ShapeWhile the futures market has yet to break into new all-time high territory, the previously discussed bearish micro setup has now been invalidated. In its place, we’re witnessing a complex, overlapping advance—creeping steadily toward the prior highs in the S&P 500 (ES).
At the micro level, I currently see no compelling bearish setup. However, this grinding upward move—lacking strong conviction from either buyers or sellers—is not necessarily bullish. In fact, it’s a hallmark of a potentially dangerous pattern: a primary degree ending diagonal.
If my interpretation is correct, both the “orange” and “purple” wave counts point to the same ominous conclusion. They suggest that what we're seeing could culminate in a sharp, possibly violent reversal—one that would ultimately retrace back to where this entire primary wave began. For reference, that’s just above 4,000, marked by the conclusion of Primary Wave 4 in October 2022.
This is the moment for caution—not after the damage is done.
Yes, we may push into new all-time highs. But within this fragile and overlapping structure, that outcome is far from guaranteed. Even if we get there, the looming question remains:
At what cost?

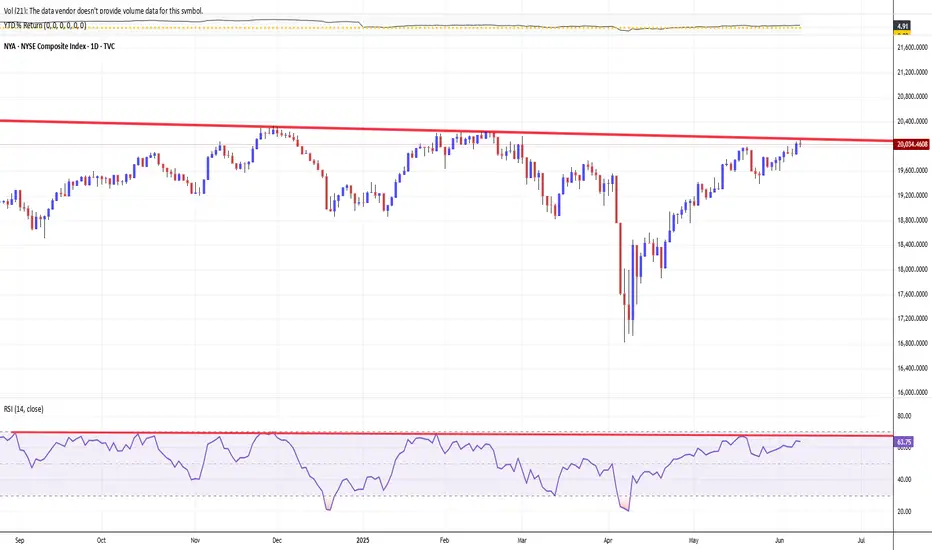
NYSE COMPOSITE INDEX. BACK TO 20 000 MARK — KEY RESISTANCE LINEThe NYSE Composite TVC:NYA is a stock market index, that covering all common stock listed on the New York Stock Exchange, including American depositary receipts, real estate investment trusts, tracking stocks, and foreign listings.
Over 2,000 stocks are covered in the index, of which over 1,600 are from United States corporations and over 360 are foreign listings.
However foreign companies are very prevalent among the largest companies in the index: of the 100 companies in the index having the largest market capitalization (and thus the largest impact on the index), more than half (55) are non-U.S. issues.
Thanks to many non-U.S. components, NYSE Composite index shows nearly 5 per cent return in 2025 so far, outperforms major U.S. stock indices like Dow Jones Industrial (+0.24%), S&P500 (+1.91%), as well as Nasdaq-100 (+3.21%).
Trade negotiations and tariff expectations have been central drivers of the NYSE Composite Index's recent recovery, shaping both market sentiment and underlying corporate fundamentals.
Trade Negotiations. Market Sensitivity and Relief Rallies
Financial markets, including the NYSE Composite, have reacted sharply to developments in trade negotiations. Historically, when trade talks break down or new tariffs are announced, U.S. stocks tend to sell off due to concerns over higher costs, supply chain disruptions, and reduced global demand. Conversely, when negotiations resume or tariffs are delayed, markets often rebound. For example, during the 2018–2019 U.S.–China trade war, U.S. stocks experienced heightened volatility, but rallied strongly after the announcement of the Phase I trade deal, as uncertainty eased and the threat of further escalation diminished. This pattern has repeated in 2025: the NYSE Composite has staged recoveries following signs of progress in trade talks or delays in tariff implementation, as investors anticipate less disruption to global commerce and corporate earnings.
Tariff Expectations. Impact on Earnings, Valuations, and Sentiment
Tariffs directly affect corporate earnings by raising input costs for companies that rely on imported goods. According to Goldman Sachs Research, every five-percentage-point increase in the U.S. tariff rate is estimated to reduce S&P 500 earnings per share by roughly 1-2%. If companies absorb these costs, profit margins are squeezed; if they pass them on to consumers, sales may decline. The NYSE Composite, which tracks a broad swath of U.S. and international companies, is similarly exposed.
Expectations around tariffs also influence equity valuations.
Elevated policy uncertainty—driven by unpredictable tariff announcements—raises the risk premium investors demand, often compressing price-to-earnings multiples and weighing on stock prices. When clarity emerges, such as the announcement of a tariff pause or the prospect of a negotiated settlement, uncertainty recedes, and valuations can recover, fueling index gains.
The Role of Policy Announcements and Market Psychology.
Trade policy announcements have acted as economic shocks, affecting global trade relationships and growth forecasts. For instance, after the U.S. announced new tariffs in early 2025, recession odds rose and GDP growth forecasts were slashed, prompting a broad market sell-off. However, the subsequent announcement of a 90-day tariff pause and renewed negotiations led to a stabilization and partial recovery in equities, as investors reassessed the likelihood of a severe downturn.
Market psychology amplifies these moves.
As trade rhetoric intensifies, investor sentiment can become excessively pessimistic, sometimes overshooting the actual economic impact of tariffs. This creates conditions for relief rallies when negotiations show progress or when the tariff outlook becomes less severe than feared.
Technical challenge
NYSE Composite index has experiencied record values on Friday, November 29, 2024, following so-called Trump-a-Rally.
The best Closing high was 20,272.04 ponts at those day and the best Intraday high was 20,332.50 points, also at the same day.
However unability to finish the year 2024 firmly above 20 000 round number, sharply pushed stock market bulls into fart and double-digit decline earlier in 2025.
The main chart indicates on major resistance again, near 20 000 point while technical indicator RSI (14) still goes sluggish.
Conclusion
The NYSE Composite Index's recovery has been closely tied to the ebb and flow of trade negotiations and tariff expectations. Positive developments in negotiations and reduced tariff threats have alleviated uncertainty, supported earnings expectations, and improved investor sentiment, all of which have contributed to the index's rebound.
--
Best wishes,
@PandorraResearch Team 😎
SPX6900 - Time to Get Aggressive and Flip SPX🔥 CRYPTO:SPX6USD With a new ATH on the horizon, wave (3) is eyeing $2.4 - $3.1 as the next target. But this is just the start, momentum is building and summer volatility could push prices even higher!

SPX 500 to 17,000 in 7 years.This chart represents the S&P 500, showcasing its performance over time, including quarterly data.
It captures everything.
Every recession.
Every war.
Every president.
Every variation of the monetary base as superpowers rise and fall.
Whenever I hear a bear in the stock market declare that THE TOP has been reached, and we are about to CRASH -50% to -90%
I find myself drawn to these comprehensive long term charts.
If the bulls are genuinely in control and we have merely undergone an intermediate-term correction, then the long-term bull market that commenced at the 2009 low remains robust, with many more years ahead.
The chart also illustrates that the three significant bull market phases typically last around 18-20 years following a major breakout.
And they yield a comparable number of X's.
It's all quite fascinating, if you ask me.
See you in the future!

SPY/QQQ Plan Your Trade For 6-9: Inside BreakawayToday's pattern suggests the SPY/QQQ will attempt to make a breakaway type of price move - away from Friday's open-close range.
Given the fairly tight opening price level this morning, I would stay cautious in early trading today and try to let the first 60 minutes play out - looking for that breakaway trend/momentum.
Overall, the markets are still in a Bullish price phase - trying to push higher.
But, as I continue to warn, I believe the markets could rollover and break downward at any time.
BTCUSD moved substantially higher overnight. This could be the beginning of a bigger advance higher. But, it could also be an exhaustion move higher.
Gold and Silver are still melting upward. This move in metals recently certainly shows the markets are still fearful of any potential downside price activity.
Again, I urge traders to stay cautious as we continue to struggle within the sideways price range.
Price will show us what it wants to do and I believe this move higher in BTCUSD could be a false type of breakout move to the upside.
Get some.
#trading #research #investing #tradingalgos #tradingsignals #cycles #fibonacci #elliotwave #modelingsystems #stocks #bitcoin #btcusd #cryptos #spy #gold #nq #investing #trading #spytrading #spymarket #tradingmarket #stockmarket #silver
