SPX500 with potential Peek-Sell!Hey tradomaniacs,
SPX500 has tested the current upper trendline and could continue its way down as recent attempt to break has got rejected with a fakeout.
As always I`m very cautious here due to the current volatility and uncertainy of the market.
Generally we can assume that rising rates are putting stocks under pressure which is why I`m currently staying on the bearish side.
A breakout could of course cause another correction to the upside, but as long as this level holds we have a potential peek-sell here in case of another rally sell-off.
What do you think?
Spx500analysis

Spx500 Short SignalWe have almost every timeframe in sync to the downside. I feel like we will push up into here then sell off very hard and continue down into the 4100 level. Goodluck!

Spx500 Short SignalGoing short on Spx as it’s extremely bearish on almost every timeframe. Going for a 3R trade. Goodluck and have proper risk management if you take this as well!

SPX500 likely to MOVE UP!Hey tradomaniacs,
previous sell-offs due to the fact that the market realizes FED is not kidding with rate-hikes were pretty strong, but will probably correct soon as the sentiment is too bearish and has oversold the indicies such as SPX500 and NASDAQ100.
We will probably see a move up to attract more buyers in order to get more liquidity for the sellers.
So far the day has been a mess, buit the previous breakout did not cause another rally which is a strong indication for a reversal due to exthaustion by sellers at the bottom of the day.
Liquidity turned out to be pretty bullish as we head into the after-lunch-session and I could imagine to see a strong breakout here to the upside (short squeeze).
Let`s see what happens =)

SPX500Decision time soon, are we in a 1,2 1,2 EW wave pattern that is bullish leading to 5,130-5,200 wave 3 target?
Or do we loose critical support now and start the bear market, nuke to 3,200.
I discuss in my analysis why I'm leaning towards option 1 where we hit W3 soon to 5130.
Whats your opinion? Comment below.. Thanks and BigMike loves you.

S&P 500 4 HOURSThe post complements the previous chest of stock SP500
*********
My diagnosis last month was still valid
**********
I hope not as I see it, but there is a possibility of falling to 4150
**********
TANKS

Spx500 Short SignalPrice is showing signs of shifting down. Took this short looking to gain 3R risking 10 points targeting 30. I expect price to take out yesterday’s low atleast but we shall see.
I am not a financial advisor so trade at your own risk and always follow your risk management plan!

S&P 500 See, according to the existing page, our external harmonic bat pattern enters the fall from 4632 to 3875
*******
Fibonacci says we may have a 50% return, maybe up to 38 Fibonacci and sometimes 23 Fionachi will go back.
*******
We now see 4 strong downward contexts
******
But this 200 pp rise does not mean that stocks are rising
*******
With this situation, the news that indicates inflation in the world and traders are going all the way to gold.
********
I hope you are not fooled by HFT institutions in transactions
***********
We are the market fuel, so let 4500 be completed and the market trend be determined

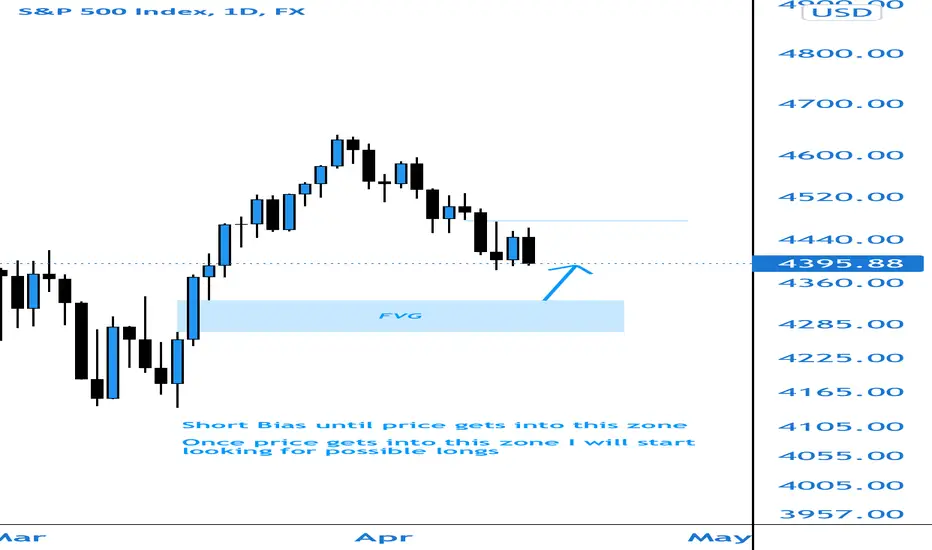
Spx500 Weekly OutlookShould start this week with 2 or 3 bearish days until we get into the FVG. From here we can look to take longs as a reaction from it being filled. Not sure if it will switch bullish but should get a good push up from there at the very least.
Goodluck this week and feel free to leave your opinion below!
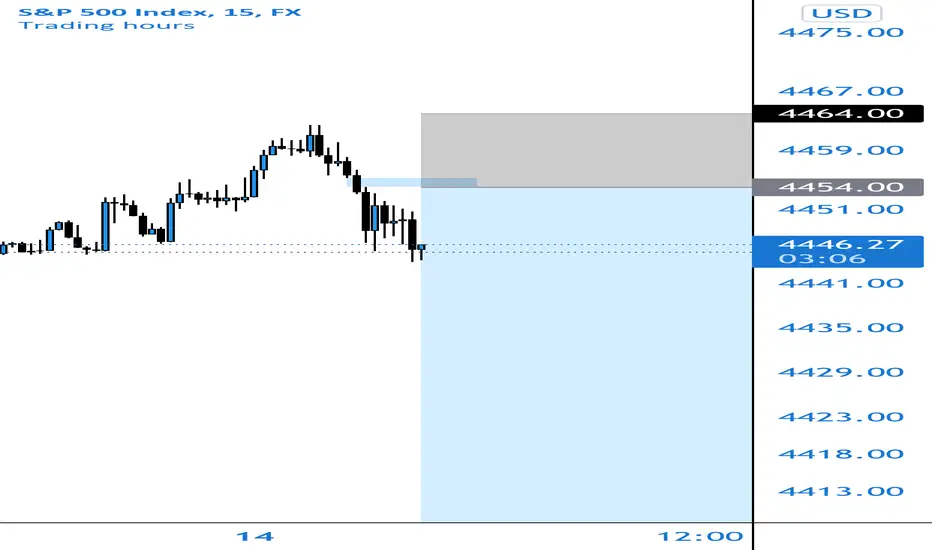
Spx500 Short SignalJust set a sell limit right here on spx500. Had a nice bullish run but didn’t break the high or low. Also the weekly will likely still close bearish so I expect price to take out those lows. Have a nice 15m shift leaving some imbalance to fill and have my stop above the swing High. Use proper risk management and fingers crossed we get triggered in after this nice bearish 4h closes!
SPX500 lilely to FALL!Hey tradomaniacs,
previous breakout-zone got re-tested and market-depth is showing baosrption in form of iceberg-orders. Very strong aggressive buyers are getting absorbed by sell-limit-orders which are getting reloaded over and over again.
So far a good sign for a continuation to the downside as big players seem to distribute volume.
Also technically a great chance to go short!
What do you think?

SXP500 Index: It flies like a brick!Today we are here to talk about the SXP500 index.
Today: The index is trading at 4588. We saw a sideways trade in the last trading session. Which was expected, here is a link to the idea.
What's on the market now:
The market is in a phase of uncertainty and many players are looking for the beginning of a new trend, but there is no clarity. The market is accumulating energy for a sharp exit. Our main task for today is to continue protecting positions from 4450. And wait for the market to move towards the target zone of 4550.
What are we waiting for today:
We are waiting for a market reversal attempt to move towards the 4550 level. However, if the reversal attempt fails, then the market will go to 4330 and open new levels for buying from 4330.
What I recommend:
If you want to open short:
You can open a short position above 45 50 (limiting risks) speculative exit.
If you want to buy:
It is better to refuse from purchases, a sharp price movement to the 44 00 zone is possible
Please don't forget to like. This greatly motivates me to share my trading ideas and market knowledge.
Also take a look at my profile where you will find the full history of trading every day on the SPX 500. Contact me in 1 or 2 days for further trading advice.
I hope these tips were helpful to you, let me know in the comments below. don't forget to subscribe to my channel.
I post SPX 500 analytics every day, so check back tomorrow!
See you next time,
Bye!

SPX S&P500 inverse Head and Shoulders patternSPX S&P500 is looking bearish for now.
I think we might see an inverse head and shoulder chart pattern before closing higher this year.
Looking forward to read your opinion about it.

SPX500 about to fall more!Hey tradomaniacs,
SPX500 just formed a fakeout above the resistance-zone aswell as the Trendline of the current downtrend:
It is very likely to see more downmomentum (probably a bear-rally) as liquidity got grabbed after the break of the trendline.
What do you think?

S&P500 Short SignalJust set my sell limit. Price has made a new swing low and will likely pullback into the 15m order block and make a lower swing high in comparison to the previous one. We then enter there and target a newer swing low. Goodluck and have proper risk management!

SPX W-Shaped RecoveryI think we might see the end of the war soon.
Russia says the first phase of its “military operation” in Ukraine is mostly complete.
I am considering a W-Shaped Recovery on SPX and a price target of $4710.
Looking forward to read your opinion about it.

SPX500 likely to fall!Hey tradomaniacs,
the recent fakeout above the key-resistance is a strong indication of a falling market.
Previous fractal has shown two fakeouts and liquidity-grabbing into both directions showing trapped volume in that zone.
This can cause big players to cause fakemomentum to attract more buyers in order to absorb liquidity.
A potential S/H/S-Pattern would be another confirmation for my assumption.
Let`s see what happens!

GBPJPY Entries + ExitsThe 1on1 video is currently out, if you would like it in order to understand how to play my analysis FULLY, please let me know privately.
All likes/comments and feedback are very much appreciated!
How to play my chart:
Buy at support, sell at resistance. When you open this chart you'll see a green entry and a red entry. When the candlestick hits the green entry, you place a buy. If however that support buy doesn't go into profit and goes negative -35 or -60 pips (depending if it was a fast break/or if the break landed on a minute 15 zone), if it breaks you would then exit your buy and immediately enter the sell. You would then ride that sell down to green TP1, or you could then repeat and play the buy/break there.
The same exact thing goes for resistance sell/break plays!

Something That Bothers Me - SPX On the Weekly chart it can be seen that the wedge pattern is respected with three down waves
The same pattern arose on the Monthly timeframe, yet a third wave is absent, and bullish continuation was the result
Thoughts?


SP500 WeeklyLooking at the SP500 Weekly chart, we have so far retraced about 11% from the top, and it doesn't seem to be the bottom. The market appears to be going for another test of the 4200-4250 area. If the support breaks, we could reach the 4000-3900 zone.
If we try to simulate Covid not happening, consider that the market has seen a higher growth before Covid, take into account all other factors (FED, inflation, current tensions) and try to simulate longer-term behavior, it also brings us towards the 3900-4000 area.
The area of 3900-4000 seems to be where Weekly EMA200 would be touched, which SP500 likes to test. On top of that, the correction of SP500 would be close to 20%, which doesn't sound unreasonable.
If SP500 weekly support at 4200-4250 breaks, it could take up until late May for the market to find the bottom and reverse the trend.
Better safe than sorry.

SPX500 about to fall! Good FX-Trades incoming!Hey Tradomaniacs,
Here two key-notes that shows a divergence of the ECB and FED:
1️⃣ Very hawkish FED
"The market now sees a strong chance of the Federal Reserve starting its monetary policy tightening with a 50 basis point hike in March, especially after St. Louis Fed President James Bullard stated that he has become "dramatically" more hawkish. He added that he now wants a full percentage point of interest rate hikes over the next three U.S. central bank policy meetings."
2️⃣ Very cautious ECB
"European Central Bank President Christine Lagarde warned on Thursday that tightening monetary policy too quickly could harm the eurozone’s economic recovery, warning that the Eurozone can’t be compared to other major regions."
Read the article 👉 www.investing.com
Just in this post we can see clearly find nice opportunities as the euro is likely to fall while the Us-Dollar should continue its rally from yesterday.
Look at SPX500 and the fakeout 👉
You remember this chart? The rumors by JP Morgan have caused a rally.
One concern I have is that short-term-yields are currently stronger than long-term-yields. As long as these moves are not too extended we won`t see inverted yield-curves but as soon as that happens the markt could expect the FED to overthink its current plans as an inverted yield-curve is a sign for a recession. (I`ve explained why and how thats a problem for banks)
However, we finally might get good moves after this choppy week since we have seen the important inflation-data. 👌

ES megaphone at play?Will we find a low at 4330/4350 range or are we heading lower to 4225/4250? Time will tell.
