SPX500 SELL IDEAHey tradomaniacs,
welcome to another free trading-setup. After a successfull LONG I`m planning to short this baby for a pullback or to follow the current trend!
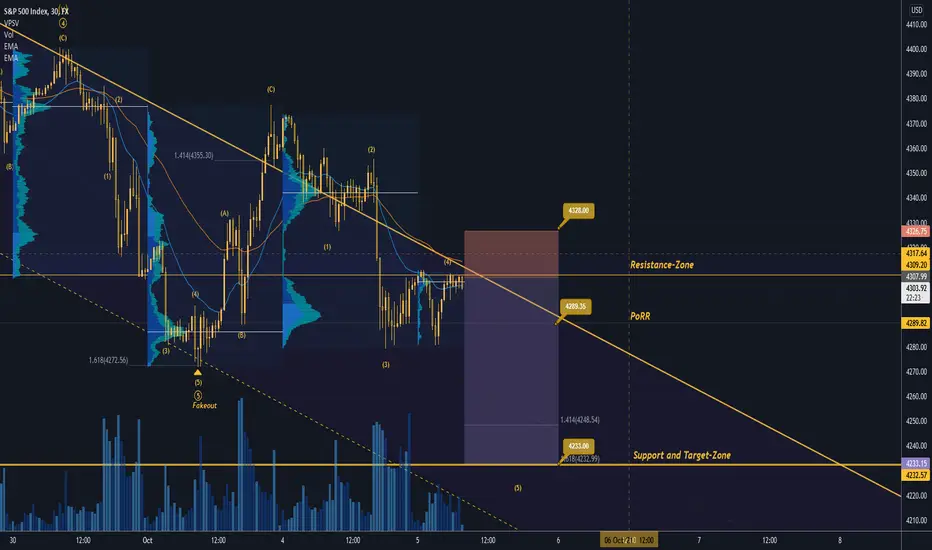
SPX500: Daytrade-Preparation
Market-Sell: 4308.28
Stop-Loss: 4328.00
Point of Risk-Reduction: 4289.35
Take-Profit: 4233.00
Stop-Loss: 190 pips (19 points)
Risk: 0,5% -1%
Risk-Reward: 4,0
LEAVE A LIKE AND A COMMENT - I appreciate every support! =)
Peace and good trades
Irasor
Wanna see more? Don`t forget to follow me
Spx500analysis
PERSPECTIVEI love this pair so much! Neutral until she makes a move. Instructions on screen. feedback welcome

S&P 500 update after the Evergrande crisisHello everyone, as we all know the market action discounts everything :)
_________________________________Make sure to Like and Follow if you like the idea_________________________________
China Evergrande Group has missed a second bond coupon payment in as many weeks, renewing concerns over its ability to repay over $300 billion in liabilities.
This Showed an instant effect on the market, the S&P 500 by dropping almost 2% today it went from 4377.41 to 4301.01 and because Evergrand seems to be heading into default and the grace period of 30 days has started, This could be the start of a big market crash that is similar to the Lehman brothers crises that caused the 2008 crash.
Possible Scenarios for the market :
Scenario 1 :
The markets seem to be heading in a Bearish way that will cause a further drop in the market and the first stop will be the support level located at 4248.77 and from there the market will have a chance to stabilize but for that to happen the Bulls need to step in and gain control over the market in hope to prevent a further drop.
If the Bulls were able to gain control then we will see a bounce of that support level that will lead the price back near the 4347.83 level.
Scenario 2 :
After the market reaches the first support at 4248.77, The bears most likely will not allow the Bulls to gain any control which will lead to a breakout of that level that will lead into a further drop possible leading into the 4191.93 levels which could be an early warning signs for a crash in the Economic world.
Technical indicators show :
1) the market is below the 5 10 20 50 100 MA and EMA indicating a Bearish short/mid trend, and still above the 200 MA and EMA that indicates a Bullish Long-trend.
2) The RSI is at 34.17 showing weakness in the market with a strong chance that the indicator will go into the overbought zone.
3) The ADX is at 30.35 showing that the market is trending, with a negative crossover between DI+ (12.33) and DI- (36.94).
Weekly Support & Resistance points :
support Resistance
1) 4352.12 1) 4512.31
2) 4248.77 2) 4569.15
3) 4191.93 3) 4672.50
Fundamental point of view :
Asian equities followed Wall Street sharply lower and bonds rallied on Friday, as risk sentiment soured amid growing worries that inflation may persist even after global growth has peaked.
U.S. stock futures pointed to a 0.60% decline for the S&P 500, following a 1.19% drop in the index overnight that punctuated its worst month since March of last year.
Federal Reserve Chair Jerome Powell said on Wednesday that resolving "tension" between high inflation and high unemployment is the Fed's most urgent issue, acknowledging a potential conflict between the U.S. central bank's two goals of stable prices and full employment.
China has proved another particular worry for investors: the economy took a hit from regulatory curbs in the tech and property sectors and is now grappling with a power shortage that threatens to push up energy prices globally. According to reuters
Concerns over China Evergrande Group have put investors on edge and added to recent worries over economic growth from the Delta variant.
This is my personal opinion done with technical analysis of the market price and research online from Fundamental Analysts and News for The Fundamental point of view, not financial advice.
If you have any questions please ask and have a great day !!
Thank you for reading.

SPX finds floating ground for nowHello everyone, as we all know the market action discounts everything :)
_________________________________Make sure to Like and Follow if you like the idea_________________________________
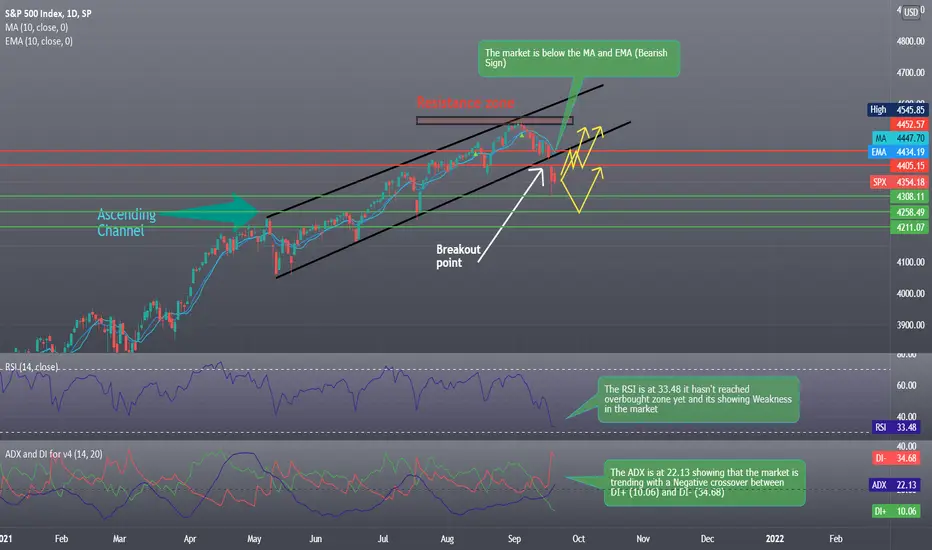
The S&P 500 index traded below its 50-day moving average, its first major breach in more than six months.
The S&P 500 was able to find a floating ground after teetering developer China Evergrande said it would pay some bond interest due on Thursday. Removing fears of a big and messy collapse that had scared investors.
The Index price has dropped 2.6% in the last couple of days but now the market seems to be stabilizing and an increase in value might start bringing the SPX back into the Ascending Channel range.
Possible Scenarios for the market if the China situation was resolved :
Scenario 1 :
If the Bulls were able to gather the force need to gain control then we will see an increase in the market that would reach the 4452.57 resistance level where we might have a small correction that will bring the price near the 4405.15 level before the index goes back into the Ascending Channel range.
Scenario 2 :
After a drop like that it could take a bit of time for the Bulls to go in and push the market up, in that time we will see the price reach the first support level located at 4308.11 where most likely the buyers will go in, but if they failed to support that line then we might see a bigger drop reaching the 4258.49 or even the 4211.07 support before going back up.
Technical analysis show :
1) The market is below the 5 10 20 50 MA and EMA (Bearish Short-Term Trend) But still above the 100 and 200 MA and EMA (Bullish Long-Term Trend)
2) The RSI is at 33.48 it hasn't reached the overbought zone yet and its showing Weakness in the market
3) The ADX is at 22.13 showing that the market is trending with a Negative crossover between DI+ (10.06) and DI- (34.68)
Daily Support & Resistance points :
support Resistance
1) 4308.11 1) 4405.15
2) 4258.49 2) 4452.57
3) 4211.07 3) 4502.19
Weekly Support & Resistance points :
support Resistance
1) 4409.33 1) 4475.22
2) 4385.67 2) 4517.45
3) 4343.44 3) 4541.11
Fundamental point of view :
Bloomberg reports that Hengda Real Estate - the main unit of troubled Chinese property developer Evergrande - will make its Thursday bond coupon payment. This hardly means Evergrande is out of the woods - indeed a restructuring at some point still remains likely - but a disorderly unwind seems off the table at the moment.
Concerns over China Evergrande Group have put investors on edge and added to recent worries over economic growth from the Delta variant.
Persistent default fears overshadowed efforts by Evergrande's chairman to boost confidence in the firm on Tuesday, while Beijing showed no signs it would intervene to stem any effects across the global economy.
Investors are waiting for the end of this week's Fed meeting that may shed light on when its massive purchase of government debt will begin to ease. According to Reuters
This is my personal opinion done with technical analysis of the market price and research online from Fundamental Analysts and News for The Fundamental point of view, not financial advice.
If you have any questions please ask and have a great day !!
Thank you for reading.
SPX500: my multi-time frame analysisHi Traders,
This is my view on this pair for the next days on #SPX500
I remind you that this is only a forecast based on what current data are.
Therefore the following signal will be activated only if specific rules are strictly respected.
If you follow my strategy you will be able to identify the right filters and triggers to enter correctly the market and avoid fake signals.
I really hope you liked this video and I would like to know what do you think about this analysis, so please use the comment section below this video to give me your point of view.
Thank You
———————————
Pit from Trading Kitchen

S&P500 textbook Price action and GAP fillS&P as predicted gave some pre market push up before some strong downward force to fill the gap to perfection and giving a beautiful reaction to the 4450 zone 50% level. Im still bearish for the moment looking at the 4420 zone 70% level but main focus is on the 4400-4375 area with the 79%and88% levels where ill be looking for a structured momentum switch.

SPX Strong Bearish close into major zone. More downside to comeS&P with a very strong push into the 4450 zone 50% level as predicted. The GAP was not filled so Monday early Price action will be important to determine further downside early then a move up or will it retrace up the downward leg then push down to fill the GAP. Only time will tell. DONT assume play the action. Let the market talk to you first...

US Market Technicals Ahead (13 September – 17 September 2021)It is a relatively busy week ahead in the US on the economic data front. This Tuesday’s U.S. inflation numbers could help dictate market direction in the coming week amid concerns that persistent rising inflation could prompt the Fed to roll back emergency stimulus measures. The timing of when central banks choose to scale back economic stimulus has been a key driver of market sentiment amid concerns over rising inflation.
Elsewhere on economic data, US retail sales and industrial production numbers for August are seen pointing to a decline in domestic trade and modest factory activity growth. Numbers will be out on Thursday.
The UK is also due to release what will be closely watched inflation data, along with updates on employment and retail sales. Appearances by European Central Bank officials may shed more light on last week’s decision to scale back bond purchases. Meanwhile, data from China is likely to underline that the pace of the recovery in the world’s number two economy is slowing.
Here’s what you need to know to start your week.
S&P500 (US Market)
The benchmark index $SPX ended the week off its longest daily losing streak since February (-1.58%), posting five straight days of losses. Fears over slowing economic growth and rising inflation have weighed on the market.
$SPX medium term trend channel remains intact, with no violation of its upper and lower bound trendline since the Bullish Reversal supported by its 50DMA highlighted in the earlier weeks. $SPX is now trading below its 20DMA after the failure of its Bullish Pennant consolidation, spiraling down towards its 50DMA that has pivoted the index since November 2020.
The immediate support to watch for $SPX this week is at 4,425 level; a break down of 50DMA along with its short term support level.
U.S. inflation
Tuesday’s data on consumer price inflation will be the highlight of the economic calendar amid an ongoing debate over whether the current spike in inflation is likely to fade as the imbalance between supply and demand causing price increases in recent months eventually eases.
In July, price increases slowed but remained at a 13-year high on a yearly basis amid tentative signs inflation has peaked.
Market watchers will also be looking at Thursday’s figures on retail sales, which are expected to decline for a second straight month.
UK data
Last week Bank of England governor Andrew Bailey warned that the economic rebound in the UK is slowing, so this week’s data on inflation, employment and retail sales will be closely watched, particularly ahead of the Bank of England’s upcoming policy meeting on Sept 23.
July data showed that inflation slowed to 2%, while retail sales fell 2.5% month-on-month.
Tuesday's jobs data will also be in focus amid labor shortages and a record 8.8% increase in wage growth in June. The end of furlough schemes may push people into the jobs market, but skills shortages risk fueling price pressures driven by supply bottlenecks and commodity prices.
ECB speakers
In the euro zone, ECB Chief Economist Philip Lane and Bank of Finland Governor Olli Rehn are both due to make appearances, with investors hoping for more insights into last week’s decision to pare back emergency bond purchases over the coming quarter.
The move is a small first step towards unwinding the emergency stimulus the ECB deployed to bolster the euro zone economy during the coronavirus pandemic.
ECB President Christine Lagarde was eager to stress that the move wasn’t the start of tapering.
The move by the ECB to trim bond purchases is expected to be followed by the Fed later this year, despite the disappointing August U.S. jobs report.
China data
China is to release data on industrial production, retail sales and fixed asset investment on Wednesday, which will show the economic impact of a widespread Covid outbreak in August, which saw Beijing partially close the world’s third-busiest container port and impose fresh restrictions across some areas of the country.
While the latest outbreaks have been largely contained the Chinese economy is still facing headwinds.
While exports have remained strong, boosted by robust global demand domestic demand has faltered amid virus containment measures, supply bottlenecks, tighter measures to tame property prices and a campaign to reduce carbon emissions.

BUY SPX500Good morning traders ! As you can see we have a high volume SPRING BOX which is a good signal to BUY S&P 500 . Buy it now !
SL and TP place them on your own.

Here's some more bear heat for yaWe have now officially broken down out of the multi year rising wedge after getting almost to the exact apex of the drawing.
The measured and or implied move for this rising wedge is roughly -1202.89 points or 26.64%.
When we toss up a fixed range volume profile from our blow off top in 2018 to current price action it's apparent that we've just had one massive, massive Fed fueled momentum overshoot.
What I've done is marked off the levels of highest participation in volume, or, most likely areas of support based off of volume profile.
Those levels are roughly:
4185
3913
3692
3372 (Top of value area)
These levels pale in comparison to the volume or participation in the value area.
The Volume Profile Value Area is not until 3372. Yes, 3372. Meaning a trade down into the value area would net us somewhere around -1125 points... Roughly coinciding with our measured move.
A trade down into the Volume Profile Point of Control would be roughly -1775 points or -40%...
Your ball Jpow.

S&P500 LEVELSAs the S&P starts to search for liquidity before it can head higher again ill be very interested in the reaction to the 4450 zone with the 50% level accompanied by a GAP. Also interest in the 4420 zone with the 79% level.

SPX500USDThe S&P 500 Index printed a small bullish candlestick which ended the week just a fraction below its record high price. Since the coronavirus crash of 2020, this benchmark U.S. equity index has more than doubled in value, which is an excellent return over barely seventeen months. The S&P 500 Index is a buy.

The S&P Bullish trend is still ActiveHello everyone, as we all know the market action discounts everything :)
_________________________________Make sure to Like and Follow if you like the idea_________________________________
The Bullish trend that started in November where the SPX index started moving up in an Ascending Channel is not stopping yet. The trend is still giving Bullish signals where we kept getting higher highs and higher lows.
The S&P 500 index booked fresh record closes on Thursday, despite falling from the session’s best levels, ahead of a highly anticipated August employment report on Friday.
The index price is still not showing any signs of weakness and most likely the Index movement for the next period of time will be like this :
If we look at the chart and where the market is right now we see that every time the SPX hit the upper end of the Ascending channel it always dropped into the middle range of the Channel, We probably won't see a big Bullish breakout in the Index right now, so the price most likely will be dropping this week a bit and it will be headed near the first support line at 4474.64 and if the Bears were able to gain more control then it could reach the second support at 4439.92 where the major Bull power will be and where the bounce back up will happen that would get the index above the resistance zone between 4528.74 - 4548.12.
Technical indicators are showing this :
The S&P 500 index is trending above the 5 10 20 50 100 and 200 MA and EMA ( Bullish Sign)
The MACD is above the 0 line showing that the market is in a Bullish state, With a positive crossover between The MACD line and The Signal line.
The STOCH indicator is in the overbought zone, With a positive crossover between %K (95.00) and %D (92.84). *The overbought zone indicates that the price might drop down.
The Ultimate Oscillator is at 79.95 sitting in the overbought zone. The overbought zone indicates that the price might drop down.
Support & Resistance points :
Support/Resistance
1) 4474.64 1) 4528.74
2) 4439.92 2) 4548.12
3) 4420.54 3) 4582.84
Fundamental point of view :
On Thursday, the S&P 500 rose to records on the back of better-than-expected jobless claims data. The initial filings for unemployment insurance fell to their lowest levels since March 2020.
The Labor Department reported first-time jobless claims totaled 340,000 for the week ended Aug. 28, compared with the 345,000 estimate.
The S&P 500 climbed 0.3%, hitting its 54th record closing high of 2021.
Investors are now looking ahead to August’s nonfarm payrolls report — released Friday morning — which could give clues about how fast the Federal Reserve will remove easy monetary policy. Economists polled by Dow Jones expect 720,000 jobs were added in the month, down from 943,000 jobs added in July. The unemployment rate is expected to dip to 5.2%, compared to 5.4% in July. According to CNBC Markets
This is my personal opinion done with technical analysis of the market price and research online from fundamental analysts for The Fundamental point of view, not financial advice.
If you have any questions please ask and have a great day !!
Thank you for reading.

SPX500USD ES1! SnP500 2021 Aug 23 WeekOANDA:SPX500USD
ES1!
SPX500USD ES1! SnP500 2021 Aug 23 Week
Price approaching previous supply area, there may be temporary weakness. Wait for
price to come down first before taking a long.
Weekly: Ultra Wide Spread Up bar closing off high, and lower than previous bar = Weakness.
Daily: Ultra Wide Spread Up Bar, High Volume = Strength
H4: Narrowing Spread, advancing on diminishing volume = Weakness
Strategy for Short (Test and Reject):
- 4476
- 4460
- 4445
Strategy for Long (Test and support):
- 4412
- 4378
- 4345
- bullish absorption past 4476
Like and follow if you find this useful.
Have a profitable trading week ahead.

S&P 500 The trend is not stoppingHello everyone, as we all know the market action discounts everything :)
_________________________________Make sure to Like and Follow if you like the idea_________________________________
A Bullish trend started in November where the SPX index started moving up in an Ascending Channel and the trend kept giving Bullish signals where we kept getting higher highs and higher lows.
The S&P 500 jumped to record closes for a third straight day on Thursday, with mega-cap technology stocks driving the market higher as investors warmed to jobs data showing a steady U.S. economic recovery.
The index price is still not showing any signs of weakness and most likely the Index movement for the next period of time will be like this :
Scenario 1 :
The Index price is at 4429.29 trendings near the first resistance level at 4460.08 and it's gonna try to breakout of that resistance line if the Bulls were able to keep control then we could be seeing the S&P going even further and hitting the resistance levels at 4483.64 or even 4527.08.
Scenario 2 :
If the bulls try to make a move now then we will see a drop in the price that's gonna be headed to near the first support line at 4393.08, where the Bulls and the Bears will battle over control of the trend, The bulls are most likely to win since we have no signs of a reversal yet and the result will bounce the price back up to near the resistance level at 4460.08.
Technical indicators are showing this :
1) The S&P 500 index is trending above the 5 10 20 50 100 and 200 MA and EMA (Bullish Sign)
2) The MACD is above the 0 line showing that the market is in a Bullish state, With a positive crossover between The MACD line and The Signal line.
3) The STOCH is in the overbought zone and has been trending there for the last 10 days, With a positive crossover between %K (98.94) and %D (95.92).
4) The Ultimate Oscillator is at 63.704 giving a Bullish sign
Support & Resistance points :
support Resistance
1) 4393.08 1) 4460.08
2) 4349.64 2) 4483.64
3) 4326.08 3) 4527.08
Fundamental point of view :
The IGCS gauge (IG Client Sentiment Report) implies that 31% of retail investors are net-long the S&P 500. Upside exposure has increased by 1.62% and 9.07% over a daily and weekly basis respectively. The fact that traders are net-short hints that prices may continue rising. The combination of this and recent changes in sentiment are offering a stronger bullish-contrarian trading bias.
All three main equity benchmarks closed higher Thursday and the Dow and S&P 500 booked a third straight record finish after fresh labor-market data provided insight on the pace of the recovery. The moves for stocks came even as a reading for wholesale inflation came in hotter than expected.
the S&P 500 index SPX, +0.30% advanced 0.3% to 4,460, led by gains in health care XLV, +0.79% and technology XLK, +0.57%. The S&P 500 closed at records in three consecutive sessions for the first time since March 15. According to Marketwatch
This is my personal opinion done with technical analysis of the market price and research online from fundamental analysts for The Fundamental point of view, not financial advice.
If you have any questions please ask and have a great day !!
Thank you for reading.

SPX WARNING Fibonacci Circle top and Wave 5 topHi its been a while,
i've been very busy with The OWL and cryptos. I want to show you this chart cos i think we are approching a market top soon, the consequence of a hit of this 3.618 fib would end in my opinion a Supercycle.. which can bring a depression and a Deflation plase. Also this bearish divergence we created since May 1998 is no doubt.

SPX Degree Increments, 5°A chart showing the degree increments between major structures,
showing the advancement of the bullrun and its ascent to the top
The ° value is the yellow line, which in turn provides the Fibonacci circle, which I have just chosen to show 4.618
An observation post

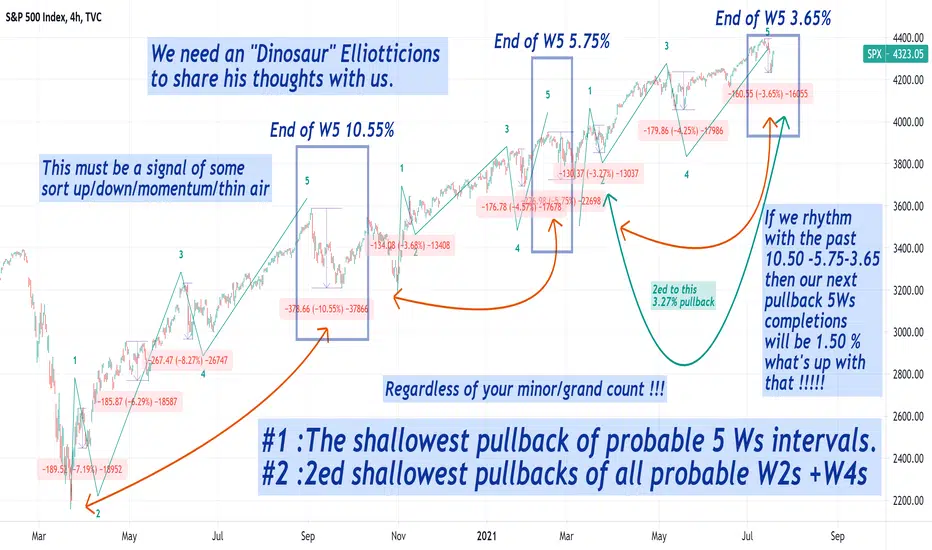
SPX's Elliott, shallowest pullback since Covid =signal up/down ?# 1 The shallowest pullback between 5 Ws intervals.
# 2ed shallowest pullbacks of all probable W2s +W4s since covid's low.
--------------------------------------------------------------
If we rhythm with the past 10.50 -5.75-3.65
then our next pullback 5Ws completions
will be 1.50 % what's up with that !!!!!
SPX500USD 2021 July 26 Week
OANDA:SPX500USD
SPX500USD 2021 July 26 Week
Long from lower green zone was fruitful.
Weekly: Engulfing wide spread up bar, closing at its high. No sign of weakness yet
Daily: Wide spread up bar close of its low, decreasing volume on move up = SOW
H4: Widespread up bar + Upthrust + decreasing volume on move up = SOW
Strategy:
1) Short on ND / Upthrust / Mushroom over
2) Long if there's climatic down bar + strength
Like and follow if you find this useful :)
Have a successful week ahead in whatever you do

SPX Weekly Technical AnalysisSPX Weekly Technical Analysis
All Indicators NEGATIVE
Resistance: 4393,68
Support: 4238,04 - 4164,40
Until 30 August we will watch. Technical looking not good.

S&P 500 : Trade plan for 23 July🕘 S&P 500 : Trade plan for 23 July🕘
Target can act as Support or Resistance,
Trade What you SEE,
Trail Profits at every target or SL at cost.

SPX - Potential important levelsSPX seems to running into problems here. It opened gap down today and filled the previous gaps. But it left an unfilled gap on the upside: 4277-4321. If the gap doesn't get filled, it will likely to boost the global sell-off.
Disclaimer: This is NOT investment advice. This chart is meant for learning purposes only. Invest your capital at your own risk.

Potential Buy setup into 43951)Top-down analysis
Monthly - Previous monthly Closure, Shooting star
Weekly - Very correlated with monthly
(The momentum is very bullish in monthly and weekly)
2) Confluences
a. FIB
b.Trendline 3rd touch
c. Key level
