S&P 500 4H-TIMEFRAME ANALYSIS 💡S&P 500 4H-TIMEFRAME ANALYSIS 💡
Hello ladies and gentlemen
This is my new idea for the S&P 500
My idea is that SPX will continue to downtrend
I hope my idea is clear
Support me by like and share
Good luck💰💯
Spx500analysis

SPX500 possibile sell for todayPossible intraday SELL
(to do within 3pm, eventually)
Entry: 3322
SL: 3334
TP: 3283

SPX500 COULD DROP NOW!Hey tradomaniacs,
looking at SPX500 and the climb as expected we will probably see another sell-off here and at least a retest of the previous trendline to the downside.
Orderbook showing loads of sell-pressure (probably profit-saves by bulls) which makes sense ahead the debate and NFP`s ahead.
I expect that bulls will save their positions before the fundamental events with an unpredictable outcome begin.
Technically we see a nice breakout with a current overbought market which will probably lose momentum soon.
A pullback would be healthy for the bulls to find more power!
We also see how DXY (US-DOLLAR-INDEX) almost didn`t drop and that Risk-On-Assets such as AUD and NZD didn`t really climb.
Bonds are also stable and we see no yield-change which shows there is no significant cahsflow out of save havens into stocks.
Good chance to sell I guess!
LEAVE A LIKE AND A COMMENT - I appreciate every support! =)
Peace and good trades
Irasor
Wanna see more? Don`t forget to follow me.
Any questions? PM me. :-)

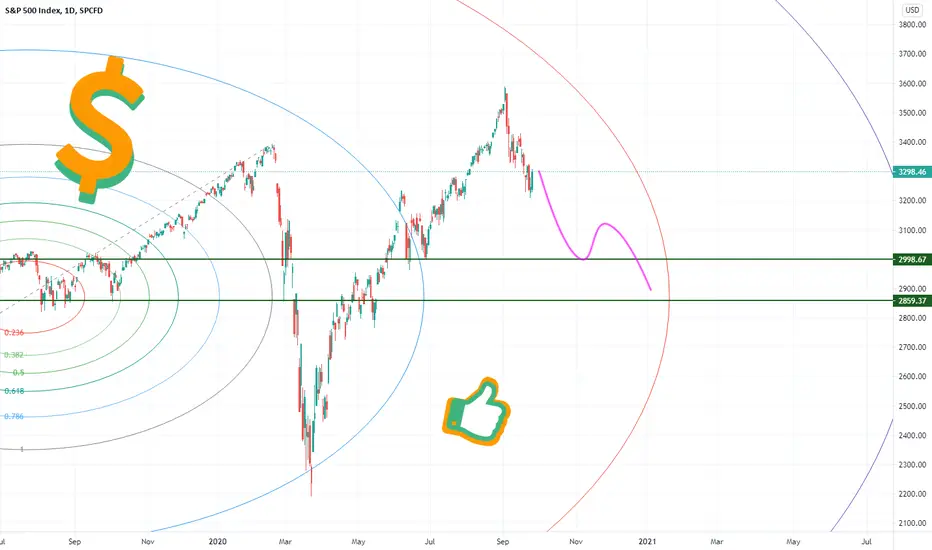
S&P 500 1D-TIMEFRAME ANALYSIS 💡S&P 500 1D-TIMEFRAME ANALYSIS 💡
Hello ladies and gentlemen
This is my new idea for the S&P 500
My idea is that SPX will continue to downtrend
Targets
3000
2850
I hope my idea is clear
Support me by like and share
Good luck💰💯
SP500 (SPY) Hard SELL off of 3440-3500. Good for 400 points!Let's hope it gets up there, first! (Currently scalping/long for bounce.)

SPX vix results refelected on this chart PAIN & GAINIt might sound crazy, but if history is relevant to today's bull market. Then, we could see a bull market the likes of which no one have seeing in our live times. But,
what about if we do not ???? what about if we get some of the less readings. time will tell the story. CHARTS FOR THOUGHT !
wish you all the best.

S&P 500 1W-TIMEFRAME ANALYSISS&P 500 1W-TIMEFRAME ANALYSIS
Hello ladies and gentlemen
This is my new idea for SPX
the price will test 3130 daily support
My idea shows the possibility of breaking this support
But be relaxed
Real support is between 2970 and 3030 It would be good to test it
From there we will start the bull market
I hope my idea is clear
Support me by like and share
Good luck


After FED, possibile short on SPX500Entry: 3453
SL: 3487
TP: 3420
----------------------
Trading Kitchen

S&P 500 - 3300 Objective Met. Lower Prices Still In the Cards.Please give this an idea a like if you found it helpful. Price still has the potential to reach lower. Next Objectives are 3280 & 3250. Remember, I am eventually looking for 3200. Refer to the related ideas attached to this post. Thank you.

S&P 500 is ready to go lower to complete (ABCDE) daily waves S&P 500 is ready to go lower to complete (ABCDE) daily waves and test the key resistance zone 3000

SPX500 and its FAKE-SELL-OFF?!Hey tradomaniacs,
in the chart I show you some points why I doubt in a sell-off right now as it is expiration-day and the volatility is generally very high.
There are so more points I don`t need to note as they need more explanation but these points are enough for me to stack more longs.
In case of a drop I just hedge positions. :-)
LEAVE A LIKE AND A COMMENT - I appreciate every support! =)
Peace and good trades
Irasor
Wanna see more? Don`t forget to follow me.
Any questions? PM me. :-)


SPX & MACD Relationshipe on a weekly chart success rate is less than 14 %, but you could miss out big corrections which happens to be
the big three since 2009 check chart for more info.
. wish all the best.

SPX500 STACKING long PositionsHey tradomaniacs,
SPX500 looks very bullish to me as the previous fakeouts have created a double-bottom-pattern.
These fakeouts were the perfect moves to washout these massive crows of robin-hood-traders.
The current option-market is full of these retailers who are taking the liquidity for the big players.
To get this liquidity big players are forced to manipulate the market to the downside in order to hunt the stop-losses.
When I look at the market-depth (on daily basis) I can see accumulation of volume and these SL-Hunt-Moves as the sellers instantly get aborbed by the ALGOs.
Economy is also recovering well so far which is why I expect more momentum to the upside.
As always I will manage this trade very aggressively, especially ahead the FOMC-meeting today.
LEAVE A LIKE AND A COMMENT - I appreciate every support! =)
Peace and good trades
Irasor
Wanna see more? Don`t forget to follow me.
Any questions? PM me. :-)

SPX500: our viewSPX500. The uptrend seems over (right by now).
Let's see where it will react. he only possible trade we see now is on 3560 area.
----
Trading Kitchen

SPX Golden Cross & 50d MA strong relation.zoom in in the chart for more details.
wish you all the best.


The S&P 500 will tell us what it's up toThe S&P 500 will tell us what it's up to.
Many pendulum variations between center, upper and lower channel wall on the way down are conceivable.
It is important not to lose sight of the essential.

SPX Above 100d MA mix reading, false, correct, missed 2 big oncenothing to say, i will include both charts.

SPX500 LONG SET UP TO NEW ATH WILL SPX500 OBEY TREND TO NEW HIGHS OR BREAK TREND DROP YOU COMMENT BELOW
