S&P 500: Long Trade Targets AheadS&P 500 Trade Details:
The S&P 500 (SPX) on the 15-minute timeframe confirms a bullish breakout according to the Risological trading indicator . Target 1 (TP1) has been successfully hit, with higher targets in sight, as the bullish momentum sustains.
S&P 500 Key Levels:
Entry: 5889.16
Stop Loss (SL): 5872.22
S&P 500 Take Profit Targets:
TP1: 5910.09 ✅
TP2: 5943.96
TP3: 5977.82
TP4: 5998.75
Analysis:
The price action indicates strong upward momentum with consecutive bullish candles. The moving averages align to support the trend. Short-term resistance at higher targets may see consolidation before further upward movement.
Outlook:
With TP1 hit, the trade looks promising to reach TP2 and beyond. Keep monitoring momentum strength and secure profits as each level is achieved. Stay cautious of reversals near key resistance zones.
Spx500analysis

SPX500 Will Fall!FOREXCOM:SPX500 is trading in a
Downtrend and the indice
Is making a pullback
From the horizontal resistance
Of 5771.33 from where
We will be expecting a
Further move down !

SPX500 Potential Short!SPX500 made a strong
Move upwards and the indice
Will soon retest a horizontal
Resistance of 5859.42 from
Where we will be expecting
A local bearish pullback
And a move down !

SPX 500 I Two areas of potential long opportunity Welcome back! Let me know your thoughts in the comments!
** SPX500 Analysis - Listen to video!
We recommend that you keep this pair on your watchlist and enter when the entry criteria of your strategy is met.
Please support this idea with a LIKE and COMMENT if you find it useful and Click "Follow" on our profile if you'd like these trade ideas delivered straight to your email in the future.
Thanks for your continued support!Welcome back! Let me know your thoughts in the comments!

US500 S&P Technical Analysis & Trade Idea 👀👉 US500: I am carefully watching for a potential buying opportunity based on the key criteria discussed in the video regarding the SPX. In this analysis, we will examine the crucial price action signals to track and how to position yourself strategically to capitalise on the next market move. Disclaimer: This analysis is for informational purposes only and is not intended as financial advice.📊✅

SPX500 Will Go Down!SPX500 is going down
Now after the bearish
Breakout of the rising support
So after a potential local
Pullback we will be
Expecting a further move down

S&P 500 (SPX) Hits All Targets! Bullish Rally CompletesThe S&P 500 Index has shown strong bullish momentum, with the long trade successfully reaching all profit targets.
Key Levels
Entry: 5719.98 – The long position was entered as the price broke above this level, confirming bullish sentiment.
Stop-Loss (SL): 5703.41 – Positioned below recent support to protect against potential downside risk.
Take Profit 1 (TP1): 5740.45 – The first target was hit, confirming the upward momentum.
Take Profit 2 (TP2): 5773.57 – The second target was achieved as the bullish trend continued.
Take Profit 3 (TP3): 5806.70 – The third target was reached, indicating continued strength in the market.
Take Profit 4 (TP4): 5827.17 – The final profit target was reached, marking a highly successful long trade.
Trend Analysis
The price is well above the Risological Dotted trendline, indicating a strong bullish trend. The steady upward movement suggests that the market sentiment is favorable for further gains, although all targets have been hit, marking the trade's conclusion.
The long trade on the S&P 500 Index successfully hit all profit targets, with the final target at 5827.17 signaling a strong rally. The upward momentum was supported by the Risological Dotted trendline, reflecting solid market conditions for bullish trades.

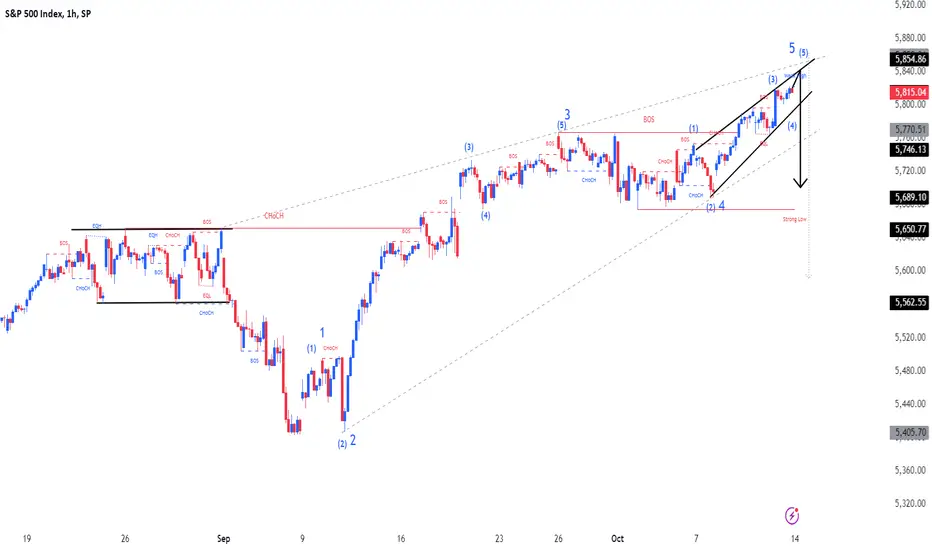
SPX500Pair : SPX500 Index
Description :
Completed " 12345 " Impulsive Waves
Break of Structure
RSI - Divergence
Rising Wedge as an Corrective Pattern in Short Time Frame and Long Time Frame
Demand Zone
US Markets Demonstrate Confidence Despite Election JittersThe US markets are currently demonstrating a bullish sentiment, despite concerns surrounding the upcoming election.
All major indices, including the S&P 500, NYSE Composite, and Nasdaq Composite, have formed a bullish Cup & Handle chart pattern and have subsequently broken to follow an upward trend.
While the S&P 500 and NYSE Composite have reached new all-time highs, the Nasdaq Composite is close to its highest peak, further reinforcing the positive market outlook.
'This overall bullish sentiment suggests that the upward trend in the US markets is likely to continue, even in the face of election-related uncertainties.

S&P 500 Bull Breakout: What Is Next?A strong daily bullish close hold could open the door for another bull rally on S&P500

spx &nasdaq in an iminent drop of valuespx showing an iminent short going in value, where it can go? last time i tryed to do the math it would go arround 2700 but without any sure, the major stock whealtiest did a 3x wealth since covid drop, this could be another timer that can quintuple the value, or make more 15x time the value that they had before covid, it is an iminent drop coming, in my opinion, good for everyone even for world economies, to triple their whealth and put the profits in their balance sheet and put time their gdp growth, is a question of timing, after covid drop, that in my opinion, didnt had too much growth in manufactories and jobs, only people gowing ther whealth by the 'inflation' fault,
anyway, there is an iminent drop in the stock market in the western countries, at least, im not into asian market but american indexes are in an eminent significant drop, in my POV.

SPX500 Resistance Ahead!SPX500 keep growing in
An uptrend but the index
Will soon hit a horizontal
Resistance of 5645.15 and
After the retest we will
Be expecting a local
Bearish reaction!

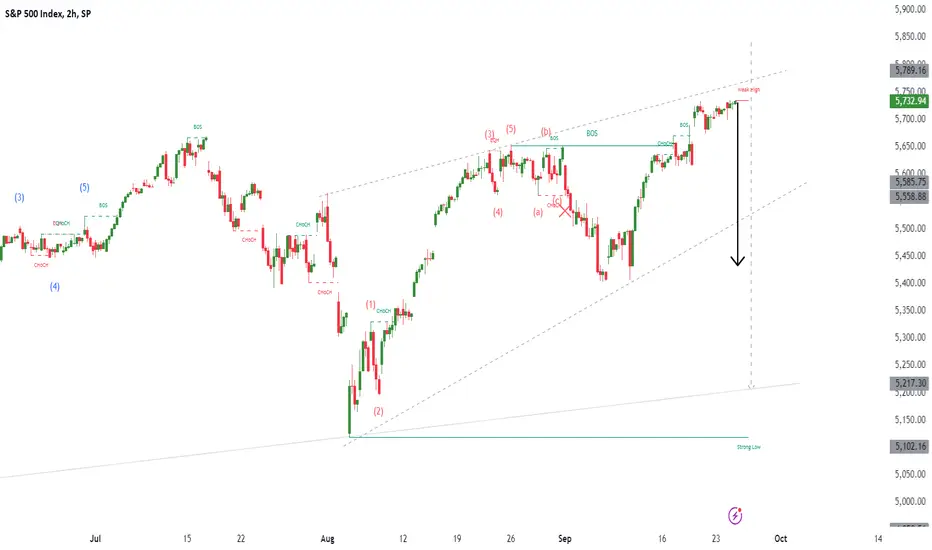
SPX500Pair : SPX500 Index
Description :
Completed " 12345 " Impulsive Waves
Break of Structure
RSI - Divergence
Rising Wedge as an Corrective Pattern in Short Time Frame
Resistance Level
SPX500 Potential Long!SPX500 is trading in an
Uptrend and indice is now
Making a pullback to
Retest a horizontal support
Of 5645.80 so after the retest
We will be expecting
A local bullish rebound !

NAS100 Technical Analysis and Trade Idea (NASDAQ)👀 👉 Here's my take on the current NAS100 (NASDAQ) situation:
The S&P 500 index is exhibiting clear signs of smart money influence. We're seeing a calculated manipulation of price action, with recent moves targeting a previous range high followed by an expansion to the downside. This pattern suggests institutional players are strategically positioning themselves for a potential bearish move.
## Interest Rate Speculation and Stop Hunting
The market's reaction to rumors of lower interest rates has created a classic "buy the rumor, sell the news" scenario. This rally has likely triggered a cascade of stop losses, setting the stage for a potentially significant sell-off. Such price action often precedes larger market moves, as it clears out weak hands and creates liquidity for larger players.
## Seasonal Considerations
Historically, mid-September has been a bearish period for the S&P 500. This seasonal tendency aligns with our current technical setup, adding weight to the bearish thesis. It's crucial to note that while seasonality isn't deterministic, it can provide an edge when combined with other technical factors.
## Technical Outlook
The daily chart shows bearish divergence on key momentum indicators. The MACD is displaying a bearish crossover, while the RSI, currently at 67.35, suggests there's ample room for downside before reaching oversold conditions . The index is also approaching overbought territory on the Stochastic oscillator, further supporting a potential reversal .
## Trade Strategy
Given this confluence of factors, my bias is decidedly bearish. I'm looking to initiate short positions targeting previous support levels. Key resistance to watch is around 5,624, which aligns with recent pivot points . For entry, I'll be watching for a break and retest of the current range lows, potentially around the 5,618 level .
Remember, while this analysis provides a strong directional bias, always manage your risk carefully. The S&P 500 can be volatile, especially during periods of economic uncertainty. Position sizing and well-placed stops are crucial for long-term trading success. 📉✅

SPX500 Resistance Ahead!SPX500 is making a bullish
Correction and will soon
Hit a horizontal resistance
Level of 5492.01 from where
We will be expecting a
Further move down !

SPX500 Rebounds. Support Respected.SPX500 respected its weekly support line and reverses.
Expect more ascending movements from hereon:
Spotted 4027.0
SL at 3800
TAYOR.

SPX500 Will Fall! SPX500 made a swift
Bullish recovery from the
Lows but the Indice is now
Retesting a horizontal
Resistance level of 5555.01 we will be
Expecting a local
Bearish correction!

S&P500 Short Setup with a Quick Long OpportunityThe S&P500 is approaching red line resistance, offering potential short opportunities. For those looking to flip the script, a quick long trade could be on the table after a retest of the green line support. Timing will be key here—watch for reactions at these crucial levels.
Stay tuned for more chart insights, and follow for updates as the price action unfolds!
*Disclaimer: This is not financial advice. Always trade responsibly!*

SPX Analysis for Today: What’s Next After Yesterday’s Big Drop?Wow! Yesterday was brutal for us all on SPX with a major bearish move that probably left a lot of traders scratching their heads. So, what’s the game plan for today? Let’s break it down.
1. Technical Picture After the Drop
Yesterday’s sell-off took SPX to key levels, and now we’re sitting in some interesting territory. The 5550-5570 range is what we’re watching closely—this could act as support, but if it cracks, we might be heading lower, potentially toward 5500.
On the flip side, if buyers step in, we could see a bounce back toward 5550, which was previous support but might now act as resistance. Traders should keep an eye on whether we break out of that range or get rejected.
2. The News That Matters
A lot of today’s action depends on what’s going on in the broader world. Are we getting any new data on inflation or jobs? If inflation numbers come in hot, the market could get nervous again, anticipating more rate hikes from the Fed. But if the data is lighter, we might get a relief rally after yesterday’s beatdown.
Also, keep an eye on any big headlines—geopolitical tension, tech earnings, or even Fed commentary. All of these could be wildcards that drive sentiment today.
3. Sentiment Check
We’ve got VIX (the fear gauge) pretty elevated right now, so people are still pretty nervous. Watch for whether that calms down today—if it does, we might get some relief in SPX. But if VIX stays high or climbs further, brace yourselves for more volatility.
The Bottom Line:
If today’s news stokes more fear, we could see another push lower. But if the market takes a breather, we might get a short-term bounce. Either way, buckle up—it’s going to be another interesting session!

SPXPair : SPX500 Index
Description :
Double Top Pattern in Long Time Frame
RSI - Divergence
Resistance Level
Rising Wedge as an Corrective Pattern in Short Time Frame
Completed " 12345 " Impulsive Waves

Why ORB + VWAP is Your New Best Friend in Trading -No, SeriouslySP:SPX Hey there, traders! Deno Trading here;👋 Stop feeling like the market is just a one big, mysterious puzzle, and felt you're missing the piece that makes everything click? Well, strap in, because today we're diving into the magic of the Open Range Breakout (ORB) strategy, sprinkled with a little VWAP (Volume Weighted Average Price) magic dust. Spoiler alert: This combo is like peanut butter and jelly for traders—simple, effective, and deliciously profitable.
The Chart (aka "The Battlefield")
Take a look at the chart above—our trusty S&P 500 on a 15-minute time frame. Notice those blue zones? That’s your ORB, the first 15-30 minutes of market action where all the cool kids (a.k.a. the big institutions) are making their moves. The VWAP line? That’s the referee, keeping everyone honest.
Now, let’s break down why ORB works most of the time (we're not wizards, after all, just really good strategists).
ORB: The Reliable Wingman
Imagine ORB as your super-reliable wingman. It’s there at the start of the trading day, setting the boundaries. If the price breaks out of this range, it’s like getting the go-ahead from your wingman to approach—“Yeah, this one's a keeper.”
In our chart, you can see how every time the price breaks above or below the ORB, it either rockets off to the moon 🌕 or dives deep into the abyss. And just like in life, we always want to go with the flow—if the price breaks out, we’re in for the ride.
VWAP: The Truth Serum
Now, let’s talk VWAP. Think of VWAP as the lie detector of the trading world. When the price is above VWAP, it’s like the market is saying, “I’m feeling good, let’s keep pushing higher.” Below VWAP? Well, it’s like the market’s had a rough night out, and it’s probably heading home early.
In this chart, you’ll notice how the price interacts with VWAP after breaking out of the ORB. When the price stays above VWAP after a breakout, it’s a sign that the bulls are in control—cue the confetti! 🎉 But when it dips below, the bears start growling, and you might want to reconsider your long positions.
Jokes Aside But Hey: ORB Always Works (Except When It Doesn’t)
Let’s be real for a second—ORB mostly works. Kind of like how your Wi-Fi mostly works until you really need it. But when ORB does work, it’s like hitting the jackpot. You’re basically riding the wave that everyone else is trying to catch. And if it doesn’t work? Well, blame it on the market gremlins and move on.
Why and Why again: ORB + VWAP = Trading BFFs
Let me wrap up that if you’re not using ORB with VWAP, you’re missing out on a killer combo. These two are like Batman and Robin, or coffee and donuts—they just make sense together. So, the next time you’re staring at your charts, remember: Trust in the ORB, let VWAP be your guide, and don’t forget to laugh at the market’s little quirks and use the news as your catalysts. Because at the end of the day, trading should be fun, profitable, and maybe just a little bit magical.
Now go forth and conquer those charts, my fellow traders! 🚀 Deno Trading in and out!

SPX500 Bullish Bias!SPX500 went down and
Made a retest of a horizontal
Support level of 5595.23
And as it is a strong level we
Will be expecting a local
Bullish rebound!
