SPX500 Risky Long!SPX500 is trading in an
Uptrend along the rising
Support line from where
We are already seeing a
Bullish rebound so I think
That it will go higher still !
Spx500analysis

5050 is the next point stop?I prefer to ignore reality and focus only on what the graph will show me, because every new week we have good news regarding the American economy, but the good news will have to come to an end at some point, as there is a saying that goes like this; "There is no such thing as a free lunch. If you didn't pay for it, someone else will have to."
In the long term we are still in a strong upward pivot, and amazingly, it could reach the gold region at 5050. What a great thing, right?
Note: The red lines are resistances. If defeated, they project highs up to the yellow lines (targets).
On the medium-term chart, the trend is strong, but the SETUP used is indicating that the bulls are losing strength, therefore, we may not reach the golden target at 5113, remaining only at the long-term golden target reported above (5050).
Note: The red lines are resistances. If defeated, they project highs up to the yellow lines (targets).
On the hourly chart, we have the following: the loss of the 4909 range projects the falls reported in the chart below. The salvation for this correction would be for bulls to act quickly and force prices above the safety level at 4922.
Note: The red lines are support points. Loss of it leads prices to seek the yellow lines (targets)
Click here and see the latest BTC analysis
In conclusion we have:
a) Prices are at an all-time high, a beautiful achievement, but the bulls need to continue their rises and look for the golden target on the long-term chart in the region of 5050. If this does not happen, we could have strong corrections up to the level of 4459.
b) The 4960 region is a resistance that needs to be overcome this week for the long-term uptrend to materialize. So, pay attention to this track as this week begins.
c) Prices working below the 4909 range the best thing to do is stay out, or, if you are brave, working on the short end is the best alternative, but remember. This is a region with strong fights between bulls and bears, so traps will be constant.
SPX here!
Do your analysis and good business.
Be aware, if you buy, use stop loss.
See other graphical analyzes below.

#SPX SPX Jan 24th after the close updateSPX will be the first update from TheTradersRoom.
SPX has hit its desired target we have called yesterday - 4904.50-4909.50
So I call it a perfect hit. Today's reversal came on a heavy selling, also got a black reversal daily closing SPX candle, which if not broken 1c above should mark at least a temporary top.
If the price did find its top, then tomorrow's open should be a gap down below 4864 and my min target will be 4840-4835 SPX
We have a Panic cycle day on the 26th and Im looking for a first important low on Feb 1st
Happy to be back!

SPX500 IndexPair : SPX500 Index
Description :
Rejecting from Resistance Level with Strong Divergence in RSI. Bullish Channel as an Corrective Pattern in Long Time Frame with the Rejection from Upper Trend Line. Completed " 12345 " Impulsive Waves

SPX500 Resistance Ahead!SPX500 will soon hit
A horizontal resistance
Level of 4795.2 and
After the retest we will
Be expecting a move down !

SPX500 IndexPair : SPX500 Index
Description :
Bullish Channel as an Corrective Pattern in Long Time Frame. It has completed " 12345 " Impulsive Waves at Daily Resistance Level creating Double Top Pattern as Corrective Pattern in Short Time Frame. We have Strong Divergence and CHoCH

SPX500 - SHORT STRUCTURE IDEA (TARGET 4725)What's on the chart?
1) An old high that marked a strong year for 2023.
2) A rebound in a weekly FVG that earlier served as a bullish signal for prior trading sessions.
3) In the process of that rebound, a 4H bullish FVG was formed which will serve as our target area + fibs.
4) The 2023 high was broken.
5) IMPORTANT: the new high wasn't taken out. Hmmm.. suspicious. That to me is a sign of weakness from the bulls.
6) On this flop of bullish momentum, a bearish 4H FVG was formed.
7) Market structure shift with a low taken out. Do we expect a rebound? Well I don't know. I'm not here to claim that I predict the future like most twitter gurus will imply. But if it does, this is how I see the rest go down.
8) A rebound in the 4H FVG, this is crucial for a short setup because it would imply a lower high. Super important!! Price doesn't need to go that high though to find a short setup. We could just break our imaginary trendline and that's it.
9) The descent into the abyss of short profits (or liquidations lol).

SPX500 Bearish Bias!SPX500 went up and hit
A horizontal resistance of 4770
From where we are seeing
A bearish reaction so I think
That we will see a move down !

End of Bullish Supertrend? Journey from Support to SupportDear Esteemed Members,
The supertrend was bullish, but two sell signals concluded with a bearish price action.
The rejections happened around the resistance level from a previous top.
The price is now below the upper green support level.
I think the S&P 500 market will reach the next support level: around $4600.
So, I'd consider a short position. You can target the bottom support level of $4600, but keep a stop loss if the market reverses from the proximity of the violated support level.
You can observe a similar setup on my yesterday ES analytics, where I explained a bearish MACD, RSI, BBP, and MFI.
Kind regards,
Ely

S&P500 Next Support LevelClosely monitor the zone indicated in above chart.
Disclaimer: The information and analysis provided in this publication are for educational purposes only and should not be construed as financial advice or recommendations to buy, sell, or hold any securities. The author and TradingView are not responsible for any investment decisions made based on the content presented herein. Always consult a financial professional before making any investment decisions.


SPX500 IndexPair : SPX500 Index
Description :
Completed " 12345 " Impulsive Waves at Daily Resistance Level. Impulse Correction Completed. Breakout of the Corrective Pattern " Bullish Channel " in Short Time Frame and Strong Divergence in RSI

SPX500 Resistance Ahead!SPX500 will soon hit
A horizontal resistance
Level of 4732.26 and
After the retest we will
Be expecting a move down !

Will the S&P500 Index Touch a New All-Time High(ATH)❗️❓📈Because the S&P500 Index is near an All-Time High(ATH), I decided to analyze this index for you and answer the question of whether the S&P500 Index can create a new All-Time High(ATH) or not.
🏃♂️The S&P500 Index has already managed to break the 🔴 Resistance zone( $4,640-$4,540 ) 🔴 and is moving near the 🟡 Price Reversal Zone(PRZ) 🟡 and Resistance lines .
🔔I expect two scenarios for the S&P500 Index:
The scenario of S&P500 Index falling to the broken 🔴 Resistance zone( $4,640-$4,540 ) 🔴 (as a pullback ) and rising again.
In the second scenario, the S&P500 Index falls to the 🔴 Resistance zone( $4,640-$4,540 ) 🔴 and continues falling to the Fibonacci levels that I marked for you in the chart. We saw a bull trap in this scenario.
🔔So, in general, I expect that the S&P500 Index will NOT be able to break 🟡 Price Reversal Zone(PRZ) 🟡and will decrease by at least ➖3% in the coming weeks.
S&P500 Index (SPXUSD),4-hour time frame ⏰.
Do not forget to put Stop loss for your positions (For every position you want to open).
Please follow your strategy; this is just my idea, and I will gladly see your ideas in this post.
Please do not forget the ✅' like '✅ button 🙏😊 & Share it with your friends; thanks, and Trade safe.

SPX500 Will Grow!SPX500 broke the key
Horizontal level of 4588.4
And the index is trading in an
Uptrend so I am bullish biased
And I think we will see
Some further growth !

SPX500 Resistance Ahead!SPX500 will soon hit
A horizontal resistance
Level of 4591.26 and
After the retest we will
Be expecting a move down !

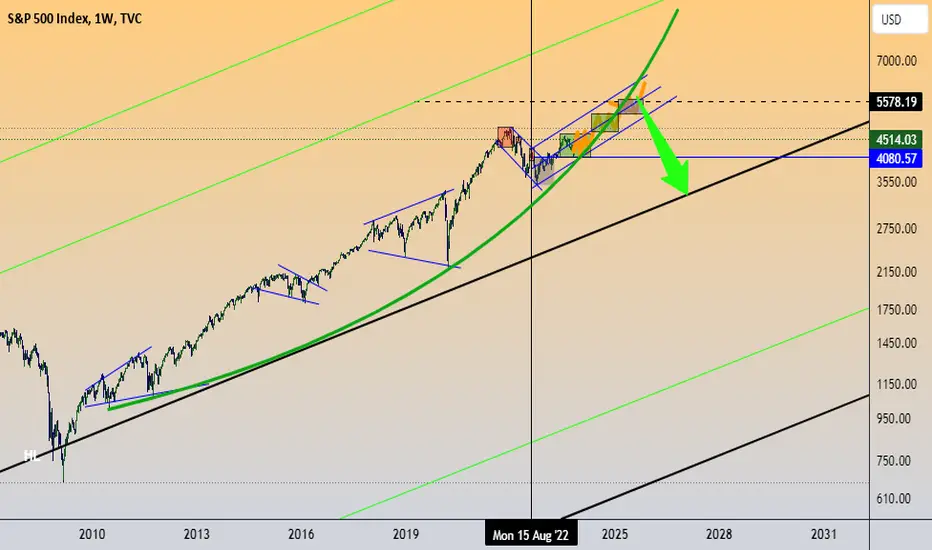
$spx on a parabolic FithCBOE:SPX is climbing it's 5th and last (?) wave from the parabolic rise created since the GFC... targets about 5600 CBOE:SPX and from there I do expect the October 2022 lows to be taken out at last...
SPX SPY SP500 updateExited my bottom snipe 450 calls. 900% in 2-3 weeks. Not bad. Had to take profit.
Following the same plan as outlined in this chart. Waiting for pull back here or close to here. Then calls again.
SPX500 - New Breakout 📈Hello Traders !
On The Daily Time Frame, The SPX500 Price Reached A Strong Support Level (4141.00 - 4103.00).
The Resistance Level (4397.84 - 4376.45) is Broken and Becomes a New Support Level.
The Resistance Line is Broken.
So, I Expect a Bullish Move📈.
i'm waiting for retest...
-----------
TARGET: 4500.00🎯

SPX500Pair : SPX500 Index
Description :
Exp FIAT as an Corrective Pattern in Short Time Frame and Rejection from the Lower Trend Line after it has Completed " abcde " Corrective Waves. Impulsive Wave " 1234 " Completed at Fibonacci Level - 50.00%
Entry Precaution :
Wait until it Breaks or Rejects UTL

S&P 500 - Bullish Continuation for 2024█ OVERVIEW
Since 2022, the S&P 500's consolidation efforts seem to be coming to a clear Head and Shoulders pattern, completed by a recent 3 bullish drives pattern. While it would be naive to think a straight beeline to 5000 is in play, the current price of 4350 is suggesting a return to new highs in early-mid 2024. This is likely to be in sync with the Federal Reserve rate hikes and the resulting market adjustments made at each announcement by Chair Powell. Sharing this as an educational/informative learning opportunity of technicals playing in sync with fundamentals.
█ CONCEPTS
Head and Shoulders
The inverse head and shoulders pattern is a widely recognized technical chart pattern seen on analysis across this platform. Primarily, many see the pattern used in potential trend reversals in various types of markets, particularly in stocks, currencies, and commodities.
The iH&S pattern consists of three main components:
Left Shoulder: First phase that occurs during a downtrend. Represents a temporary low - selling pressure starts to weaken and buyers start to enter
Head : Central and most important component of the pattern. The head forms after the left shoulder and becomes the lowest price level reached in the downtrend
Right Shoulder : Similar to the left shoulder in that it represents another temporary low point in the price
Three Bullish Drives
First Drive: The first drive occurs after a prolonged downtrend, during which selling pressure has dominated the market. In this phase, the price of the asset starts to show signs of stabilization or slight recovery.
Second Drive: Following the initial recovery, there is often a pullback or consolidation in price. This is the second drive, during which the asset's price retraces to some extent but doesn't make new lows.
Third Drive : The third drive is the final and critical phase of the pattern. It occurs when buyers make a strong push to drive the price higher, surpassing the previous resistance levels and confirming the trend reversal.

SPX Break & RetestSPX is now at a key level of prior resistance. Will it be as simple as prior resistance turns into support for SPX?
This is definitely an area to watch.

SPx500 It needs new positive momentum SPx500
if it falls above 4310 in this direction will rise to 4337 then 4361 then 4383
but if it is below 4310 the direction will go down 4278 , 4253 then 4227
Pivot Price: 4310
Resistance prices: 4337 & 4361 & 4383
Support prices: 4278 & 4253 & 4227
timeframe:4
