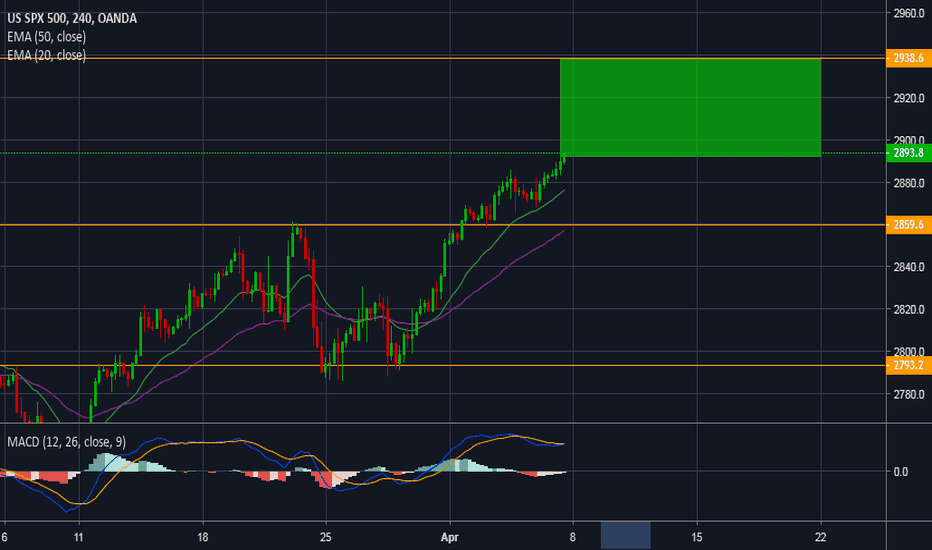
Spx500buy
SPX Sideways Move Absolutely PossibleI'm not saying its going to happen, but many fundies point to indecision. There's little motivating force behind breaking through previous all-time highs. Trade war resolution? Probably not since after US-China, Trump may take on the EU and Japan with auto tariffs. If that goes down, he could easily tip us into recession. At the end of the day, speculative appetite is based on growth which is in generally slowing. Yield curve inversion reminds us we are close to the end. Could be a year out, could be a month out, but either way its coming. You can't time the market and you probably won't sell at the perfect time. Most investors know this and probably don't want to go deep into US equities or world equities for that matter if they know within a year or so they'll be able to buy everything much cheaper. Credit loan swaps remind us of the derivative perils of 2008 with much corporate debt grouped together creating uncertainty over the quality of specific loans. In short, theres many more reasons to e a bear than a bull. Because of this, I could understand a move sideways for several months and then a significant correction and possible recession. For more, check out www.anthonylaurence.wordpress.com
SPX500 approaching support, potential bounce! SPX500 is approaching our first support at 2600 (100% Fibonacci extension, Horizontal swing low support, 76.4% fibonacci retracement) and a strong bounce might occur above this level pushing price up to our major resistance at 2808 (61.8% Fibonacci retracement, Horizontal overlap resistance).
Stochastic (89,5,3) is also approaching support and we might see a corresponding bounce in price should it react off this level.
Trading CFDs on margin carries high risk.
Losses can exceed the initial investment so please ensure you fully understand the risks
SPX500 Sell setting upSPX500 trading in a multi-days bullish channel with tops and lows. Price action is compressing near the resistance area. Chances are it continues compression a little further. Momentum is getting weaker as well so I am looking for a strong break. If you have your trading strategy watch out this market for shorts.
Trade Safe!
HIDDEN BULL 2h dvg could bring higher SPX.StoppLoss 2374.... weakness under that level, could be a bad sign. Will do another rethink of the bull/bear situation then, maybe with some updates here....
Will Ichimoku cloud support SPX at this price too ? Pivot 2384 could be some resistance....?
Nothing is obvious in this situation, but I put the Hidden Bull dvg to do its job untill bear take over.
SPX @ Weekly @ 5.85 % BreakOut > old all-time highSPX confirmed his BreakOut this week
I am thinking the chart is speaks for itself. After 6 false new all-time highs (2015 & 2016) we experienced meanwhile the 9th new all-time high weekend :) And this after 2 major political events this year 2016 !!! I am personally something twisted:
"Are the market so strong ???" (proudly 55.2 Points or 5.65% above old all-time high)
"Are the market so strong ???" (but only 55.2 Points or 5.65% above old all-time high)
How ever,
prices above 2195.0 are suggesting and still new all time highs above this week closed. Even `cause this week candle even only confirms that the market is trading the future and don`t care about BREXIT or even US ELECTION any more. And from this point of view, on the whole, i am pretty optimistic - also beacuse no one is euphoric !!! No euphoric buying mania like 2000 or 2007 !!! Rather disbelieving - and that`s one more outstanding a good fertile soil to reap some earnings in the next weeks further ...
Take care
& analyzed it again
- it`s always your decission ...
(for a bigger picture zoom the chart)
Best regards
Aaron


