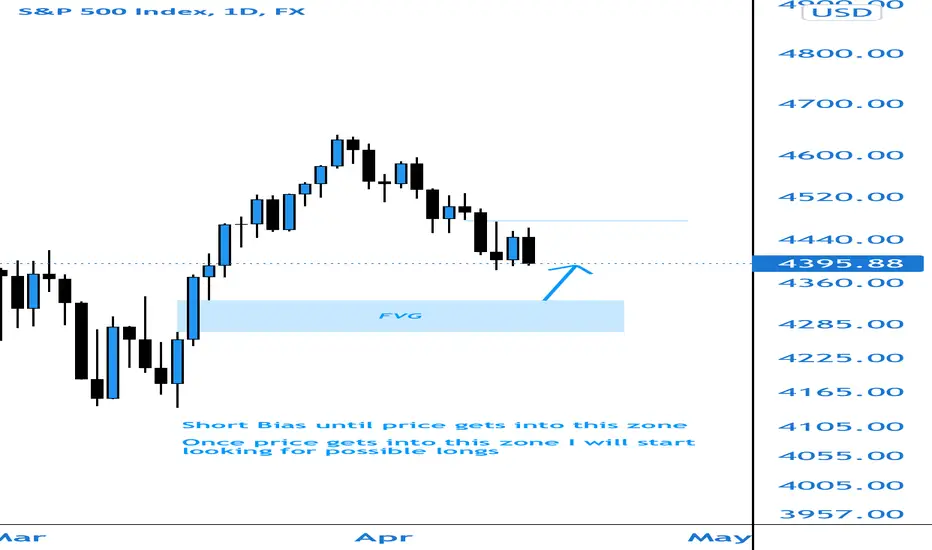
Spx500 Weekly OutlookShould start this week with 2 or 3 bearish days until we get into the FVG. From here we can look to take longs as a reaction from it being filled. Not sure if it will switch bullish but should get a good push up from there at the very least.
Goodluck this week and feel free to leave your opinion below!
Spx500forecast
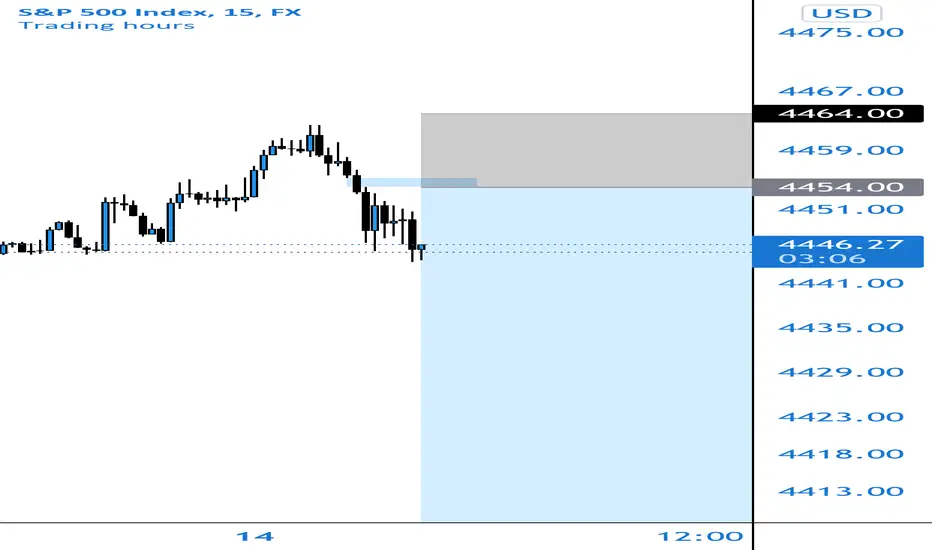
Spx500 Short SignalJust set a sell limit right here on spx500. Had a nice bullish run but didn’t break the high or low. Also the weekly will likely still close bearish so I expect price to take out those lows. Have a nice 15m shift leaving some imbalance to fill and have my stop above the swing High. Use proper risk management and fingers crossed we get triggered in after this nice bearish 4h closes!
SPX S&P500 inverse Head and Shoulders patternSPX S&P500 is looking bearish for now.
I think we might see an inverse head and shoulder chart pattern before closing higher this year.
Looking forward to read your opinion about it.

SP500. TURNED UPSP500 TURNED UP - it's a matter of time, we can leave the current price, we can from a level that is lower, so everything is going according to plan, the way up for bitcoin is open.

S&P500 Short SignalJust set my sell limit. Price has made a new swing low and will likely pullback into the 15m order block and make a lower swing high in comparison to the previous one. We then enter there and target a newer swing low. Goodluck and have proper risk management!

SPX W-Shaped RecoveryI think we might see the end of the war soon.
Russia says the first phase of its “military operation” in Ukraine is mostly complete.
I am considering a W-Shaped Recovery on SPX and a price target of $4710.
Looking forward to read your opinion about it.

#S&P500 Neutral Outlook #S&P500USDThe S&P500 turned bullish last week as it break through the three Crucial Resistance levels which can be tested as support now: the LL Trend line of 2022, the H4 MA200 and the 1D MA50. The natural target zone is the range consisting of the February Resistance (4595) and the 0.618 FIB Level
But the Significant TA Development of the week, is the formation of the Golden Cross on the H4, which happened for the first time since Dec 21. However, as the H4 RSI turned lower on LL and LH, which have been explained by drawing the March 03 sequence ,so it is more likely to see a pull-back first, towards the H4 MA50 and 0.382 Fib initially at 4370-4380 and then the 0.236 Fib at 4270 -4280. Since the channel is potentially Up, that should be considered as Buying opportunity. Price Action below the HL trend-line may impose risks to turn the long-term sentiment bearish .
and obviously the pull-back case will be invalidated if the S&P500USD breaks above the 4595 LTF Resistance first, in that case the 4820 (ATH) will be targeted.

SPX500 Weekly Game Plan $SPX500 Game Plan
As much as I hate opening a position against the trend, these are two levels that I will be observing. In an ideal scenario I want to open the short upon confirmation. What does this mean?
If price reaches one of the two levels - $4524 or $4586, I want a small retracement followed by a double top or lower low. I can then open a short position with a stop loss above the recent high.
For the first order that would be somewhere around $4547, and for the second order that would be around $4617.
--------
P.S. I've been inactive for the past month, so I do apologize to those following me. I am picking up the trades again and soon I will release my new core trading strategy, which relies on trend following and so far has been very promising on indices and commodities, which is what I mainly trade.

Top of the Top of the TopTake your seats and Prepare for the 4th Turning.
De-dollarization is occurring before our eyes.
The game of musical chairs is coming to an end.
We will be lucky to get away with a debt crisis.
The more likely outcome is a currency crisis.
Your currency is not money, it is fiat. It is important you understand the difference. The thing we call money is fiat credit created by banks via loans. Everything is driven by debt and loans. AKA your life is driven by debt and loans. AKA your life is debt and loans.
How did it get this way?
www.atlantafed.org
But don't you know the Wonderful Wizard of Oz?
Remind me... what does the wizard do in the end?
Note: This is Not financial advice. Just what I see.

Confirmed bear trend on SPX!! CRASH COMING?Spx has just had a confirmed trend on the weekly to the downside. Is there a potential crash about to happen? Inflation is through the roof, The us has stopped printing money, Interest rates are going up this year in most countries...... What happens next?
We are due for a correction at least. We have a correction every two years. Looking at all the data most corrections have a pullback between the 13-20% mark. Bear markets hit at least the 35%- 50% mark. If the bear market is happening we will see price drop to the 2020 lows.
You have to look at all the facts, do yourself a favour and go look at some of the top companies in the world
Netflix
Uber
Paypal
Zip pay
Meta (facebook)
Alibaba
Tesla
These companies have fallen near 50% and so has the crypto market.
Google and amazon have an unconfirmed trend at the moment however i highly predict they will make a new low on the weekly. How far will we drop no one knows. However you can look at this as opportunity to get some great buys coming up in all markets.
Invest safely

SPX Zig Zag ABC for Cycle Wave 4Hi everyone, SPX is currently playing Impulse Intermediate wave 5 of a Main A Wave. Most probable targets for this Wave 5 are 4212 and 3976. Because last Wave 2 (in blue) was very strong, im expected at least a troncated wave 5 at 4212. 4358 (100% of fobonnacci) is the 1st possible Wave 5 target but i would be very surprised if the market makers are not bringing the market down to 4212 because a double bottom would provide us a better bounce back for the next B wave and can at the same time create a bullish divergence on lower timeframes like the 4 hours or 1 day chart. We should not forget that the last january 04rt SPX began a Cycle wave 4 retracement. Here are the most probable targets for this full Cycle Wave 4 Retracement :
0.24% = 3878.24
0.30% = 3643.26
0.382% = 3322.12
0.50% = 2860
0.618% = Golden fib at 2398
We must keep in mind Cycle Wave 2 of SPX was pretty strong in March 200, which make this Cycle Wave 4 more chance to be light. Usually most probable target for a W4 is in between 0.3% and 0.5%. With inflation currently slowly stablizing a little , 3643.26 or even 3878.24 are on the table and pretty realistic.
For now im projecting the next B Wave in between 4443.89 and 4729.88.

SPX500 about to fall! Good FX-Trades incoming!Hey Tradomaniacs,
Here two key-notes that shows a divergence of the ECB and FED:
1️⃣ Very hawkish FED
"The market now sees a strong chance of the Federal Reserve starting its monetary policy tightening with a 50 basis point hike in March, especially after St. Louis Fed President James Bullard stated that he has become "dramatically" more hawkish. He added that he now wants a full percentage point of interest rate hikes over the next three U.S. central bank policy meetings."
2️⃣ Very cautious ECB
"European Central Bank President Christine Lagarde warned on Thursday that tightening monetary policy too quickly could harm the eurozone’s economic recovery, warning that the Eurozone can’t be compared to other major regions."
Read the article 👉 www.investing.com
Just in this post we can see clearly find nice opportunities as the euro is likely to fall while the Us-Dollar should continue its rally from yesterday.
Look at SPX500 and the fakeout 👉
You remember this chart? The rumors by JP Morgan have caused a rally.
One concern I have is that short-term-yields are currently stronger than long-term-yields. As long as these moves are not too extended we won`t see inverted yield-curves but as soon as that happens the markt could expect the FED to overthink its current plans as an inverted yield-curve is a sign for a recession. (I`ve explained why and how thats a problem for banks)
However, we finally might get good moves after this choppy week since we have seen the important inflation-data. 👌

ES megaphone at play?Will we find a low at 4330/4350 range or are we heading lower to 4225/4250? Time will tell.

S&P 500 Bullish Pattern S&P 500 Bullish Pattern
Each time S&P create a swing low wave in the daily , a bullish big wave is the next

SPX is about to reverse, wave 5 of C is almost completed.Hi everyone, SPX is about to complet the C wave inside this Zig Zag ABC. Max wave 5 target (the 261.8%) fib is at 4500. It's a very clean pattern, impulse down in A, ABC in B and impulse down in C on the 100% fib. SPX is already diverging (bullish Divergence Class A on the RSI).
The big question is what's next...?
It can be 2 things now, a new higher high or the beginning of a WXY in what i think can be a Cycle Wave 4 retracement.
Where this Wave 4 can go ? At least to 3935 in the 0.24 fib from our last wave 2 we made in March 2009. But in between 0.3 and 0.5 more common (probable).
Best to you !! Thanks for your comments !

S&P 500 (SPX) | Bulls are BackS&P 500 (SPX) has been in bullish trend since March of 2020. It has been following bullish parallel channel by heart.
Recently it has broken the trendline but found a good support at Fib Level 0.236.
We are expecting bulls to be active again as they were little tired with almost 2 years of trend.
This support zone will be important level and bounce is expected from here to atleast recent high and if broken to ALL TIME HIGHS.
Trade your levels accordingly.
Don't forget to share your valuable feedback in comment section.
Check our other Forex and Crypto Setup on Profile.

Do it like GreeceStudy the greek economy & politics from the period 1990-2012 and you might find a lot of similarities with that is currently happening in the US. Greece experienced a credit boom from 1990-2008, people however were living above their means. We faced the biggest bubble in Greece's economic history during the 1999 when everybody was playing the stock market! and i mean everybody! i remember my father telling me that the biggest sign he saw that the bubble was about to pop was when his mother in law (late 99) came and told him that she wanted to play the stock market as well! When he asked her why she replied: because the other granny across the street is making money... That was the sing! who the hell was left to buy????
Then the bubble popped together with the .com bubble but people were not selling in the contrary in 2003 they start borrowing and selling their houses,farms whatever they had and played all in! because in their mind and in the media that was the bottom! The ultimate buy the dip!!!then we had the golden age of modern Greece! Various outstanding sports events wins! like the Euro 2004, beating the US Basketball Team, and the cherry on top hosting the Olympic Games of 2004, oh boy euphoria was back in the game and this time for good! We were borrowing more and more money to live a life we could not support! our debt got bigger and bigger but when the 08 housing market popped it was time for us to pay our debts!
You know what happened next! check the graph here (www.capital.gr) but only till 2012 because then we had to recapitalize our banks 4 times so the graph is not representative of the whole market. From a political perspective the 2 biggest political parties left and right had to form a government together in order go through this tough period. Our debt was restructured and taxation went sky high! especially for the middle class who paid the majority of the bill!
How are things now? well we sold almost all our assets to foreign investors/countries for peanuts! we got used after 10 years to a -50% income and prices are something like 100%-200% higher than 2000...

sp500Anyone ever look at #SPX500 12 M chart? Looks to me like we are in an obvious W3. Question is W3 going to hit that 3.618% Fib level B4 tanking back down to test the 1.618% or is W3 done here?
The way #SPX cuts through fibs I think 5,700 is more likely 1st.

SPX - TRADING PLANLooking at the 4hr SPX500USD chart I have found a couple of price levels where price may reach for and target before hitting the 5000 mark.
We see price has been consolidating for some time now and making volatile moves both up and down. This has created and left liquidity pools which I believe should and could be reached for. The dashed trendlines showcase the areas where there is liquidity sitting and are also in places where I have identified an inefficiency.
Thus, I believe price could come down even more and target these before moving up strongly and quickly.
Another confirmation of another move and down here is the head and shoulders pattern formed by the market.
Although I anticipate a drop in the market, I will not be selling until I see a valid setup and will mainly be focused on securing the buy.
There are 3 potential trade ideas here. The first one has a more aggressive stop loss to maintain a good risk to reward while the 2nd one has the same entry but a more conservative stop loss.
The 3rd entry is very deep into the retracement and may not be filled hence the earlier entries.
I personally will be placing 1% risk on the first, 0.5% on the second and 1% on the third; giving us a maximum of 2.5% loss.
The black horizontal lines represent my take profit areas.
DISCLAIMER: I am not a financial advisor and nor is this financial advice. Only risk what you can afford to lose and this type of speculative trading can result in loss and/or profits.

SPX500 TRADING PLAN - BUYLooking for s&p to fill in the imbalance and potentially run higher.
2 entries have been identified, one where price could tap into the imbalance (which is also a quarter point level) and run higher
The other, price could retrace into the daily orderblock and then run higher, this entry provides a better R:R
DISCLAIMER: I am not a financial advisor and nor is this financial advice.

SP500- Bearish Engulfing announce correction?In yesterday's Nasdaq100 analysis I said that I expect a drop for the index and 14k is my first target. Things are not different for SP500, here also expecting the price to drop.
Also, SP500 has started the year badly, with a bearish engulfing weekly candle and, although the price structure is not so bearish like in Nasdaq's case, a drop is probable here also.
4600 is trend line support, that kept the price elevated for more than a year now, and a break here would increase chances for a drop to 4250-4300 horizontal support.
In bearish this index too and I will look to sell rallies.
A new ATH would delay this scenario.

BUY SPX500Good morning traders, after the analysis I've made on the S&P it shows that it will go long for today. Buy it and place TP and SL on your own.

SPX500 Long Setup$SPX500 Weekly Analysis (Long)
Based on the formed ascending channel, I believe price is currently in overbought territory, and as such it will retrace back down to the lower trend line. The zone of interest is between $4,646 and $4,710.
That is of course in case the price doesn't go through the highest high level ($4,815), in which case I will either be buying the breakout or wait for a pullback in order to open a long.
Those with higher risk appetite may decide to short the security down to the above mentioned level. I personally may do that, but I'm still waiting for some more solid confirmation
