Corona Virus UpdateLet's check how fast it comes. Or not but it somehow is showing a lack of strength.
What are your thoughts?
Thanks.
Spx500forecast

Is SPX500 short now?If the price will break 3215 we will change on a short view.
If that, 3157 will be a good level (Gann Angle) to test the short again.
On our view, something is changing, but it's better to wait for a confirmation to definitely "think short"

SPX500 - the market will not allow everyone to earn!Good afternoon! I think many will be interested to know what is happening with the SPX500?
The graph shows the period of long accumulation of the position. And further growth.
The volumes that are currently on the market are simply impressive. It feels like squeezing money out of people creating the effect of lost profit (FOMO).
But you must not forget that there is always a hard fall behind such irrational growth. Maximum levels are indicated on the chart. Therefore, have time to sell on time if you are in a long position.
Thanks to all my subscribers and readers for your attention! 🙏
Success and profit!
Do not leave, without like, and if you liked my analytics sign up, and you definitely will not miss anything!
And if you want to learn to understand the market, make money without nerves, write me a PM!
Disclaimer:
I am not a certified trader, but I am well versed in the market and successfully trade.
I do not give entry and exit points.
I share with you my opinion and ideas, which may differ from yours.

SPX500: Bull Rally May Hold Towards 4000.Hi Traders,
Price was in the middle of an ending diagonal a couple of sessions ago, until this situation was made invalid by the breakout above 3150.00.
I am therefore looking for a five wave sequence in the higher degree wave 5, and at the moment it seems that price may rally towards 4000.
The plan is simple: keep buying every pullback and hold until price reaches 4000.
Regards
Wave Theorist

Only short on SPX500Fibonacci seems to be a Bible now. It gives us a lot of confirmation for 3172 level .
Only from that point, we'll go Long. In the meantime, we sell from resistances.

Hindenburg Omen is ON. Market might slide much lower. Last week there were perfect conditions for Hindenburg Omen indicator. Markets seems unstable at the moment, > 3% of stocks marking both new 52w highs and lows.
The Hindenburg Omen looks for a statistical deviation from the premise that under normal conditions, securities are either making new 52-week highs or 52-week lows. The abnormality would be if both were occurring at the same time. According to the Hindenburg Omen, an occurrence such as this is considered to be a harbinger of impending danger for a stock market. The signal typically occurs during an uptrend, where new highs are expected and new lows are rare, suggesting that the market is becoming nervous and indecisive, traits that often lead to a bear market.
For it to be on 4 conditions should be satisfied:
1. Number of new 52-week highs and 52-week lows in a stock market are greater than a threshold (2.2% for example).
2. Positive recent trend. Index > index
3. The McClellan Oscillator ( MCO ) is negative.
4. 52-week highs cannot be more than two times the 52-week lows.
You can read more about the indicator on Investopedia:
www.investopedia.com

S&P H4 the price have gone below of up trend line.
mu support level is 3241.8. if price breaks this level I am seller in this market
long shadows, coronavirus, Trump impeachment convince me USD is going weaker
wait and see what happend

SPX500 short till 3240SPX500 started a strong bearish movement that brings the price to 3240 Area.
A retracement around 3330 is possible.

#SPY $SPX500 #SP500 catching the Top, any Bears alive?Hello My fellow Bears, so before I share my thoughts I want to just tell you that shorting the SP500 was not a good Idea.
Major Uptrend Longest Bullrun in History, Fed pumping liquidity , Stock Majors Buyback Excess and Trump Tweets.
And by the way the Oval Office released a note that there will be a 11 am EST an Pressmeeting - just right about the overnight time when Major Index began showing some Weakness - Coincidence or do we see a new "Stockrocket All Time high" Tweet by Trump Today?
I was able to get my Short Position on the SP500 right after the Overnight Break, with a very tight Stop Loss just to be protected against any irrational Market Move caused by some Tweet.
My Key Area was the SP500 Trading around 3330 and how it will behave around there.
So what is the Pirce doing on 4H timeframe
Still Above 50 EMA
Still above 200 EMA
4H Stochastic pointing down
lower high on the RSI while price is making higher highs
Targets
50 EMA (green)(if it Holds the price this will probably move again up)
100 EMA (purple)
200 EMA (red) this is my First Major Target if this Short plays out (Probably i am going to close the half Position there, it all depends how we would or could arrive there, if we overshoot with this Pullback I would set my Stoploss into a Take Profit right Above the 200 SMA and let it run.
Target Area Explanation
If the SP500 would Pull Back from 3330 Area it would target next Support Zones and would be still in a Major Uptrend.
0.236 Fib Retracement vicinity
200 EMA and 200 SMA on the 4H Timeframe for Support
lower Rising Trendline from the rising Channel for Support
Market could retest the 3200 Area were we had some Volatility at the Start of January.
So if you are holding a Short or having thoughts about opening one, just be prepared to watch these key Levels.
Happy Bull-Hunting and Trade Safe.

SPX --Short the Madness for correction TVC:SPX TVC:SPX TVC:SPX
This could very well just keep on going, but imo its time for some correction first

SPX 2020 Prediction, to start the year off weak! Then 3400?We just ended a decade and a wild ride for 2019 having risen nearly 30%. From here many investors and traders may assume that there will be a strong move lower because prices can't go up forever. Normally, however, after such a strong gain, markets have the tendency to continue to rise the following year.
That doesn't mean we can't see a pullback and that is what we expect at the beginning of 2020. After having risen so much in the last two months, green week after green week volume started to thin out at the top as the big-money left for the holidays. Meaning there could be profit-taking come January.
What happened in 2019?
-The Fed Cut rates 3 times, providing cheaper borrowing so big money took advantage of it and flooded the markets
-The Fed implemented a secret QE4, pumping USD into the economy
-The Trade deal has had great progression, looking to sign Phase 1 (To be signed of January 15th)
-Stock buybacks over $700B which caused artificial valuation of equities
So what do we expect in 2020? A slight pullback to start the year from profit-taking, we just hit a 1.5 Fib expansion level where price failed the first time recently. The expected pullback before the continued move is the previous broken high at first at 3155 which is about 2.95% of a pullback. The ultimate level we're watching for is the 3100-3105 where the impulse for the move higher had begun, that is a 4.3-4.4% pullback from the current price. From there price has the opportunity to make a move up to 3350-3400. However the drop has to be on low volume if traders are to be excited about the upside.
This idea is for educational purposes only, this does not constitute trading or investment advice. TRADEPRO Academy is not responsible for any market activity.

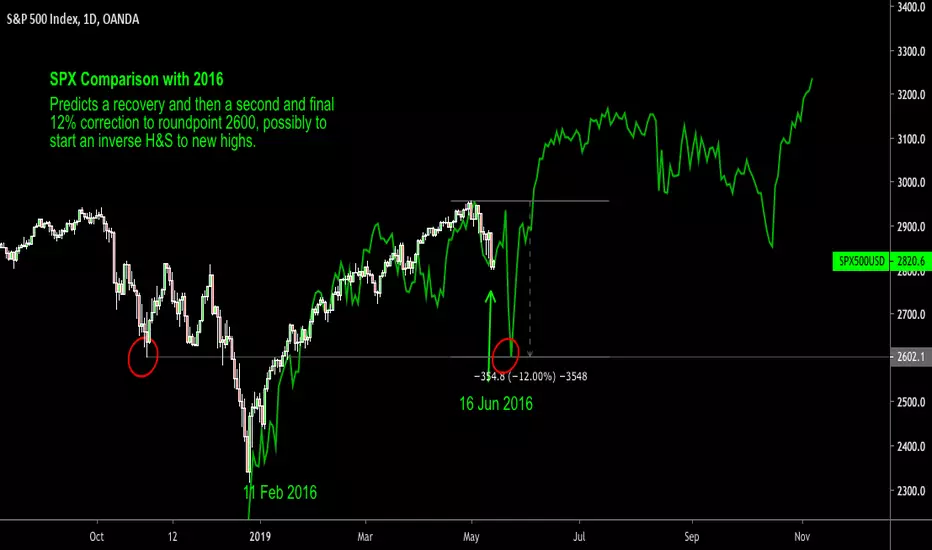
SPX Comparison with 2016Predicts a recovery and then a second and final 12% correction to roundpoint 2600, possibly to start an inverse H&S to new highs. Also fits my 2012 comparison.
ridethepig | SPX Market Commentary 2019.13.12An end of year update for US Equities with valuation targets at 3240/54 I am tracking for an overshoot into the 3200 handle to sell into. For those tracking the current flows, the most important chart I have been showing to all clients is the 2s 5s curve:
The major top in USD will help for a few months at most, as soon as we enter into the next chapter in the economic cycle it will be too little too late. With tail risks making positioning very tricky, here we have a very good macro chart showing the high bar for any growth shock and how it weighs heavy on risk appetite.
All year long expectations around monetary policy easing have been in the driving seat while geopolitics shouts loudly from the sidelines. The protectionism we are seeing is already starting to show effects on global growth and with a soft backdrop the exposure to these shocks enhance.
Rotation is in full swing as we see large large hands move from equities to bonds, and from higher risk credit to lower risk, we naturally are seeing a rotation from cyclicals to defensives and finally into safe havens like Gold, Yen and Swiss Franc to a lesser extent.
The map is clear that we are still yet to have a relative breakout in Cyclicals vs defensives as shown below:
With Yields miles ahead of the moves lately we are approaching a major breakout in US banks, a relative breakout here of the downtrend will be significant going into year-end.
On the FX side, USD devaluation will help and yields finding a floor indicate smart money is turning the titanic. It should now be a matter of 'when' rather than 'if' Utilities are going to breakout assuming we do not get any major updates on the impeachment front. Defensives still look relatively strong, despite technical patterns starting to top in things like Consumer Staples:
Lastly the infamous Long Term Consumer Staples Chart:
Thanks all for supporting these ideas with likes and jumping into the conversation with your ideas and charts in the comments. Good luck those trading US Equities into year-end and positioning for 2020, we will update the chart as we go through the coming weeks with a technical dissection of 2020 flows and targets.

SPX500 selloff PENDING to 3070 *history repeats itself* MID-LONG WHEN IN DOUBT, ZOOM OUT!
ON the SHORTSELL we're looking at possibility 1-2 (maybe even 3 ATHs on SPX500 index) to follow suit -- a consolidation in what is/will be a a continuation of this bullish priceaction we've been seeing; the same I've been calling for since the start of Q4 yet we are almost at the apex, the mountaintop is approaching which will *(presumably after the holidays)* lead to further bullish priceaction followed by a selloff treading us down toward the $3070.5 area, a bearish dump which should approach fast & furiously if the pink trendline from DEC '17 is any indication, we're seeing a repetition in priceaction that will ultimately lead to a retracement -- though keeping it on the EMA for you forex swing traders , SPX500 has had an UNDOUBTEDLY FANTASTIC RUN THE PAST 2-3 QUARTERS, FOR ALL OF 2019! yet all good things must come to an end.
Remember this publication is LONG so although the slope between the green TP line & current price seems miniscule, it could actually take a while (pointless to speculate timeframe) but >30D before it reaches that apex leading us to the selloff @ 3070.5
Great thing about stock predictions is that much less volatility == much more predictability == much less $ROI due to lower risk/low reward.
Like riding a bike with training wheels on flat terrain as opposed to riding a mountain bike on gear 10 up everest (forex trading wallst vs forex trading @coinmarketcal)
This could very well be fantastic news for $crypto priceaction as (much similar to all other commodities) it parallels precious metals, XAU, etc. as a means of FUD for those looking to liquidate assets in times of speculative uncertainty aka FUD. I'll leave it at that for now. Also, $BNB priceaction looking solid for entry (defer to linked publication below) but I digress.
Peace & Love.
Happy Holidays & New Years -- will follow up with daily publications (as promised) after the Holidays circa Jan 10-12th.
Disclaimer
Not financial Advise. Please invest wisely & always set stop-losses.
-@a1mTarabichi

S&P 500: Santa Claus RallyHello everybody!
PrimeXBT is here again with another technical analysis breakdown, and today we are taking a look at Standard and Poor's 500 Index.
News and Fundamental Analysis:
While the Asian markets are currently subdued, Wall Street is caught within a firm and unwavering uptrend.
The S&P 500 hit a sixth consecutive high on Thursday — its longest streak since January 2018 — and it closed at a record high along with the Nasdaq and the Dow Jones.
On the other hand, investors still do not understand what is included in the “Phase 1” of the trade agreement between China and the United States.
Overall, this is a worrying sign that the US economy may be slowing down again at a time when the Fed has stopped its monetary policy softening.
It should be noted that such signals act as a leading indicator of business cycles, and therefore market players usually pay close attention to them, but not now.
Technical Analysis:
Currently, SPX is hitting strong resistance that’s coming from 1.618% Fibonacci — which is a resistance level.
The price action combined with the Relative Strength Index is staying strong, but BTC has formed a bearish divergence, which often indicates that a trend reversal is forming from bullish to bearish, and a downtrend or valuation adjustment could soon follow.
Such price action was seen in May of 2015 .
Once the price reaches the resistance level, a rejection could cause a fall to 1.272% Fibonacci which is our support level.
Support level: 3100
Resistance level: 3300
Day's range: 3192.3 — 3205.5
Be careful though, don't forget about capital & risk management.
Keep an eye out for more PrimeXBT trading signals for SPX and other assets.

Doomsday is coming-- Santa Rally getting crowded OANDA:SPX500USD OANDA:SPX500USD
Wait for strong sell to start to enter in the trade, the mad bull creating a fake delusion in market trapping lots of buyers on top


Potential S&P 500 ScenarioIt's been a while since I shared anything like this... most of the last few things were experimental historical models...
This is all based in Fibonacci, both price and time... this would have us peaking at about 3450 around late September 2020...
Though I don't have the count posted with it, it is based in Elliott Wave as well...
The EW concept here is an extended wave 1, with 3 being 0.786 of 1 and 5 being 0.786 of 3 - which leads to waves 3+5 equaling wave 1 (typical when 1 is extended)...
Just thought I'd share what I was looking at

SPX500: Further Upside Expected - RSI Shows Strong Bull MomentumHi Traders,
I was initially expecting price to form an ending diagonal, thereby slowing down the bull trend for downside. However the ending diagonal is now invalid because price has slightly broken out of the structure in the past week. What's more is that we have no divergence on the RSI, and this indicates further upside.
Therefore, we can keep buying the pullbacks until price shows signs of slowing down.
Regards,
Wave Theorist

SPX500 LONG SNIPER ENTRYBUY SPX500
Entry 1 3076
Entry 2 3079
Sl 3070
Tp.1 3086
Tp.2 3108
Tp.3 3117
Tp.4 3124

SPX500 (S&P500) LongBUY SPX500
Entry 1 3089
Entry 2 3085
Sl 3082
Tp.1 3097
Tp.2 3108
Tp.3 3117
Tp.4 3124

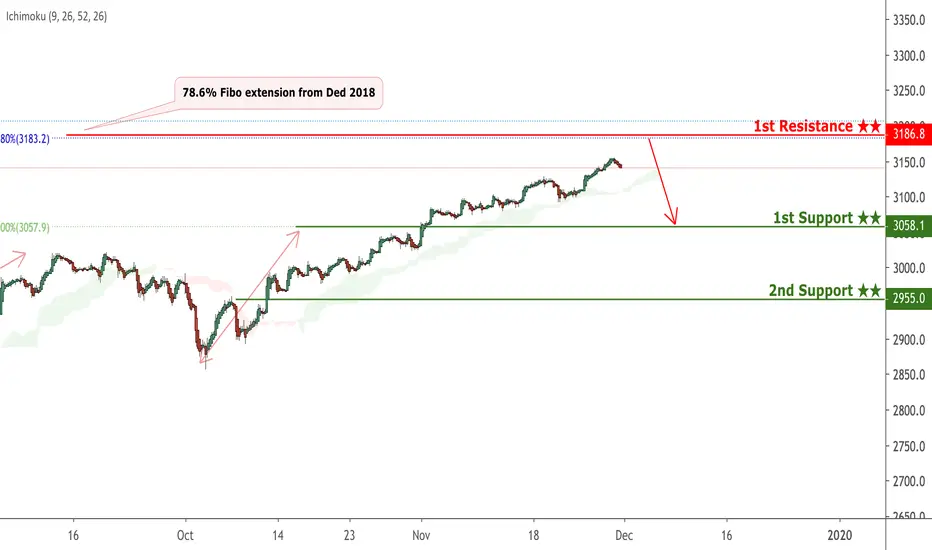
SPX potential reversal!
SPX expected to rise up to 1st resistance at 3186.8 where it could potentially react off and drop down to 1st support at 3058.1.
Trading CFDs on margin carries high risk.
Losses can exceed the initial investment so please ensure you fully
understand the risks.
This is why the SPX is overdue for at least a 2.50% pullbackThe equity markets in the US have been moving really well through highs like its nobody's business, however as they continuously progress the moves get shorter and the pullbacks non-existent. Recent a 1.5-2 year wedge in formation was broken to the upside which indicates a bull trend continuation. Usually, the pop above the broken resistance will revert at least temporarily to the broken level before moving higher. This isn't a crash and recession call to all-time lows rather an opportunity to identify a potential retrace before a larger pop.
The facts are, the volume on this whole break higher has been terribly low, no one wants to buy a market at all-time highs and no one wants to sell because they want more profit.
Its been 2 months with just 1 red week and that red week was insignificant. The pullback brings the price down to the wedge break and previous highs at least 2.50% lower than the price right now. From there, there will be 2 catalysts that bring price higher.
1. A lot of big money is waiting for an "in" on the long side of the market and when deemed cheap enough will bid up the market by strong buying.
2. The Fed is still pumping A LOT of money into the economy at abysmally low rates.
