SPX Breaking record for broken recordsI thought I’d include a little oped and some political analysis seeing as how that is part of my expertise & biggest passions.
This publication was intended to be made at the start of the market open but I got wrapped up in this circus called life; C’est La Vie.
The SPX 500 index is shattering all analysts expectations as Trump did say we would ”Win BIGLY!...winning so often that we‘d get tired of winning!” , and in doing so while both hands tied behind his back is a PHENOMENAL (and truly ironic; in the sense that they want to impeach him.) ahead of the systemic breakdown of the deep state.
I truly detest that conspiratorial connotations attached to that entity, what else do you call a cabal of unelected officials (mostly Obama holdovers) in the highest levels and upper echelons or our government literally conspiring with the legacy media in cahoots with big tech and the propaganda engine that is:
Jeff squared (Zucker/Bezos) & lets not forget to give a shoutout to
Media Matters
Tom Steyer for letting their hatred of one New York businessman/real estate tycoon be substantially greater than their love or our constitutional democratic republic—
-as the slow moving coup commences to unseat a duly elected official , WallSt once again slaps Adam “Schifty” Schiff & Nancy “Powerless” Pelosi right across the race with the metaphorical equivalent of political chess mate with milestone after historic achievement after milestone after historic achievement..
•.Kim summit
• Energy sufficiency
• >2 Dozen NASDAQ ATHs
• ROARING economy in an otherwise unsettled and anxious; polarized social environment despite 401(K)s and wage growth
• Not to mention historic unemployment and
• Only President to fulfill every campaign promise in modern history..
• Defeated caliphate and Baghdadi
The list could go on... I’ll include a more in depth, meticulously written oped when I get on my PC (yes I’m on my mobile phone right now) including and especially pertaining to the modern history from the start of the postmodern era and why it is quintessential for traders to understand modern history (From post World War II era 1945 is a solid place to start) and how it is literally The combination of the series of events that took place Between 1939 to 1945 where America was ranked 17 out of 17 in terms of military my versus just six short years later leaving 2 empires and Europe in ashes as the Phoenix and Not only military but economic powerhouse has been us ever since, a fact l I think is often overlooked/undermined (our economic leadership and not just military)
Now with an unstoppable economic track record; SPX is clearly flourishing.
When all is said and done history will remember President Trump has all of the most consequential POTUS in history...believe me I was never a fan (at first) however I am a patriotic objective and pragmatic individual (unlike our elected officials) and when I see something that is good for the nation, regardless of the uncalibrated moral compass of the POTUS in question — he is still our commander-in-chief and it’s funny because i travel very frequently and often hear dnc hacksn in the legacy media say that the world is laughing at us because of his behavior; from my experience this is a falsehood....
Most of the people that I talk to would wish they had a president as fervently dedicated to putting nationalistic policy agendas in motion—- “ America First” and their nations respect his unapologetic, magnanimous persona.... but I digress.
I will update more later...
In the meantime I will proceed with more signals! I have been slacking as of late and for that I am double sorry.
Follow / like / share / subscribe if you want to hear more from me about Political science and consumer based sociology, modern history and current events.
@a1mTarabichi
I apologize for the almost 4 H late publication!!
You know what they say...
Better late than never but never late is better..
Spx500forecast

SPXUSD SHORT (S&P500)SPXUSD(S&P500) SELL
ENTRY 1 3072
Entry 2 3074
SL 3077.19
TP.1 3064
TP.2 3058
Tp.3 3054.50
Tp.4 3047

SPX500 SHORTS&P500 sell
Entry 1 3061
Entry 2 3063
SL 3066.30
TP.1 3054
Tp.2 3048
Tp.3 3040
Tp.4 3033

S&P500 (SPX) SHORTS&P500 sell
Entry 1 3048.50
Entry 2 3051
Sl 3054.79
Tp.1 3043.50
Tp.2 3037
Tp.3 3033.50
Tp.4 3025

SPX500 SHORT STRATEGYI see an opportunity at this chart since the resistance at the 3020 has been really strong the past 4 months. Also, this is the highest price the SPX500 has been in history, so it has to go down at least a few more times before it goes up. Looking forward to this easy trade.

S&P500 long opportunity approaching S&P500 should short to around 2951-2948 where we will look for a long entry
buy limit
entry 1 $2951
entry 2 $2948
sl 2941.39
Tp.1 2958
Tp.2 2966
Tp.3 2974
tp.4 2980

SPY: Intraday Timeframe Analysis and Bearish Bias.Conclusion for today’s SPY analysis: A break below ~284.93 implies continuation of bearish trend.
The 1 hour timeframe of the S&P 500’s ETF (SPY) is presented in today’s analysis with main focus placed on chart patterns that are currently active.The uptrend in the SPY from its December 24, 2018 low to its July 29 peak has been followed ever since by sideways market action.
Evidence of the ranging environment is provided by the horizontal blue lines that capture the meandering price action in the SPY since July 26, 2019.Besides, a wedge or diagonal chart pattern is also shown for the SPY as the alternative chart pattern that is active. October 2, 2019 saw price close outside the lower boundary of the wedge (i.e. confirmation) that suggests lower price to follow.
Meanwhile, the breakout below the lower boundary is still contained inside of the ranging environment that has lasted over 2 months. A rectangle top formation would be appropriate to describe the sideways movement which opens the possibility for the SPY to reach its lower boundary (i.e. ~282) as a minimum expectation.
Also plotted on the 1 hour timeframe chart is the 200 moving average. A retracement to the average and lack of a price close above it also carries bearish consequences for the SPY.
Price breaking below ~284 and also the lower boundary of the rectangle top formation could see price return to the origin of the wedge at ~273


S&P 500: What will a recession be like if it comes?I'm going a little crazy now. That's the long-long-long... term trading plan from today's point of view.
Pure speculation, nobody can really predict the future, but such a course of an upcoming recession - if one should actually come - seems most likely to me.

The S&P 500 is likely to make a decision before the weekendJust to share the daily update on the S&P 500.
For two days now it has been more or less treading water. It can't do it forever.
What's next? I expect it to make a decision before the week's close. We'll see. Take care!

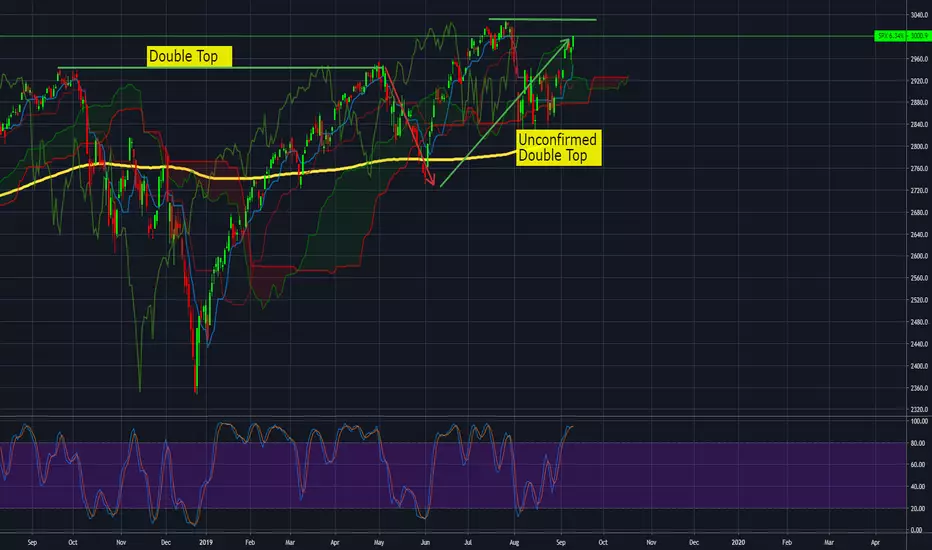
#SP500 INDEX, On the way to breaking an all-time record?We have had Unconfirmed Double Top for the past few months.
Very bullish trend.
The Sp500 is on the way to test resistance at 3032 (an all-time record).
You can still buy and see that the sp500 crosses the resistance if the failure fails then it is worth thinking about a re-route.
Target: $ 3100

SPX has completed bearish BAT | A good short oppottunityThe priceline of S&P 500 Index has completed a bearish BAT pattern and entered in potential reversal zone.
Regards,
Atif Akbar (moon333)


Long S&P500: March higher will likely continue for months to comS&P500 has now broken decisively to new highs. With most of the major central banks determined to ease at any sign of economic slowdown, the march higher will likely continue for months to come.


Elliott Wave View: S&P 500 (SPX) Remains Buy in the DipsS&P 500 (SPX) shows a bullish sequence from December 26, 2018 low against June 3, 2019 low (2728.81) favoring further upside. Short term Elliott Wave view suggests the rally from June 13, 2019 low (2874.68) is unfolding as a leading diagonal Elliott Wave structure. Leading diagonal is a special type of 5 waves structure with a wedge like pattern and overlapping wave (i) and (iv). Up from June 13 low, wave (i) ended at 2964.15 and wave (ii) ended at 2912.99. Index then resumes higher in wave (iii) towards 2995.84 and wave (iv) pullback ended at 2963.44.
Expect SPX to do 1 more push higher to end wave (v) and this move also end wave ((i)). Afterwards, Index should pullback within wave ((ii)) to correct cycle from June 13 low before the rally resumes. Wave ((ii)) pullback should unfold in the sequence of 3, 7, or 11 swing. We don’t like selling the Index and expect Index to continue finding support in pullback. As far as pivot at June 13 low (2874.68) stays intact in the first degree, expect Index to extend higher. If pivot at June 13 low fails, then Index is correcting cycle from June 3 low (2728.81), and still expected to resume higher while above there.

US 500 (SPX/USD), The price bounced from key level 3000.0The price bounced from round number key level 3000.0 and we can open sell after pull back to 2995.0 - 2990.0.

SPX500 // Outlook // June 2019$SP500
Mid // Longterm Outlook
Bearish Momemtum continues within the stock market // Indices.
We are looking for the scenario below to occur within the Mid to Longterm for the SP500.
Confluence within this area being //
- 0.5 Fib retracement via our entire Rally
- Daily Demand
- 200 EMA Support
I will be a short term bull once we enter the 2635 range. Short term bull via stocks and indices // Until then we will be looking shorts next week.


SPX reversed from resistance, potential drop!
SPX reversed off its resistance at 2956.1 where it could potentially drop further to 2723.5.
Trading CFDs on margin carries high risk.
Losses can exceed the initial investment so please ensure you fully
understand the risks.

SPX reversed from resistance, potential drop!SPX reversed off its resistance at 2956.1 where it could potentially drop further to .2723.5
Trading CFDs on margin carries high risk.
Losses can exceed the initial investment so please ensure you fully
understand the risks.
