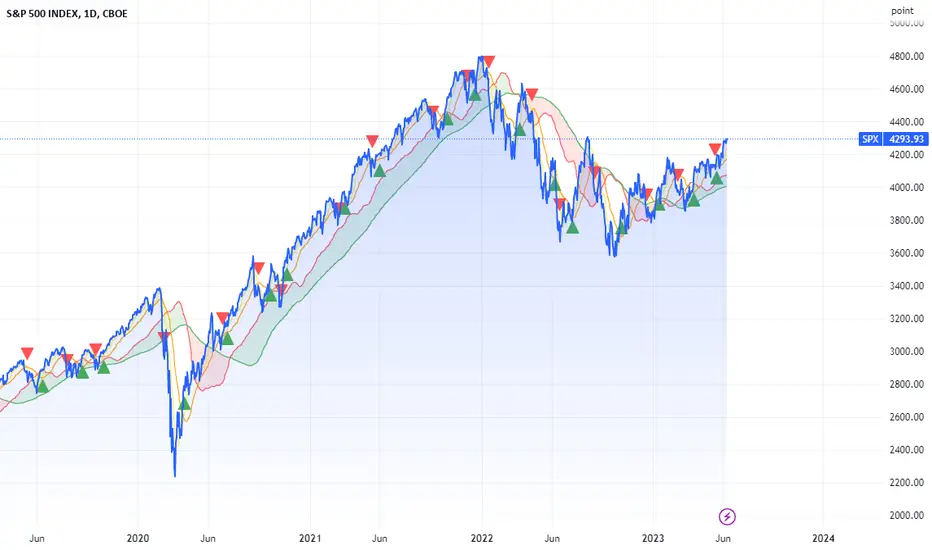
SPX at major and important resistant Area SPX Reached the major Resistance Area ( the one that start the last bear market )
4600 IS A VERY CRITICAL area because all the target for the current movement has been reached.
the Market start the trend at 44° then become overheated and reached almost 72°
from my point of View the market need to cooldown in order to extend a healthy movement
the best option is to reaccumulate 4080 Area
the good news is every ware at he moment so be carful and activate your stop lose Level to protect your gain from any shakeout movement.
Spx500forecast

Bing Short on SPX in progressIn my previous post on SPX ( link attached below the description ), I explained how we are going to see a rejection on this uptrend soon and we beginning to see that now.
In this post I will explain how I am playing this short setup.
In the previous post I had a pitchfork. I simplified it with three parallel channels, one larger and two inside it in its upper and lower half so we now have four rising trendlines which will be our point of interest when Price Gets there.
In the image below I have highlighted the properties of these trend lines based on past price action within the channel, which you can observe yourself.
I have indicated three take profit levels on the main chart. I don't think TP1 would be necessary as I don't expect the trendline to hold based on its past behavior.
TP2 and TP3 are my main targets, which is where I will look for signs of a nice bounce back up.
If you observe the channel, we have never really resumed a trend back up without creating a double bottom on the one of the lower two trendline in the chart as highlighted in the image below, if that happens, we resume the uptrend to new highs. That's when you take a swing long position on SPX.
On the other side if TP3 doesn't hold we are looking at a potential change of trend a macro scale, but I won't give up on the upside just after the break as we could possibly see deviation and bounce back in the channel after testing the support area as highlighted in the main chart.
What happens if we lose 4300 level, we go way down, I will leave that detailed analysis for another post.

SPx500 4H SPx
stabilizing above 4561 will support rising to touch 4565 then 4569 then 4576
stabilizing under 4561 will support falling to touch 4552 and then 4547
Pivot Price: 4561
Resistance prices: 4565 & 4569 & 4576
Support prices: 4552& 4547& 4537
timeframe: 4H

SPX500 Next MovePair : SPX500 Index
Description :
Bullish Channel as an Correction in STF and LTF
Divergence - RSI
Break of Structure
Completed " 12345 " Impulsive Wave and " ABC " Correction
Consolidation Phase

SP500 Bearish ScenarioThe #SP500 diverged 61% from the trend it had referenced since 1940.
When we look at such divergences in history, we see that the index has returned to the reference trend.
The beginning of this reversal is usually confirmed by a close below the SMA9 on the 3-month timeframe. This level is currently displayed as $4174.
In a possible bear scenario, EMA60 or $2651 will guide us for the priority return level. Finally, EMA120, which is already at the same level as the reference trend level, will act as the last support.
In addition, looking at the SP500 index in the daily time frame, the McClellan Oscillator, which has been working very successfully since 1900s, turned negative last week.
However, another factor that can contribute to my analysis is that the monetary and fiscal policies made by HSBC today are not compatible with the bond and stock markets, and that the current recession will go further.

SPX 500 Analysis(Rising Wedge Pattern)!SPX 500 Analysis on Weekly Timeframe!
Rising Wedge Pattern in SPX500
Rising Wedge Pattern Formation after a Strong Downtrend
SPX500 was in downtrend before now we are seeing a temporary uptrend but if we observe carefully it is an unstructured uptrend, for trend reversal it has to break 4323.56 level. Now SPX500 has formed a Rising Wedge Pattern. This pattern formation happened after a long down move. Now SPX500 is taking a pause and trading inside a wedge. If SPX500 able to break Support Trendline then the Primary trend will continue which is a Downtrend. I have done all important Analysis on the chart. I hope this will help you to forecast the further direction of SPX500.

SPX500 Next Possible movePair : SPX500 Index
Description :
Rising Wedge as an Correction in Long Time Frame
Consolidation Phase
S / R Level
Bullish Channel
Break of Structure
RSI - Divergence

SPX medium term pathwayThis update will be quick, Im very lazy this weekend.
ES short term was already posted earlier today.
There are 2 pathways Im following:
1 - H&S pattern, visible on the chart. That pattern if triggered will make full 5 down into early next year low to finish the whole move down from Jan high.
(Fits perfectly with VIX sky rocket from its below 20 level)
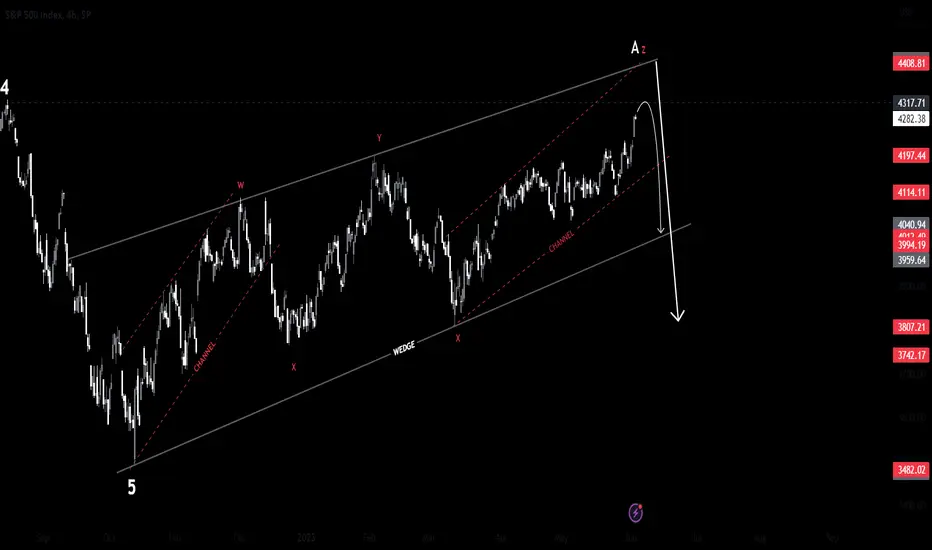
2 - Finishing the C wave up with A being over and B about to start.
Im still looking for 3750 level being hit to close the gap and one more rally over 4200 from there.
This scenario should play out quick or I will take it off the list if B is not reached by mid Dec.
Then a good rally into Jan high above 4200, check the number of the C ending on the chart.
Fibs align perfectly with this pathway!
We have a full Moon on Dec 8th, usually markets tend to make a high or a low at or around the full Moon.
It seems we are going to get one here early next week.
My best pathway is down to 4k tomorrow and rally from there into Tuesday high. There is a huge SPY put wall at 400 for tomorrow, Im sure it will hold on any test tomorrow, so if tested it will be a perfect long entry with a 15-20 points stop.
Or if 4k is broken then we should see 3940-50SPX zone tested which is the strongest support for the whole bull move here, should hold on at least 2 tests imo.
Also VP (volume Profile) line is around 3960SPX level, a perfect magnet.
So my next week game plan is - buy tomorrow low, sell Tuesday high (might stretch to Wed am high), then down we go into a rabbit hole with ideal target at 3745-50SPX.
Main bear bull support line is at 3940-50SPX level for the next week! Below it and this move up is over and the price will retrace back to 3750.
Have a very profitable week!

SPX Must hold 3970 tomorrow am or its goneAs you can see there is a lot of confluence at 3970 level (This chart become quite busy with the trendlines)
If we do gap down tomorrow below 3970, I will be looking to buy 3928-39SPX level for a broken trendline test, if not more.
This chart is similar to the ES, but has a higher level of support, so they have a bit different short term look one from another to my eyes, but the main picture is the same.
I really dont have much of a support if 3890-3910.50 is gone till 3744SPX!
So it better hold that level and ideally the 3928-39SPX support box.
Same as the ES, SPX has its trading cycles bearish now, expect short the rips all the way till the 19th of Dec!
Have a good night

Is there stock market drop based on around SPX possible? As we have all seen, the stock market has been on a steady rise for some time now, but I fear that we may be on the brink of a significant drop.
There are several reasons for my concern. While governments and central banks have taken measures to mitigate the effects of this past pandemic disruption, the long-term impact on the economy is still uncertain.
Secondly, we are seeing signs of overvaluation in many sectors of the market. Companies that are not yet profitable are seeing their stock prices soar, and the valuations of some of the largest tech companies are reaching levels that are difficult to justify.
Finally, we are seeing a significant increase in market volatility, with large swings in both directions becoming more common. This volatility is a clear sign that investors are becoming increasingly uncertain about the future of the market.
Given these factors, I believe it is important for traders to be wary of the current stock market rally. While it is always difficult to predict the future, I believe that the risks of a significant market drop are high.
As such, I encourage you to be cautious in your trading decisions and to consider taking steps to protect your investments. This could include diversifying your portfolio, investing in defensive sectors, or even reducing your exposure to the market altogether.
In conclusion, I urge you to take these warnings seriously and to be prepared for the possibility of a significant market drop. While I hope my concerns are unfounded, I believe it is better to be safe than sorry.
SPX500 Next MovePair : SPX500
Description :
Completed : Impulsive Wave " 12345 " and Corrective Wave " A ( 12345 ) " Corrective Wave
Impulse Correction
RSI - Divergence
Break of Structure
Bullish Channel in STF as an Corrective Pattern
Consolidation Phase
S / R Level

SPX500 New Week Possible MovePair : SPX500 Index
Description :
Bullish Channel in Short Time Frame and Long Time Frame as an Corrective Pattern
Break of Structure
RSI - Divergence
SMC - CHOCH
Completed " 12345 " Impulsive Waves
Fibonacci Level - 38.20%
💥 S&P 500 INDEX SPX 1D-TIMEFRAME💥 S&P 500 INDEX SPX 1D-TIMEFRAME ANALYSIS
💗Hello ladies and gentlemen
This is my new idea for 💥💥 S&P 500 INDEX SPX
I hope my idea is clear
Support me by like and share thank you
Stay Safe💯💲💲💲
Good luck💰😍

💥SPX 4H-TIMEFRAME ANALYSIS💥 S&P 500 INDEX SPX 4H-TIMEFRAME ANALYSIS
💗Hello ladies and gentlemen
This is my new idea for 💥S&P 500 INDEX
I hope my idea is clear
Support me by like and share thank you
Stay Safe💯💲💲💲
Good luck💰😍

SPX500 Index Next MovePair : S&P 500 Index
Description :
Impulse Correction
Completed " 12345 " Impulsive and " abc " Corrective Wave
Divergence
Break of Structure
Falling Wedge
Consolidation
Bullish Channel in Long Time Frame as an Correction

Big Short On SPX500 According to the US30 analysis, the price of spx500 can also have a down trend in the long term

ATTENTION: S&P 500 - Medium Term Right Side is DOWNTechnical Analysis:
- S&P is going to finish wave ((B)) in black in the next 2-4 weeks
- Short Term Right Side (H4) is turning up
- Medium Term Right Side is down to complete a wave II in red
Technical Information:
- Don't buy now S&P if you're a swing trader
- If you're a position trader please wait for wave II in red to be completed

Inverse H & S on Weekly SPX Analysis We are nearing an important event tomorrow where we will come to know about Fed funds rates and FOMC guidance for upcoming months. These events are known for creating extreme volatility. We can easily swing up and down 100- 150 points on days like these and set in motion what's to come for the next few months.
No matter how big of a volatile move we will see tomorrow in the price action, it will be a small blip on a larger timeframe and that's what we are here to analyze.
On weekly Time frame I am looking at this inverse Head and Shoulders pattern.
Let's analyze this structure based on RSI indicator.
In the main chart we can see that, since the time inverse H & S began to form, the RSI has been trading in a Rising wedge formation which is a bearish pattern. Every time we touch the top edge of the wedge, we have been getting a rejection on RSI and big move down in SPX. In the begenning of the structure and RSI we got huge moves to the downside, but those moves have been getting smaller and smaller both in RSI and Price Action. This is called compression
which is followed by explosive moves once the pattern is broken.
Last week we again got a rejection from the top edge of the wedge and have begun to move down, I have placed the measurements on the chart about how much we have been dropping every time we touch top edge of the wedge on RSI and based on the patterns in price drop and how much time it took to drop to the lower edge. We can expect a drop of about 5+ % from the current top and reach there in the next 2 to 3 weeks.
Now once we have reached there RSI will have to decide whether to bounce back up or finally break the pattern. The break to the downside has descent chances of happening as per the Rising wedge pattern rules where it says the pattern break occurs in last 33% of the structure and it looks like we should be there by end of this month. If it does break below the inverse H & S pattern will fail.
The best way to protect you from entering wrong trades : is to never be too sure about any analysis and always consider all possibilities. Following are the possibilities I see with RSI which can make or break the structure:
We must monitor all the trendlines in RSI and see what PA is doing, it may not go all the way down and bounce back up from one of the trendlines in the middle.
The following are all scenarios I am watching for the movement of RSI.
I used a simple but powerful RSI indicator to gain insight on SPX Price action. If you are not familiar with this indicator, or if you have basic understanding but want to fully understand this indicator in detail: You can ago through the post in the links below:
I have over 6 years of trading and investing experience and have learned a lot in this time. I like to share what I have learned and if you like my content and would like to learn from my experience hit like and follow me for getting notified on my trade, market projections and several upcoming tutorials on technical analysis and several technical Indicators. You can also leave a comment and let me know if you want me to analyze any specific asset or want to learn about any specific topic in the world of Technical Analysis. I Will do my best to create a post for it.
Keep learning and Happy trading All.

SPX 500 New IdeaPair : SPX500 Index
Description :
EXP Fiat in Long Time Frame as an Corrective Pattern and Completed " ABC " Corrective Wave
Divergence
Break of structure
Completed " 1234 " Impulsive Wave
EXP Fiat STF
CHOCH - SMC

s&p500 target 4600After 5 wave decline in a limited downside triangle ,the trend reversed @ 3491 on 10th Oct'23
the reversal is a Zigzag 3 wave up move, where wave B is completed today after a BO rally and retest of upper trend line of Exp Triangle.
its time to start next wave 'C' from today 10th march.
buying is a good opportunity for a month or more having a target of 4600
lets enjoy trading with known entry point &targets thanks to the great R.N.Elliott & Glen neely

CHOCH!1. Is seems like a CHoCH has already happened! And it will go lower from here!
If that happened, and we didn’t catch entry! Wait for ritracements or BOS
2. Or might visit the Hight before going lower! Which I would love it will happen next week!

SPX is overvalued and risk while DAX outperformsThe SPX or the S&P 500 appears to be overvalued according to this critical red line in the Fibonacci levels, Fibonacci. With potentially deteriorating market conditions, many have left the stock markets globally to park their money .in safer assets like money markets. Most investors are getting better performance because of higher interest rates than taking risks in the stock market. I have lost all confidence in trading in the stock market currently due to higher volatile pricing action. Is there a significant calamity on the way? There are better-producing stock markets internationally out there, including Germany.

SP500 Gann Square AnalysisThe SP500 index, which is in a downtrend in the long term, tries the trend many times. If the trend is broken, it will target the next trend follower level of $4400. If it is rejected from the trend, it must hold on to the arc.
