SPX500 Wait For Breakout!!
SPX500 is trading in a rising wedge
But sp500 is stuck below
The horizontal resistance at 3870.76
And the bullish breakout has failed
So IF we see a bearish breakout
Of the rising wedge
Then I believe Will go down
Spx500idea

SPX500 SELL IDEA - 10.12.22They took out Monday's highs from the beginning of this week already and we still have that low intact -- so I'm going along with the trend and selling and targetting those two lows we have below.. lets see what we get.
I targeted that FVG + BREAKER as the entry which is why I entered there.. We also tapped into 0.705 perfectly which was nice to see. wicked it and the bodies closed at the 0.618. My target is 3571.75.

S&P500 | Spx500like i had said in the last Analysis will see Spx500 Go Bullish and reach 3920 probably by next week

SPX500 Risky Lnog !!SPX500 was trading in a downtrend
Along the falling resistance line
But then we saw a bullish breakout
And a pullback to retest the broken level
So I am locally bullish biased

S&P500 The down Market has gone on a halt now price is going up if price breaks 3725 will see price move all the way to 3920 so prepare buys and get ready for some bullish momentum

SPX500 Entries + Exits for FREE (Best Reverse Strat)My forex course regarding my strategy in full is now AVAILABLE!
All likes/comments and feedback are very much appreciated!
How to play my chart:
Buy at support, sell at resistance. When you open this chart you'll see a green entry and a red entry. When the candlestick hits the green entry, you place a buy. If however that support buy doesn't go into profit and goes negative -35 or -60 pips (depending if it was a fast break/or if the break landed on a minute 15 zone), if it breaks you would then exit your buy and immediately enter the sell. You would then ride that sell down to green TP1, or you could then repeat and play the buy/break there.
The same exact thing goes for resistance sell/break plays!

SPX500 Breakout Short!SPX500 was trading in an uptrend
Along the rising support
But now we are seeing a bearish breakout
Of the support confluence
Which is now a resistance cluster
From where a further move down
It to be expected After retesting an area 3908.77

SPXSPX Look how interesting. After this crisis that we are experiencing with the corona virus, several opportunities have arisen to buy assets over sold and giving a great asymmetry that is ridiculous. But, everything is not flowers, the government had to print money like never before, causing the dollar to depreciate and inflaming the consumer price index. Making it so that later (nowadays) I had to raise the interest rate. And that reflects everything on the chart. On the chart, we see a bullish continuation pattern. But for the moment he is under. It will probably only break this line when the US shows interest rate easing, causing investors to start exiting their bonds that are bad at the end and going back to equities, when this happens again, the bulls will boom and will start to dominate the market again.
Relative to this pattern on the chart it is called the descending megaphone. It tends to widen a lot when the market turns pessimistic. An example of this is the Nikkei index. It started to widen in the 1991's and only came out in 2013. And if we analyze the past, we see the pattern repeating itself again today, but not in a smaller size.

S&P500-SPX500Accurate analysis. That's an update. Based on my analysis for US500 on Aug 17.
To be Notified about the analysis, follow me and contact me if you have any comments or questions. (I will answer whenever I have time).

S&P500-SPX500The price breaks the trend on M30 according to my idea and then the price has a correction, then by rechecking the chart you can decide to trade.
Observe the money management and the stop loss, to know about Analysis, follow me And contact me if you have any comments or questions. (I will answer whenever I have time).
Wait for the update.

SPX500 OutlookHello there all,
Here's the SPX analysis outlook potential direction.
Please do let me know if you are seeing what I'm seeing or have a different perspective on it, I would love to see your analysis.
Please do drop the chart link below in the comment section.
This is not financial a advice. 🙂
Thanks all.

SPX500 Entries + Exits for FREE (Best Reverse Strat)The 1on1 video is currently out, if you would like it in order to understand how to play my analysis FULLY, please let me know privately.
All likes/comments and feedback are very much appreciated!
How to play my chart:
Buy at support, sell at resistance. When you open this chart you'll see a green entry and a red entry. When the candlestick hits the green entry, you place a buy. If however that support buy doesn't go into profit and goes negative -35 or -60 pips (depending if it was a fast break/or if the break landed on a minute 15 zone), if it breaks you would then exit your buy and immediately enter the sell. You would then ride that sell down to green TP1, or you could then repeat and play the buy/break there.
The same exact thing goes for resistance sell/break plays!

SPX500 - asteroids point to the pump marketlook at my old ideas on tv, there are many examples on space topics.
my last example is pumping 4% of the stock market on May 27, then an asteroid flew near the earth, you can see the correlation on the chart with the rest of the news about asteroids, pay attention to the cirfs, study them. More information in my old ideas

SPX500 - 22.07.2022 start mega dump🩸🩸🩸SPX500 - 22.07.2022 Start mega dump🩸🩸🩸
911/966/199/33
71/17
SIGMA
===============///////////////////

SPX500 Rising Trend TARGET !!This analysis is for 1h so it's very dangerous.
Median is good for buy.
Target :
🎯 3779.16
Stop Loss Level :
🛑 3753.95
Not Financial Advice.

SPX500 Entries + Exits for FREE (Best Reverse Strat)The 1on1 video is currently out, if you would like it in order to understand how to play my analysis FULLY, please let me know privately.
All likes/comments and feedback are very much appreciated!
How to play my chart:
Buy at support, sell at resistance. When you open this chart you'll see a green entry and a red entry. When the candlestick hits the green entry, you place a buy. If however that support buy doesn't go into profit and goes negative -35 or -60 pips (depending if it was a fast break/or if the break landed on a minute 15 zone), if it breaks you would then exit your buy and immediately enter the sell. You would then ride that sell down to green TP1, or you could then repeat and play the buy/break there.
The same exact thing goes for resistance sell/break plays!

SPX is looking for the 5th down or completing the C wave downIm not an EWT expert but this looks to me like completing the 5th down or the C wave of the bigger A wave down!
THIS IS THE BEAR MARKET!!! 6th month and rolling now. All those 5500 coo-laid smokers were destroyed 6 months straight!
Typically the bear market is lasting 2 years, I expect the maj low in Q1 next year. Its 6th onth now, so this move down should follow by a very strong rally soon (Mar like)
The FED is on Wednesday and I will not be in short or be short on that day or maybe even since Tuesday!
We closed below 3909SPX on Friday, targets 3850 or lower (warning email was send to my email list people second part of Fri).
ES already below 3855
3855 is the maj resistance now with following 3885-4k zone.
I got several targets for this move down:
- 3805-09SPX maj support
- 3765-80SPX
Some other calculations are pointing for much lower levels!
- 3665SPX level and,
- 3555!!!
Something to be open mined to. Ideally we hold 3800 handle, below is very bed!
Notes from the chart
4170-90SPX is the main resistances now
Resistance - 3855; 3885-4kSPX (must hold for continuation lower)
- Low target for tomorrow 3805-09, 3780SPX - Buy if seen in am, dont buy if we see higher first
- 3818-20SPX mid support,
- 3805-09 and then 3765-80 zone is the maj support zone
Buy zone for tomorrow with stops!
- 3805-09SPX
- 3850 and 34 must hold on any try or it falls apart (main support, not expected to get hit any time soon)
Short
- no short on the FED day or even after Tuesday
- 3855SPX and 3885-4k, no short above 4025
- Low (intraday) was on the 12th (about to get renewed);
- Long from 3855-65SPX zone (email was sent when the price was at 3867-68SPX)
Larger ABC pathway down into Oct/Nov low or more of the year is in play imo Final target in 3000-3200SPX zone
Potential 5 waves down is forming! Next mid Jun low can be lower low! Have to be careful with sizing

SPX500 Long IdeaSimple game plan, considering price action is narrowing down:
Long Order:
✔️ Entry: 4090.00
⛔ Stop: 4050.00
🤑 Profit: 4203.90
Alternative scenario would be for the price to rest on the lower trendline, slowly trending up until it does a sudden drop down. In order for the above mentioned setup to be valid, I would like to see a bounce off that level, not consolidation.

🚀🚀 S&P500 - LongThis idea i posted in my channel on Friday, i Entered at 4098 and hit my TP2 at 4167. I believe we could find another entry around this region.
Here is my analysis for S&P 500
SP:SPX
I have marked out step by step how i have come to find a long position on S&P500 .
Price has broken the previous LH and created a new HH which has BOS.
There is a key level of support around the area 4098 & has now broken the counter trendline and respected the 78.6 level.
Happy Trading Traders.

Shorts S&PDaily is a downtrend, and it has pulled back very deep. Although it has done that I still expect price to continue down overall. I think it is time for it to meet those lows again and make a new one

Spx500 Short SignalGoing short Spx as overall price bearish and got a shift on the lower timeframe. Possibly the high of the day has just been made, goodluck today!

Spx500 Short IdeaLooking for NFP news to give us a solid run above the Buyside LQ then shift on the lower TF and make it’s way to the Sellside LQ. Overall I see price reaching 4000 by end of the day. Good luck trading today!

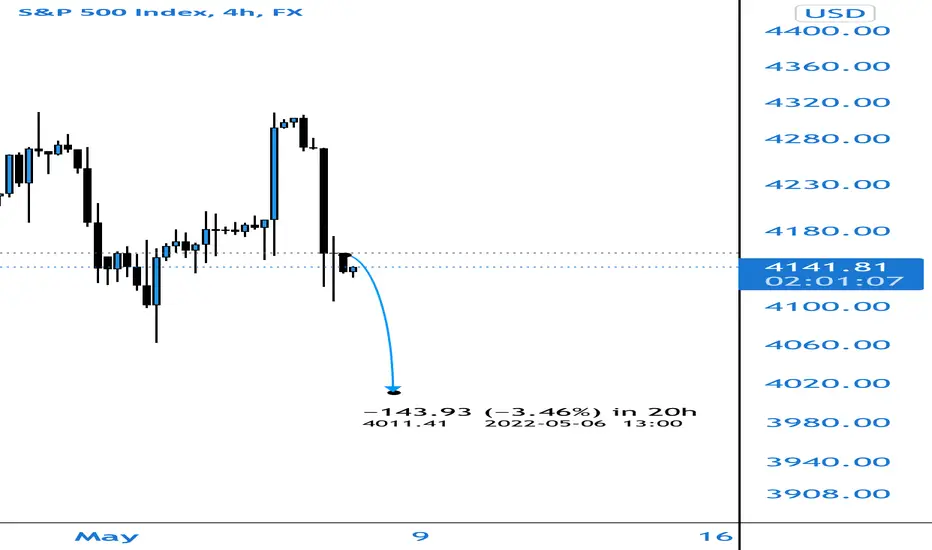
Spx500 Trade SignalPrice will go here by this time, your welcome!
Use proper risk management trading tomorrow, big news!!