S&P 500 1D-TIMEFRAME ANALYSIS✨S&P 500 1D-TIMEFRAME ANALYSIS✨
Hello ladies and gentlemen
This is my new idea for the SPX
My idea is that the index will go higher
Target
3820
I hope my idea is clear
Support me by like and share
Good luck💰💯
Spx500idea

SPX500 Making Head & Shoulders PatternMake sure you like the post if you enjoy the publication! Thanks for the support!
Price currently making a head and shoulders pattern on the 2HR. Looking to target the daily retest zone to look to possibly take a long from there next. Wait for the 2HR candle to close for confirmation. We want a doji, spinning top or a bearish candle and will enter at close immediately.

S&P 500 4H-TIMEFRAME ANALYSIS 💡S&P 500 4H-TIMEFRAME ANALYSIS 💡
Hello ladies and gentlemen
This is my new idea for the S&P 500
My idea is that SPX will continue to downtrend
Targets
3200
3070
I hope my idea is clear
Support me by like and share
Good luck 💰💯

S&P 500 4H-TIMEFRAME ANALYSIS 💡S&P 500 4H-TIMEFRAME ANALYSIS 💡
Hello ladies and gentlemen
This is my new idea for the S&P 500
My idea is that SPX will continue to downtrend
I hope my idea is clear
Support me by like and share
Good luck💰💯


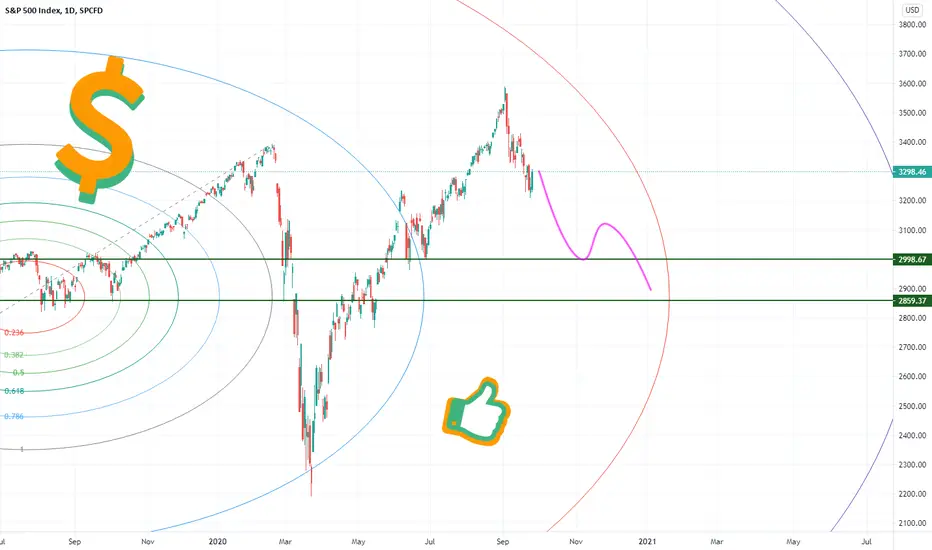
S&P 500 1D-TIMEFRAME ANALYSIS 💡S&P 500 1D-TIMEFRAME ANALYSIS 💡
Hello ladies and gentlemen
This is my new idea for the S&P 500
My idea is that SPX will continue to downtrend
Targets
3000
2850
I hope my idea is clear
Support me by like and share
Good luck💰💯
SPX'S Correlation Index G&D Crosses + low &high reading You need both charts to understand it.
wish you all the best.

S&P 500 1W-TIMEFRAME ANALYSISS&P 500 1W-TIMEFRAME ANALYSIS
Hello ladies and gentlemen
This is my new idea for SPX
the price will test 3130 daily support
My idea shows the possibility of breaking this support
But be relaxed
Real support is between 2970 and 3030 It would be good to test it
From there we will start the bull market
I hope my idea is clear
Support me by like and share
Good luck


S&P 500 is ready to go lower to complete (ABCDE) daily waves S&P 500 is ready to go lower to complete (ABCDE) daily waves and test the key resistance zone 3000


SPX & MACD Relationshipe on a weekly chart success rate is less than 14 %, but you could miss out big corrections which happens to be
the big three since 2009 check chart for more info.
. wish all the best.

SPX Above 100d MA mix reading, false, correct, missed 2 big oncenothing to say, i will include both charts.

SPX500 LONG SET UP TO NEW ATH WILL SPX500 OBEY TREND TO NEW HIGHS OR BREAK TREND DROP YOU COMMENT BELOW

SPX Putt/Call Ratio since 2009 up to date i might missed couple.below .60 not reliable, above 1.26 very reliable

VIX Death Cross, just happened we shall seeSince 2009 8 times we've had vix death cross. Is it different this time or the same we shall see.

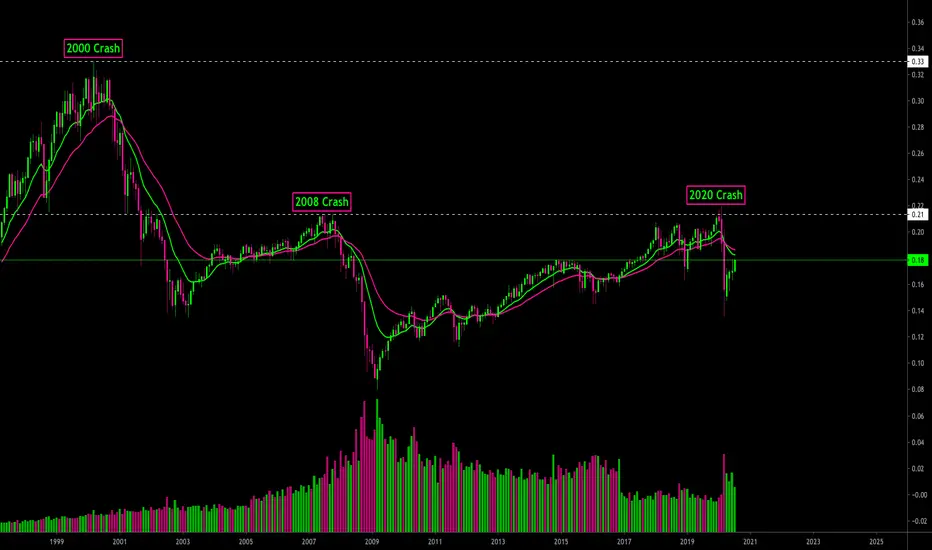
SPX / M2 paints a very different picture of the global marketThis chart shows the SPX/M2 and essentially paints a picture of the SPX when accounting for inflation.
All the "gains" made in the time following the 2008 crash, after factoring inflation in, simply put price or "value" back to where it peaked.
How interesting that the 2020 crash should occur at such a pivotal TA level, forming a near perfect sweep of highs and double top.
From this view, it looks as though the price action following the 2020 march lows is simply amounts to a bearish retest.
Will be an interesting one to watch as the money printer fires up yet another round of QE.
Brrrr, brrrr, brrrr.....
SPX500 WEEKLY FORECASTHello Traders, here is the full analysis for this pair, let me know in the comment section below if you have any questions, the entry will be taken only if all rules of the strategies will be satisfied. I suggest you keep this pair on your watchlist and see if the rules of your strategy are satisfied

SPX (S&P 500) - Potential Pullback In PlayThe SPX (S&P 500 index) has been in a uptrend, making a series of higher-highs and higher-lows in price.
A potential pullback play is forming, and the price could fall to the horizontal support levels or support trendline.
Support levels: 3162.39 and 3131.83 and 3024.60.
Resistance levels: 3234.47 and 3263.00 and 3328.58.
__________________________________________________________________________________________________
Thanks for checking out this chart idea. Click Like, Follow, and always remember: NO FOMO.

SPX500USD Buy signal setupEnjoy a free signal
Trade at your own risk;
Know your risk to reward
We had a breakout of monthly S/R area and now market has come back down to retest the 12hr uptrend. If it holds, this shall play out.
Symbol: SPX500USD
BUY
Entry: $2950
Best entry: $2940
Stop Loss: $2920 (-$30 to -$20 from best entry)
Take profit: $3015 (+$65 to +$75 from best entry)

SPX500USD Buy SIgnal SetupEnjoy a free signal
Trade at your own risk;
Know your risk to reward
We had a breakout of monthly S/R area and now market has come back down to retest the resistance. If it holds, this shall play out.
Symbol: SPX500USD
BUY
Entry: $2940
Best entry: $2935
Sl: $2920 (-200 to -150 pips from best entry)
TP: $2980 (+400 to +450 pips from best entry)
TP2: $3015 (+750 to +800 pips from best entry)

SPX500 Sell Signal setupHeres my analysis on SPX500USD before the week gets started.
enjoy a free signal.
trade at your own risk.
SELL
Symbol: SPX500USD
Entry: $2875 (Sell limit)
Best Entry: $2895 (Sell limit)
Stop Loss: $2915 (-400 to -200 pips from B.E.)
Take Profit: $2820 (+550 to +750 pips from B.E.)
Take Profit 2: $2760 (+1150 to +1350 pips from B.E.)
