S&P 500 BREAKOUT?! 18.2.25Simple as can be.
1. November 2024 - Feb 2025 wedge pattern, converging support and resistance with higher highs and lows.
2. Descending trend-lines within the wedge, first line broken Jan 16th (highlighted) - 3% jump in 3 days of trading, second line broken today, Feb 18th.
3. Potential rise to the top of the wedge pattern, around the mid 6300's.
Stay logical, with a plan and consistent.
Fortune favors the brave!
Spx500long

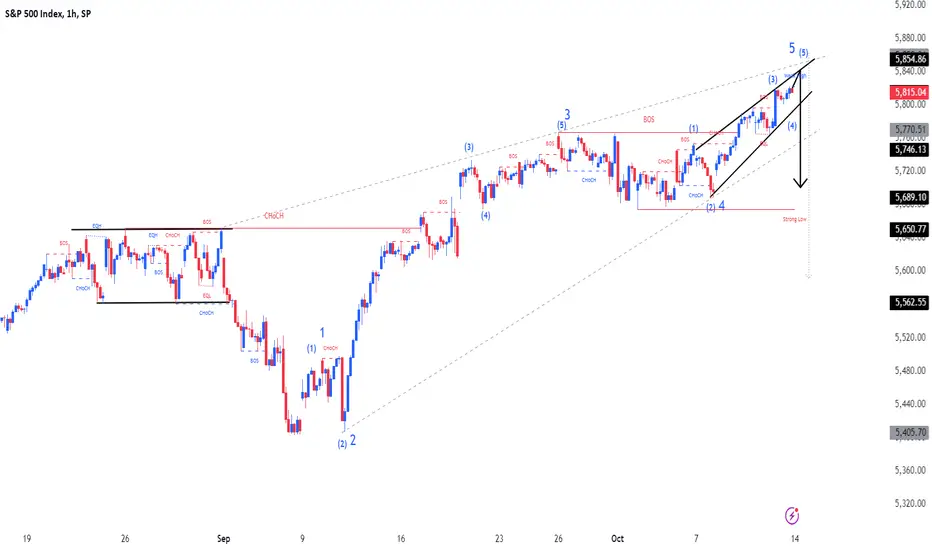
There's a storm on my chartHi everyone,
I see two possibilities.
Blue or Brown ? (we have to see!)
Technical Section:
The Blue Path: S&P500 is completing the fifth wave of the 5th wave of a five-wave rally.
Wave 5 = 2.618 x length of Wave 1
Wave 3 = 2 x length of Wave 1
Target = 5790
The Brown Path: S&P500 is completing the fifth wave of the 3rd wave of a five-wave rally.
Wave 3 = 4.236 x length of Wave 1
Target = 6440

SPX500 Bullish Bias!
HI,Traders !
SPX500 is trading in an
Uptrend and the Indice has
Formed a bullish flag
Pattern so as the Indice
Is breaking out we
Are bullish biased
And we will be expecting
A further move up!
Comment and subscribe to help us grow!

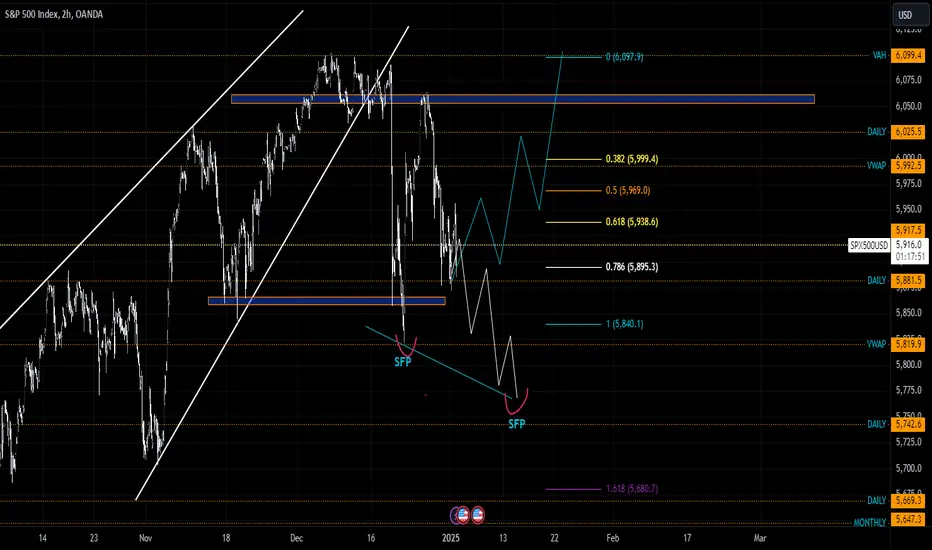
S&P Scenario 2.1.2025In this market, in order to consider some long setups, we need to hold the 6060 level or something around it, and since we didn't hold this support, we had a way to go short after the breakout. Now I see a scenario like this: the market should come for the sfp below the low as shown, or it will start to rise directly into the long, but as long as we are below the 6060 level, I'm considering a long setup. I would take that if the sfp below the low was met.
Bullish Continuation for SPX500After Trading in a small consolidation SPX looks to pick back up on its Bullish movement.
- Price has broken and now retesting bearish trendline.
-Price swept the lows of the liquidity and is now retesting the previous resistance of the zone.
The Retest is taking place at the H1 lvl resistance 5,903
- Rejection wick with an inside bar pattern
- There's a weak bullish divergence with the previous low.
-Wait for your entry signal

S&P 500 Potentially BullishFOREXCOM:SPX500 has been in a bullish direction. We have seen it make new highs and right now it is coming for a retest on the previously broken high. I will wait for a retest and see some price action at the 5,875.2 area before going long.
Until then, fingers crossed.
Past results does not guarantee future results, please do your due diligence
Like and follow for more

Scenario on s&p 500 13.12.24We have two scenarios for now, the first one is that if we want to get to the new ath, we need to keep the level around 6060, if that doesn't happen and we break below this level, it is possible that there will be a deeper correction, the first level is 6000, the deepest so far is 5880.

S&P 500: Long Trade Targets AheadS&P 500 Trade Details:
The S&P 500 (SPX) on the 15-minute timeframe confirms a bullish breakout according to the Risological trading indicator . Target 1 (TP1) has been successfully hit, with higher targets in sight, as the bullish momentum sustains.
S&P 500 Key Levels:
Entry: 5889.16
Stop Loss (SL): 5872.22
S&P 500 Take Profit Targets:
TP1: 5910.09 ✅
TP2: 5943.96
TP3: 5977.82
TP4: 5998.75
Analysis:
The price action indicates strong upward momentum with consecutive bullish candles. The moving averages align to support the trend. Short-term resistance at higher targets may see consolidation before further upward movement.
Outlook:
With TP1 hit, the trade looks promising to reach TP2 and beyond. Keep monitoring momentum strength and secure profits as each level is achieved. Stay cautious of reversals near key resistance zones.

Weekly Forex Forecast Nov. 11th: BUY S&P500, NASDAQ, & DOW!This is the Weekly Forex Forecast for Nov 11th.
The Big 3 Indexes are strong, trading at ATHs. There is no reason to look for anything other than buys this week.
Check the comments section below for updates regarding this analysis throughout the week.
Enjoy!
May profits be upon you.
Leave any questions or comments in the comment section.
I appreciate any feedback from my viewers!
Like and/or subscribe if you want more accurate analysis.
Thank you so much!
Disclaimer:
I do not provide personal investment advice and I am not a qualified licensed investment advisor.
All information found here, including any ideas, opinions, views, predictions, forecasts, commentaries, suggestions, expressed or implied herein, are for informational, entertainment or educational purposes only and should not be construed as personal investment advice. While the information provided is believed to be accurate, it may include errors or inaccuracies.
I will not and cannot be held liable for any actions you take as a result of anything you read here.
Conduct your own due diligence, or consult a licensed financial advisor or broker before making any and all investment decisions. Any investments, trades, speculations, or decisions made on the basis of any information found on this channel, expressed or implied herein, are committed at your own risk, financial or otherwise.

S&P 500TREND ; The S&P 500 index is currently in an uptrend (Bullish), characterized by higher highs and higher lows since mid-August.
PLAN :
• The support zone around 5,670 acted as a base for a recent upward move.
• The 5,870 level seems to be a key resistance area, and price is currently testing this level.
• If the price breaks above the 5,870 resistance level, my potential target will be around 5,989.15.
• Note that the blue arrow indicates the measured move from the support level at 5,750 up to the resistance at 5,870, which could imply the projected target if this breakout occurs.

SPX 500 I Two areas of potential long opportunity Welcome back! Let me know your thoughts in the comments!
** SPX500 Analysis - Listen to video!
We recommend that you keep this pair on your watchlist and enter when the entry criteria of your strategy is met.
Please support this idea with a LIKE and COMMENT if you find it useful and Click "Follow" on our profile if you'd like these trade ideas delivered straight to your email in the future.
Thanks for your continued support!Welcome back! Let me know your thoughts in the comments!

US500 continues to trade around the all time highs.SPX500USD - 24H EXPIRY
Price action continues to trade around the all-time highs.
Posted mild net daily gains but all trading confined to the previous days range, an indecisive Inside Day.
The 261.8% Fibonacci extension is located at 5901 from 5682 to 5766.
Due to an Ending Wedge formation, we continue to treat extended gains with caution.
Reverse trend line resistance comes in at 5898.
We look to Buy at 5848 (stop at 5823)
Our profit targets will be 5898 and 5905
Resistance: 5892 / 5898 / 5901
Support: 5848 / 5770 / 5766
Risk Disclaimer
The trade ideas beyond this page are for informational purposes only and do not constitute investment advice or a solicitation to trade. This information is provided by Signal Centre, a third-party unaffiliated with OANDA, and is intended for general circulation only. OANDA does not guarantee the accuracy of this information and assumes no responsibilities for the information provided by the third party. The information does not take into account the specific investment objectives, financial situation, or particular needs of any particular person. You should take into account your specific investment objectives, financial situation, and particular needs before making a commitment to trade, including seeking advice from an independent financial adviser regarding the suitability of the investment, under a separate engagement, as you deem fit.
You accept that you assume all risks in independently viewing the contents and selecting a chosen strategy.
Where the research is distributed in Singapore to a person who is not an Accredited Investor, Expert Investor or an Institutional Investor, Oanda Asia Pacific Pte Ltd (“OAP“) accepts legal responsibility for the contents of the report to such persons only to the extent required by law. Singapore customers should contact OAP at 6579 8289 for matters arising from, or in connection with, the information/research distributed.

S&P 500 (SPX) Hits All Targets! Bullish Rally CompletesThe S&P 500 Index has shown strong bullish momentum, with the long trade successfully reaching all profit targets.
Key Levels
Entry: 5719.98 – The long position was entered as the price broke above this level, confirming bullish sentiment.
Stop-Loss (SL): 5703.41 – Positioned below recent support to protect against potential downside risk.
Take Profit 1 (TP1): 5740.45 – The first target was hit, confirming the upward momentum.
Take Profit 2 (TP2): 5773.57 – The second target was achieved as the bullish trend continued.
Take Profit 3 (TP3): 5806.70 – The third target was reached, indicating continued strength in the market.
Take Profit 4 (TP4): 5827.17 – The final profit target was reached, marking a highly successful long trade.
Trend Analysis
The price is well above the Risological Dotted trendline, indicating a strong bullish trend. The steady upward movement suggests that the market sentiment is favorable for further gains, although all targets have been hit, marking the trade's conclusion.
The long trade on the S&P 500 Index successfully hit all profit targets, with the final target at 5827.17 signaling a strong rally. The upward momentum was supported by the Risological Dotted trendline, reflecting solid market conditions for bullish trades.

SPX500Pair : SPX500 Index
Description :
Completed " 12345 " Impulsive Waves
Break of Structure
RSI - Divergence
Rising Wedge as an Corrective Pattern in Short Time Frame and Long Time Frame
Demand Zone
S&P 500 Bull Breakout: What Is Next?A strong daily bullish close hold could open the door for another bull rally on S&P500

S&P 500 Index analysis 2024/10/09SP:SPX
Hey everyone, I just got back from a trip. Sorry it's been a while since my last analysis. How's everyone been doing in the markets lately?
Notice: The points are only valid from 2024/10/09 to 2024/10/20
What we have now?
1. Current price: 5760
2. The key support and resistances level:
5770
5590
5450
5300
Future Price movement
70% chance : The day level shows strong momentum, and we expect the price to make a slight correction before pushing toward 5770, or even breaking through that level.
30% chance : Moving back to 5590 and start moving back from 5590 to 5450.
Trade safe!

SPX500Pair : SPX500 Index
Description :
Completed " 12345 " Impulsive Waves
Break of Structure
RSI - Divergence
Rising Wedge as an Corrective Pattern in Short Time Frame
Resistance Level
SPX500 Potential Long!SPX500 is trading in an
Uptrend and indice is now
Making a pullback to
Retest a horizontal support
Of 5645.80 so after the retest
We will be expecting
A local bullish rebound !

SPX analysis at Time One daily timeThis index continues its upward trend and the ceiling of 48,000 will be broken
The price has made its protected floor by hitting its local support and is doing fractal behavior to break the price ceiling.
I watch the market
Not financial advice

SPX500 Bullish Bias!SPX500 went down and
Made a retest of a horizontal
Support level of 5595.23
And as it is a strong level we
Will be expecting a local
Bullish rebound!

SPX forming a top?US500 - 24h expiry
Levels above 5630 continue to attract sellers.
The 161.8% Fibonacci extension is located at 5544 from 5650 to 5585.
Bespoke support is located at 5540.
Selling spikes offers good risk/reward.
Economic figures could adversley affect the short term technical picture.
We look to Sell at 5630 (stop at 5665)
Our profit targets will be 5540 and 5470
Resistance: 5630 / 5650 / 5680
Support: 5545 / 5540 / 5470
Risk Disclaimer
The trade ideas beyond this page are for informational purposes only and do not constitute investment advice or a solicitation to trade. This information is provided by Signal Centre, a third-party unaffiliated with OANDA, and is intended for general circulation only. OANDA does not guarantee the accuracy of this information and assumes no responsibilities for the information provided by the third party. The information does not take into account the specific investment objectives, financial situation, or particular needs of any particular person. You should take into account your specific investment objectives, financial situation, and particular needs before making a commitment to trade, including seeking advice from an independent financial adviser regarding the suitability of the investment, under a separate engagement, as you deem fit.
You accept that you assume all risks in independently viewing the contents and selecting a chosen strategy.
Where the research is distributed in Singapore to a person who is not an Accredited Investor, Expert Investor or an Institutional Investor, Oanda Asia Pacific Pte Ltd (“OAP“) accepts legal responsibility for the contents of the report to such persons only to the extent required by law. Singapore customers should contact OAP at 6579 8289 for matters arising from, or in connection with, the information/research distributed.

S&P 500 Index (SPX) Analysis: Key Levels and Expectations.SP:SPX My Take:
Looking at the 4-hour chart of the S&P 500 Index, it's clear that we're approaching a critical juncture. The price recently rallied up to the $5,630 - $5,655 resistance zone, which has been a significant barrier in the past. However, this level has proven to be tough for the bulls to break through, and we're now seeing signs of potential exhaustion.
Key Levels:
Resistance:
$5,620 - $5,630: This is the zone where the price is currently facing resistance. It’s a crucial area to watch because a failure to break above it could result in a pullback.
Support:
$5,480 - $5,440: If we see a rejection from the current resistance, I'm expecting the price to retrace towards this support zone. This area has acted as a strong floor in the past, and it's likely where buyers might step in again.
Trendline Support:
The upward trendline, originating from the lows earlier this year, is still intact. This trendline could provide additional support around the $5,280 level if the price breaks through the aforementioned support zone.
Expectations:
Pullback Potential:
Given the current price action, I wouldn’t be surprised to see a pullback from this resistance zone. The first area I'll be watching for potential support is the $5,480 - $5,440 zone. A break below this could bring us down to test the trendline around $5,280.
Continuation of the Uptrend:
If the bulls manage to push through the $5,620 - $5,630 resistance zone, we could see a continuation of the uptrend with a possible target towards $5,700 and beyond. But for now, I’m leaning towards the possibility of a short-term pullback before any further upside.
Food for Thoughts:
Right now, I’m closely watching how the price reacts around this resistance zone. A pullback could offer a good buying opportunity, especially if it holds above the $5,480 - $5,440 support area. On the other hand, a strong breakout above $5,630 would signal that the bulls are in control and could push the market to new highs.
Stay tuned for more updates as the situation develops! Happy Trading from Deno Trading!

SPX to continue in the upward move?SPX500USD - 24h expiry
Continued upward momentum from 5544 resulted in the pair posting net daily gains yesterday.
5 positive daily performances in succession.
The 261.8% Fibonacci extension is located at 5728 from 5094 to 5336.
The previous swing high is located at 5680.
Further upside is expected although we prefer to set longs at our bespoke support levels at 5566, resulting in improved risk/reward.
We look to Buy at 5566 (stop at 5526)
Our profit targets will be 5680 and 5728
Resistance: 5636 / 5680 / 5728
Support: 5566 / 5470 / 5440
Risk Disclaimer
The trade ideas beyond this page are for informational purposes only and do not constitute investment advice or a solicitation to trade. This information is provided by Signal Centre, a third-party unaffiliated with OANDA, and is intended for general circulation only. OANDA does not guarantee the accuracy of this information and assumes no responsibilities for the information provided by the third party. The information does not take into account the specific investment objectives, financial situation, or particular needs of any particular person. You should take into account your specific investment objectives, financial situation, and particular needs before making a commitment to trade, including seeking advice from an independent financial adviser regarding the suitability of the investment, under a separate engagement, as you deem fit.
You accept that you assume all risks in independently viewing the contents and selecting a chosen strategy.
Where the research is distributed in Singapore to a person who is not an Accredited Investor, Expert Investor or an Institutional Investor, Oanda Asia Pacific Pte Ltd (“OAP“) accepts legal responsibility for the contents of the report to such persons only to the extent required by law. Singapore customers should contact OAP at 6579 8289 for matters arising from, or in connection with, the information/research distributed.
