SPX500 selloff PENDING to 3070 *history repeats itself* MID-LONG WHEN IN DOUBT, ZOOM OUT!
ON the SHORTSELL we're looking at possibility 1-2 (maybe even 3 ATHs on SPX500 index) to follow suit -- a consolidation in what is/will be a a continuation of this bullish priceaction we've been seeing; the same I've been calling for since the start of Q4 yet we are almost at the apex, the mountaintop is approaching which will *(presumably after the holidays)* lead to further bullish priceaction followed by a selloff treading us down toward the $3070.5 area, a bearish dump which should approach fast & furiously if the pink trendline from DEC '17 is any indication, we're seeing a repetition in priceaction that will ultimately lead to a retracement -- though keeping it on the EMA for you forex swing traders , SPX500 has had an UNDOUBTEDLY FANTASTIC RUN THE PAST 2-3 QUARTERS, FOR ALL OF 2019! yet all good things must come to an end.
Remember this publication is LONG so although the slope between the green TP line & current price seems miniscule, it could actually take a while (pointless to speculate timeframe) but >30D before it reaches that apex leading us to the selloff @ 3070.5
Great thing about stock predictions is that much less volatility == much more predictability == much less $ROI due to lower risk/low reward.
Like riding a bike with training wheels on flat terrain as opposed to riding a mountain bike on gear 10 up everest (forex trading wallst vs forex trading @coinmarketcal)
This could very well be fantastic news for $crypto priceaction as (much similar to all other commodities) it parallels precious metals, XAU, etc. as a means of FUD for those looking to liquidate assets in times of speculative uncertainty aka FUD. I'll leave it at that for now. Also, $BNB priceaction looking solid for entry (defer to linked publication below) but I digress.
Peace & Love.
Happy Holidays & New Years -- will follow up with daily publications (as promised) after the Holidays circa Jan 10-12th.
Disclaimer
Not financial Advise. Please invest wisely & always set stop-losses.
-@a1mTarabichi
Spx500long

S&P 500: Santa Claus RallyHello everybody!
PrimeXBT is here again with another technical analysis breakdown, and today we are taking a look at Standard and Poor's 500 Index.
News and Fundamental Analysis:
While the Asian markets are currently subdued, Wall Street is caught within a firm and unwavering uptrend.
The S&P 500 hit a sixth consecutive high on Thursday — its longest streak since January 2018 — and it closed at a record high along with the Nasdaq and the Dow Jones.
On the other hand, investors still do not understand what is included in the “Phase 1” of the trade agreement between China and the United States.
Overall, this is a worrying sign that the US economy may be slowing down again at a time when the Fed has stopped its monetary policy softening.
It should be noted that such signals act as a leading indicator of business cycles, and therefore market players usually pay close attention to them, but not now.
Technical Analysis:
Currently, SPX is hitting strong resistance that’s coming from 1.618% Fibonacci — which is a resistance level.
The price action combined with the Relative Strength Index is staying strong, but BTC has formed a bearish divergence, which often indicates that a trend reversal is forming from bullish to bearish, and a downtrend or valuation adjustment could soon follow.
Such price action was seen in May of 2015 .
Once the price reaches the resistance level, a rejection could cause a fall to 1.272% Fibonacci which is our support level.
Support level: 3100
Resistance level: 3300
Day's range: 3192.3 — 3205.5
Be careful though, don't forget about capital & risk management.
Keep an eye out for more PrimeXBT trading signals for SPX and other assets.

Break, possible recapture, of the 2008-2016 uptrend line In my last post i was stating i was expecting to see a break of the trendline starting from the lows of 2009 and 2016 that we broke in Q4 of last year. Today we had a break of that trendline with what seems like conviction. Looking for a confirmation and then a retest at some point. I don't want to count my chickens too early here but it looks like the start of a parabolic move for the indices, a recapture of this trend line is huge in my opinion. The head and shoulders i mentioned could still be in play if we do retest, and subsequently fail to break out. If we do safely get above this trend line i will be sufficiently convinced that a correction is not coming any time soon until the next macro event (trade, economy, repo market, credit crisis) which honestly could come out of nowhere to smoke everyone down, so keep your head on a swivel.
BUT, keep in mind we still haven't broke out of the top of the channel on the hourly. Overall we're bullish until we're not. Still holding my puts and have a target of $322.50.
I'm also adding the same weekly chart which has not shown a break out and is still within the ascending wedge.
ALSO - Be advised that SPY apparently was to have an ex dividend payout tomorrow. If that is correct we will most likely open about $1.20-$1.50 lower on the underlying.
Be advised: This is not trading advice. This is based purely off of TA and is not a trading idea.

SPX reversed from resistance, potential drop!
SPX reversed off its resistance at 3205.5 where it could potentially drop further to 3058.1.
Trading CFDs on margin carries high risk.
Losses can exceed the initial investment so please ensure you fully
understand the risks.

SPX reversed from resistance, potential drop!
SPX reversed off its resistance at 3201.8 where it could potentially drop further to 3058.1.
Trading CFDs on margin carries high risk.
Losses can exceed the initial investment so please ensure you fully
understand the risks.

Just keep an eye out for it. Self descriptive and printing on ES, RTY/IWM, NQ/QQQ, and YM/DIA also.
We're also hitting the trend line from the lows of '09 - Fed '16 that we broke in Q4 of last year and haven't been able to recapture.
I'm cautiously 60-40 long and wouldn't be surprised and am expecting a break of the trend line/recapture and for it to become basically parabolic before some blow off top event.

Bullish SPX500When the market gets excited and expect something to occur the opposite happens ,therefore i see the US stock market continuing higher and not crash prior 2020.

SPX approaching resistance, look out for potential reversal!
SPX is approaching its resistance at 3204.9 where it is could reverse down to its support at 3058.1.
Trading CFDs on margin carries high risk.
Losses can exceed the initial investment so please ensure you fully
understand the risks.

S&P to 3900, potential on phase1 trade dealAfter an array of failed emergency monetary tactics such as a $500B a year corporate tax break, 3 rounds of Quantitative Easing and 3 rate cuts, finally after the trade deal was announced, we peaked our head well up above the bottom of channel / sub-channel we had been stuck in for over a year now. This was additional evidence that the drag on stock markets despite all the corporate welfare was largely due to the direct impact of the trade war (and related unpredictable policy) on global economies.
Likely it will take a little time to step its way up to top of channel and likely will only happen in the absence of renewed trade tensions. Other than renewed trade tensions, there doesn't seem much in the way to prevent us from seeing the S&P at 3800-3900 in 2020. If we do reach top of this 10 year channel for the S&P bull market, it will be the first time we have seen it in over 4 years now and the actual first evidence of a strong corporate economy under this administration.
At this point the only way to outperform the markets from the previous 8 years is if this administrations economic policies are able to see a break upwards out of top of this 10 year channel without further emergency monetary policy boosting it. After mostly riding the bottom of trend for 4 years now, this is only the second time we have seen hope for breaking out of the sluggish bottom of channel, we just need to maintain the path of restoring global trade and I think we will see top of channel. There is a lot of potential here.
This is not trade advice, DYOR, Author is holding S&P ETF options long.
s

SPX approaching resistance, look out for potential reversal!
SPX is approaching its resistance at 3186.8 where it is could reverse down to its support at 3058.1.
Trading CFDs on margin carries high risk.
Losses can exceed the initial investment so please ensure you fully
understand the risks.

Potential S&P 500 ScenarioIt's been a while since I shared anything like this... most of the last few things were experimental historical models...
This is all based in Fibonacci, both price and time... this would have us peaking at about 3450 around late September 2020...
Though I don't have the count posted with it, it is based in Elliott Wave as well...
The EW concept here is an extended wave 1, with 3 being 0.786 of 1 and 5 being 0.786 of 3 - which leads to waves 3+5 equaling wave 1 (typical when 1 is extended)...
Just thought I'd share what I was looking at

SPX approaching resistance, look out for potential reversal!
SPX is approaching its resistance at 3186.8 where it is could reverse down to its support at 3058.1.
Trading CFDs on margin carries high risk.
Losses can exceed the initial investment so please ensure you fully
understand the risks.

SPX500: Further Upside Expected - RSI Shows Strong Bull MomentumHi Traders,
I was initially expecting price to form an ending diagonal, thereby slowing down the bull trend for downside. However the ending diagonal is now invalid because price has slightly broken out of the structure in the past week. What's more is that we have no divergence on the RSI, and this indicates further upside.
Therefore, we can keep buying the pullbacks until price shows signs of slowing down.
Regards,
Wave Theorist

SPX bounced from support, potential for a further rise!
SPX bounced off 3058.1 where it could potentially rise further to 3186.8.
Trading CFDs on margin carries high risk.
Losses can exceed the initial investment so please ensure you fully
understand the risks.

SPX pulled back, is it going to hit all time highs now? 3245!The SPX was due for a pullback, we had anticipated the move lower before a pop would be more extended than it was and it was driven on trade news. We did, however, curl back into the wedge that was broken and use it as support before slightly rallying throughout the past few sessions. It did not seem like the downside was over after Monday, considering we saw an 80 point drop in just 2 days, which was about 2.7% from all time high. In our previous idea we mentioned that the SPX would have a really hard time moving up without pulling back just a bit. We got our pullback but we did not expect the price to rebound so fiercely off that support structure.
Now the question is what is the move to the upside? How far can we see the price on this rally? Last time we said that we would probably come into an all-time high a new one that is, somewhere above 3175.
A measured move is 3245 based on the Fib extension.
IF the trade talks continue to deteriorate then we could see more downside in the SPX bringing price down to 3025.
Disclaimer: This idea is for educational purposes only, this does not constitute as investment or trading advice. TRADEPRO Academy is not responsible for market activity.

SPX500 LONG SNIPER ENTRYBUY SPX500
Entry 1 3076
Entry 2 3079
Sl 3070
Tp.1 3086
Tp.2 3108
Tp.3 3117
Tp.4 3124

S&P 500- Long after correctionAfter reaching an all-time high, SP500 is having a normal and healthy correction.
We believe that the price has room to rise and a good guy zone can be 2950-3000 zone

SPX bounced from support, potential for a further rise!
SPX bounced off 3058.1 where it could potentially rise further to 3186.8.
Trading CFDs on margin carries high risk.
Losses can exceed the initial investment so please ensure you fully
understand the risks.

SPX500 (S&P500) LongBUY SPX500
Entry 1 3089
Entry 2 3085
Sl 3082
Tp.1 3097
Tp.2 3108
Tp.3 3117
Tp.4 3124

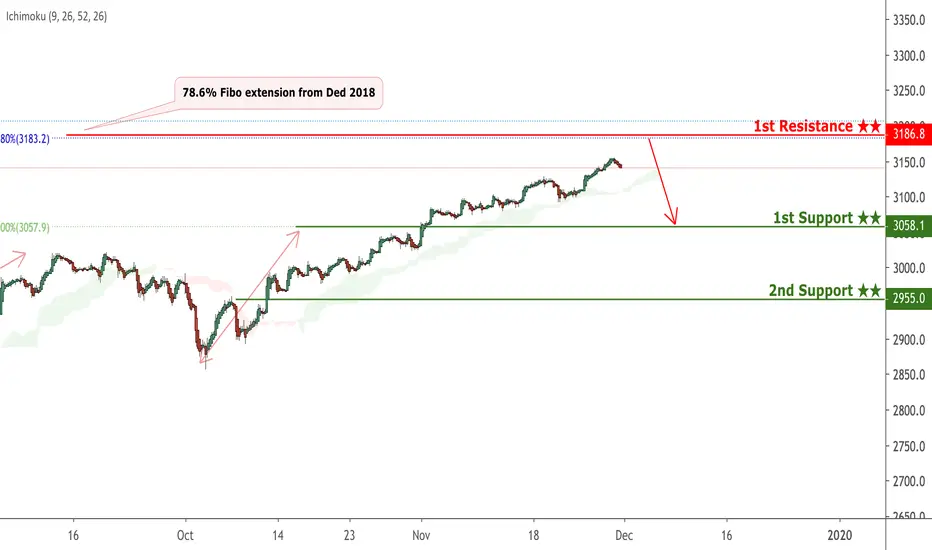
SPX potential reversal!
SPX expected to rise up to 1st resistance at 3186.8 where it could potentially react off and drop down to 1st support at 3058.1.
Trading CFDs on margin carries high risk.
Losses can exceed the initial investment so please ensure you fully
understand the risks.

SPX potential reversal!
SPX expected to rise up to 1st resistance at 3186.8 where it could potentially react off and drop down to 1st support at 3058.1.
Trading CFDs on margin carries high risk.
Losses can exceed the initial investment so please ensure you fully
understand the risks.
SPX potential reversal!
SPX expected to rise up to 1st resistance at 3186.8 where it could potentially react off and drop down to 1st support at 3058.1.
Trading CFDs on margin carries high risk.
Losses can exceed the initial investment so please ensure you fully
understand the risks.

TLT weakness & bond weakness, TLT down to $132TLT is a 20+ year bond ETF that made strong highs throughout the rate-cutting cycle and rightfully so. The inversion of bonds vs the equity market has caused bond yields to drop and because of that since the price of bonds is directly inversely correlated to their yields, prices in TLT and other bonds have been increasing. The low rates have come to a halt as the rate-cutting cycle has stopped, or so we think it has. TLT has since then entered a downtrend in a channel and looks to be continuing in that respect. Bond yields are so low, that the convergence with the SPX is imminent, we've seen a slow increase in yields which will further push the price of TLT down. Another factor is that the equity market is continuously showing strength and looks to be on the rise for the next few months based on FED policy to pump more money into the economy. The volume on TLTto the upside has decreased as well and every swing lower is accompanied by strong volume.
Disclaimer: This idea is for educational purposes only, this does not constitute investment advice. TRADEPRO Academy is not liable for any market activity based on this idea.
