SPX500 Trend Changed? or retracement? These is something that I am going to try today, will try some small amount on long, and might pump another long at the SL point depends on the info when the price go to SL. good luck everyone!
Spx500long

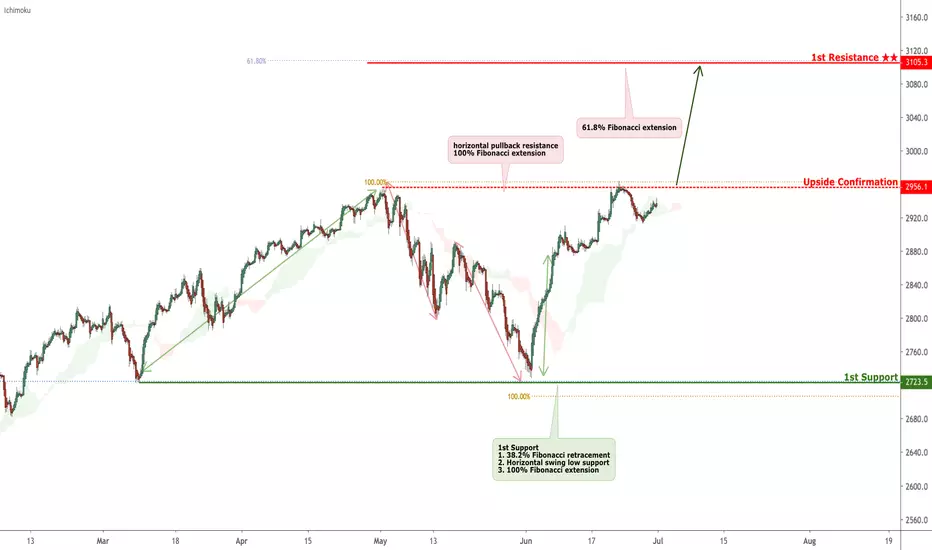
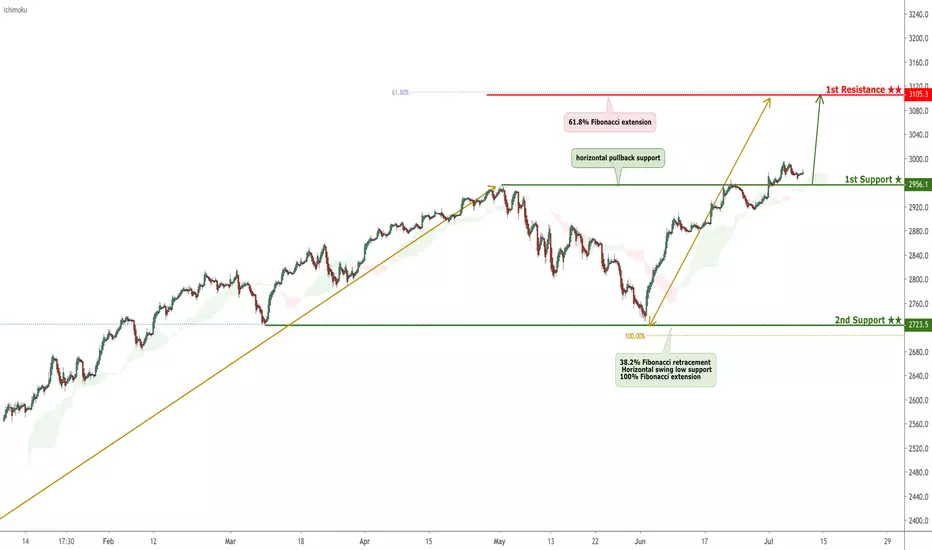
SPX approaching support, potential for a bounce!
SPX is expected to drop to 1st support at 2956.1 where it could potentially react off and up to 1st resistance at 3105.3.
Trading CFDs on margin carries high risk.
Losses can exceed the initial investment so please ensure you fully
understand the risks.

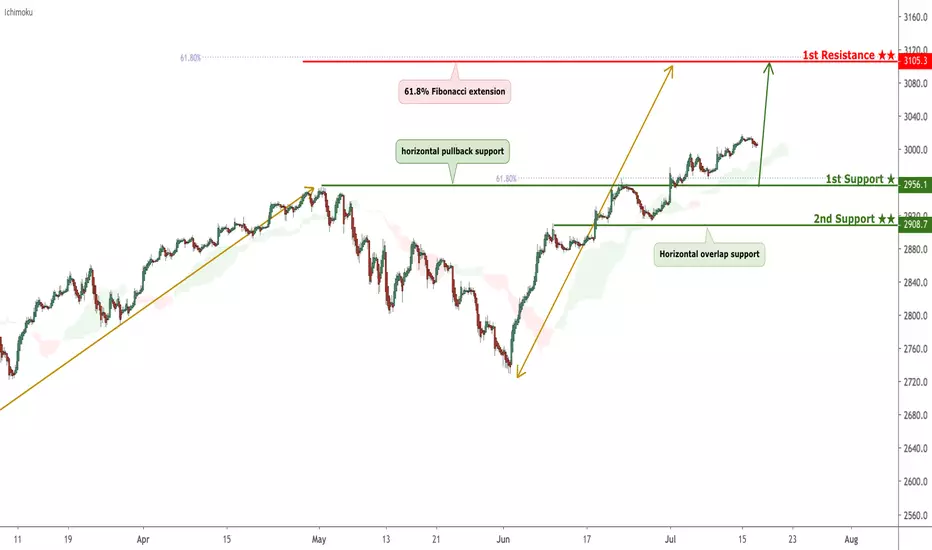
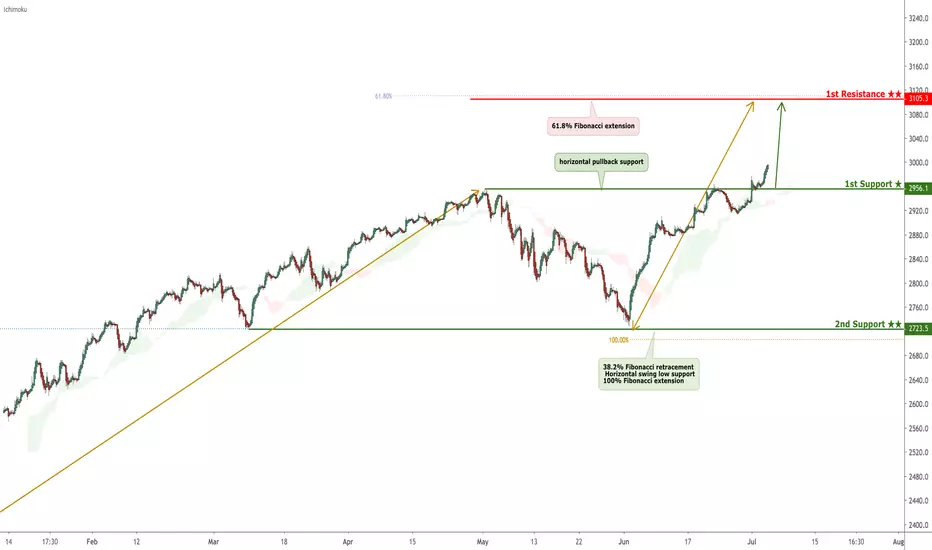
SPX bounced from support, potential for a further rise!
SPX bounced off its support at 2956.1 where it could potentially rise further to 3105.3.
Trading CFDs on margin carries high risk.
Losses can exceed the initial investment so please ensure you fully
understand the risks.
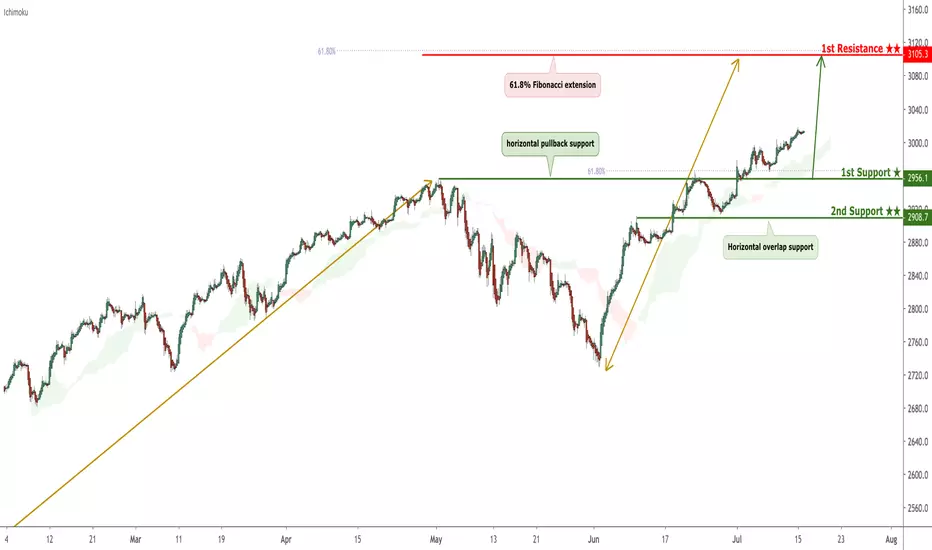
SPX bounced from support, potential for a further rise!
SPX bounced off its support at 2956.1 where it could potentially rise further to 3105.3.
Trading CFDs on margin carries high risk.
Losses can exceed the initial investment so please ensure you fully
understand the risks.

SPX500, #SPX500For moving forward spx500, we have to see overcoming the level of $3,015 today, the price don't have to go lower $2,987 more then for 2 days.

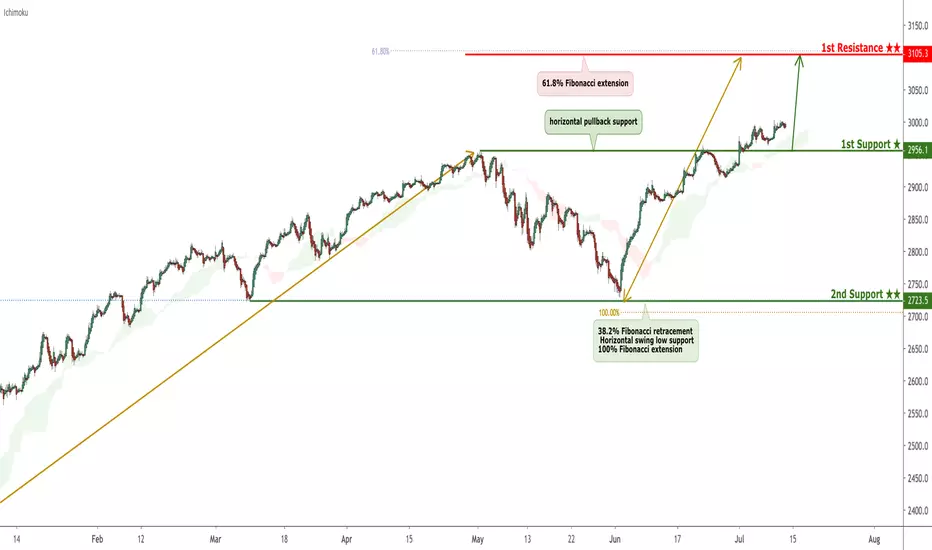
SPX bounced from support, potential for a further rise!
SPX bounced off its support at 2956.1 where it could potentially rise further to 3105.3.
Trading CFDs on margin carries high risk.
Losses can exceed the initial investment so please ensure you fully
understand the risks.
Elliott Wave View: S&P 500 (SPX) Remains Buy in the DipsS&P 500 (SPX) shows a bullish sequence from December 26, 2018 low against June 3, 2019 low (2728.81) favoring further upside. Short term Elliott Wave view suggests the rally from June 13, 2019 low (2874.68) is unfolding as a leading diagonal Elliott Wave structure. Leading diagonal is a special type of 5 waves structure with a wedge like pattern and overlapping wave (i) and (iv). Up from June 13 low, wave (i) ended at 2964.15 and wave (ii) ended at 2912.99. Index then resumes higher in wave (iii) towards 2995.84 and wave (iv) pullback ended at 2963.44.
Expect SPX to do 1 more push higher to end wave (v) and this move also end wave ((i)). Afterwards, Index should pullback within wave ((ii)) to correct cycle from June 13 low before the rally resumes. Wave ((ii)) pullback should unfold in the sequence of 3, 7, or 11 swing. We don’t like selling the Index and expect Index to continue finding support in pullback. As far as pivot at June 13 low (2874.68) stays intact in the first degree, expect Index to extend higher. If pivot at June 13 low fails, then Index is correcting cycle from June 3 low (2728.81), and still expected to resume higher while above there.


SPX bounced from support, potential for a further rise!
SPX bounced off its support at 2956.1 where it could potentially rise further to 3105.3..
Trading CFDs on margin carries high risk.
Losses can exceed the initial investment so please ensure you fully
understand the risks.
"Long" Near Future of SP 500I Analize Historical chart patterns and give in my opinion most correct prediction.

SPX500 - Dips to be boughtFX:SPX500
OANDA:SPX500USD
US500 - Intraday - We look to Buy at 2954 (stop at 2944)
Previous resistance at 2959 now becomes support. Bespoke support is located at 2954. The 161.8% Fibonacci extension is located at 2946 from 3000 to 2967. The previous swing low is located at 2951. Preferred trade is to buy on dips.
Our profit targets will be 2979 and 2990
Resistance: 2979 / 2990 / 3000
Support: 2953 / 2946 / 2920

SPX bounced from support, potential for a further rise!
SPX bounced off its support at 2956.1 where it could potentially rise further to 3105.3.
Trading CFDs on margin carries high risk.
Losses can exceed the initial investment so please ensure you fully
understand the risks.

SPX bounced from support, potential for a further rise!
SPX bounced off its support at 2956.1 where it could potentially rise further to 3105.3.
Trading CFDs on margin carries high risk.
Losses can exceed the initial investment so please ensure you fully
understand the risks.

SPX ATH fluctuacionSPX managed to gap down after a freshly created all time high (ath), which proved to be a strong resistance. Weekly close left us in no man's land.
The new ath also came short 5 points off 3000.

SPX bounced from support, potential for a further rise!
SPX bounced off its support at 2956.1 where it could potentially rise further to 3105.3.
Trading CFDs on margin carries high risk.
Losses can exceed the initial investment so please ensure you fully
understand the risks.
Elliott Wave View: More Upside in S&P 500 Futures (ES_F)Elliott wave view in S&P 500 Futures (ES_F) shows a bullish sequence from December 26, 2018 low favoring further upside. In the short term chart below, the pullback to June 27 low (2914.5) ended wave ((ii)). Wave ((iii)) remains in progress as an impulse Elliott Wave structure looking for more upside. Up from June 27 low, wave (i ) ended at 2981.75 with subdivision as another impulse in lesser degree. Wave i of (i) ended at 2944.75 and wave ii of (i) pullback ended at 2935. Index then resumes higher in wave iii of (i) towards 2977.5, wave iv of (i) ended at 2963 and wave v of (i) ended at 2981.75.
Wave (ii) pullback ended at 2955.5. Wave (iii) is in progress and short term, while dips stay above 2955.74, expect the Index to extend higher. We don’t like selling the Index. As far as pullback stays above July 2 low (2955.74), expect Index to continue higher. If pivot at 2955.74 gives up, the Index is still expected to remain supported against June 4 low (2728.75). The Index has potential target to the upside towards 100% extension from December 26, 2018 low which comes at 3377 – 3529 area.

S&P 500 4H LongAn inverse head and shoulders formed, with a right shoulder break of the neckline. Measuring the distance from the head to the neckline, a reasonable target could be found slightly less than this distance applied to the breakout. In addition, long term resistance line can be found to intersect with this potential target zone.
The ADX line looks to be turning upwards after a downward trend, currently at 38.
A Stop Loss zone below the right shoulder would be appropriate.
*Not financial advice*

SPX bounced from support, potential for a further rise!
SPX bounced off its support at 2956.1 where it could potentially rise further to 3105.3.
Trading CFDs on margin carries high risk.
Losses can exceed the initial investment so please ensure you fully
understand the risks.

SPX bounced from support, potential for a further rise!
SPX bounced off its support at 2956.1 where it could potentially rise further to 3105.3.
Trading CFDs on margin carries high risk.
Losses can exceed the initial investment so please ensure you fully
understand the risks.

SPX bounced from support, potential for a further rise!
SPX bounced off its support at 2956.1 where it could potentially rise further to 3105.3.
Trading CFDs on margin carries high risk.
Losses can exceed the initial investment so please ensure you fully
understand the risks.

SPX bounced from support, potential for a further rise!
SPX bounced off its upside confirmation support at 2956.1 where it could potentially rise further to 3105.3.
Trading CFDs on margin carries high risk.
Losses can exceed the initial investment so please ensure you fully
understand the risks.