S&P 500 W1 AnalysisAccording to 3 Months Analyzing and monthly candle, here we can expect bullish wave.
Spx500long

$SPX at consolidation pace.$SPX currently trending at consolidation paste. No strong catalyst for monday for market to pump
but the momentum looks strong for bullish continuation.
1 hour & 4 hour chart the RSI at the overbought level.
expect a pull back soon. for now just ride the trend.
below is my price level for SPX calls and puts.
Calls: buy above 4143.30 sell at 4180.26+
Puts: buy below 4068.79 sell at 4008.24 or below
=================================================================
SIDE NOTE:
- make sure that you setup a price alerts on those key level so you wont miss the move.
and always to take your profits as you see one.
- sometimes, the fist 30 minute after of the opening bell is always volatile.
is either you can catch the move there. or wait for an 1 hour for better or cheaper price.
- as always if you have any question feel free to leave me a comment here.
if you're enjoying my ideas please don't forget to follow me or hit the like
to boost the post. thank you guys and see yall soon.

US500 Will Most Likely Target 4530Looking for some nice bullish moves during Q2 and I expect price to hit 4530 by summer. With that being said, I also expect more gains above that price this year. Q1 closes in 4 days and we are looking bullish at the moment. If March can go bullish, I believe there is a strong chance stocks will rally this year. This analysis is based on price action, supply and demand, and market structure.

S&P 500 Longs, SPX500 Longs, Spooz LongFavoring second entry @ 4018.75
If both of these get slapped, I will be looking @ 4001.50 & go from there.
What are your thoughts on this if you have any, if you agree drop me a boost.
Grazie
444
Shep

S&P 500 Index Long The banking failures and constant layoffs happening in real time I believe will impact the Fed and Higher rates and recession may be imminent. We have been breaking structure to the upside and I am looking for a retrace between 3955.00 and 3980.00 with the first target at the 4027.1 level. Currently bullish until the market specifies a break of structure below the 3923.00 level.

SPX500 WEEKLY ANALYSISEIGHTCAP:SPX500
As we can see a new uptrend is forming on the EIGHTCAP:SPX500
We can see that price has broken structure forming it higher high and has come back to retest that same area and also showing signs of rejections at that area so we could be looking for possible sells around that area, but if price pushes below and closes below that area we could be looking at a continuation of that former down trend

Spx500....h= Technical analysis of the spx500 on the hourly chart
= The analysis is based on trend analysis, support and resistance, and the Dow Laws
== We have two buying targets after successfully re-testing the crossover to the top
= You must wait for the price to cross the red danger zone

S&P 500 Projection (SPX)S&P 500 indices (SPX) and US500 chart looks quite similar
Price broke out of the bearish descending trendline, retested by grabbing liquidity below the trendline and its about to have some upward movement.
What do you think? like and comment below

S&P500 has Bottomed This analysis isn't going to be very exciting. I just wanted to share that I think it is likely the SPX has found a bottom.
We're still below resistance, but this is likely going to change soon, especially with the 3rd retest of the zone.
I'm bullish on the stock market.

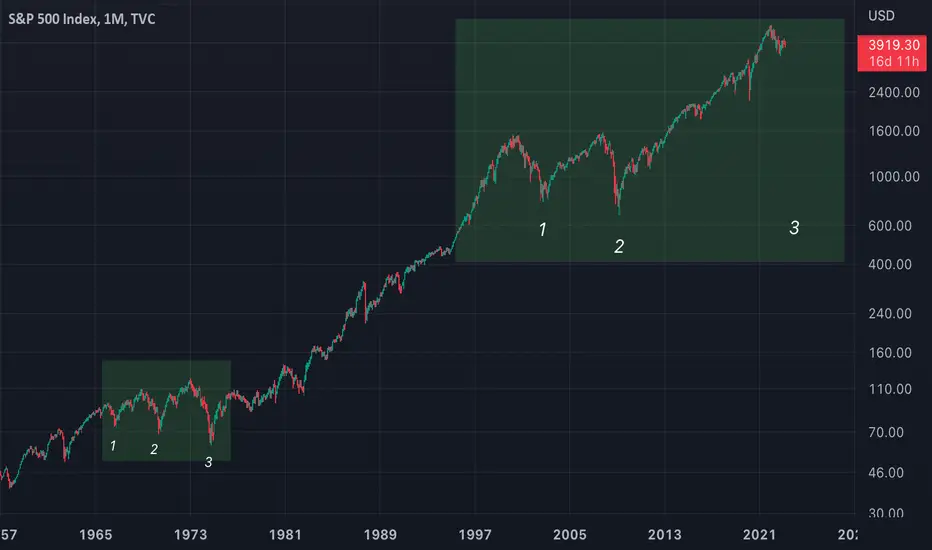
SPX - Pattern ComparisonAgain my Bearish theory behind SPX
1,2,3 comparison Vs a structure that formed way back in the 60's
Simply showing the similarities and possibility that could arise
More informed chart below
SPX - bottom in 2024 (NEW)hi traders!
In September this year we have published a trading idea where we identified the Rising Broadening Wedge on SPX chart, which is a bearish pattern and we predicted more downside to come:
In November we looked at the chart from a different angle and we published the idea where SPX continues the downtrend as it's getting rejected from the downsloping resistance line:
Both publications are still valid and we expect those targets to be reached.
Today, in this trading idea, we would like to show you something very interesting on a monthly time frame.
What you can see on the chart is that:
-Major trendline was acting as a support from the beginning of 2009. It's a very important support as we've never seen a monthly close below this trendline. In 2020 (COVID crash), the price faked out but eventually it closed above the trendline.
-Last retest occured in March/April 2020
-We expect that the next retest of this key trendline will be in 2024 as probably the recession will get worse in 2023 .
On the other hand, we don't expect such a huge drop like in 2008 /2009 when SPX dropped 57 %.
False breakout below the trendline may occur like in 2020 but we believe that a monthly close will be above this major trendline.
2023 and 2024 will be a great time to accumulate stocks (and crypto) at huge discounts. The opportunity will present itself but it's not there yet. Patience is the key.
Do you agree? Will the trendline hold this time?
Or maybe you think that SPX won't retest it in 2023/24 and SPX has already bottomed out?
Share your opinion in the comment section!

S&P500 AND MY THOUGHTKINDLY look at the chart and see my position for this asset.
Bull in a long run


Mini-Rally?Well,
Last week, I was right - until I was wrong.
Thanks to CRM and a Fed Chairman talking about "only a .25 rate hike", the market was behaving as forecasted.\
Why blame CRM? Not only did it manage to pull up on the DJI, it pulled up on the S&P (Since it is calculated into both averages).
So, here we are - new week, new data and the data changed from last week.. What do things look like?
The signal generated is bullish, the forecasts are the coming week is between: (4326 - 4113) with a mean of 4159.
The 5 period Stochastic still isn't showing full upward commitment from the index. This can change this week. The 5 period value still places the index in a position of indecision. It is still unsure of what is it going to do.
The 2 period Stochastic is suggesting it is going to challenge it's 2 period high of 4052. Not a difficult task since the close (4045) is so near to the high.
It is in consolidation between: 4052 and 3928. We know that 4052 is going to be challenged, but the close of the week might return to between these values if a reason to stay above doesn't materialize.
Have you seen the economic situation? When we are grabbing on any good news for a short term rally. I guess the market is hunting the good stuff.
Monthly S/R Range is: 4195 - 3491.
Close was above to 8 period moving average. So prices are at a premium to the 8 week average - a bullish indication of things to come. Yet still at a discount to the 5 week (~1 month) average.
I am still bearish - Need a monthly close above 4195 to change my mind.
However - I am not immune to playing a mini-rally for fun and profits.
If you are playing inverse ETFs, you may get stopped out this week.
Yet, don't give up on the bear. The signs that it has left the market have not appeared yet.
The FED speaks in a couple of weeks. Depending on what is said can break the consolidation. Then we go 2 months without hearing from the FED.
Stay frosty! Keep your stops in place. This is going to be an interesting, if not wild week.
-PriceProphet

US500 to hit the weekly support and then bounceUS500 is on the way to revisit the weekly support zone around 3990. Currently it has hit the daily support but it is likely that it will go and at least touch the weekly support zone. But they both are quite close. That will definitely produce a bounce to the upside and might bring the price to daily resistance level. Let us see if this daily produces enough momentum to lead it to the resistance. But I would incline towards it touching weekly first before heading towards resistance and that would also be favorable for a better entry point and a better RR.

SPX500 BUY SETUP1/9 Risk reward setup
entry : 4063.9
stop loss : 4057.7
take profit : 4120
follow and subcribe if you like my ideas hope you having a good trading

A probable Buy position for S&P 500 This level is critical for S&P 500. It is expected price bounce back to higher level after reaching to this lvl. please risk free ur trade after hitting TP1 and save profit until Tp2
follow me for more trading signals

SPX also showing strong upside to come with a C&H target 4,600Cup and Handle has formed over the last few months.
We have had a break up out of the brim level and now looks like the price wants to bounce and run up further.
This is following onto the long position and update we did with the SPX a few months ago.
As traders we need to adjust course and apply new patterns as they come.
7>21>200
RSI>50
Target 4,600
With the Jobs added better than expected last Friday and with the signs of an economic recovery, The US is showing strong signs of a rally.
This could be before the catalyst for the expected fall.
Regardless, I am bullish for now and the charts don't lie!

SPX 500 LONG ContinuationI am looking at the continuation of SPX500 Long
I believe in the short term we are still very bullish and am looking for a potential 4200 target

$SPY Inverse Head & Shoulders$SPY and other stocks currently have a possible Inverse Head & Shoulders pattern that is playing out right now. I expect to see $450 - $480 by May. We need to break $420 neckline and hold for a weekly close to confirm this.

SPX to find support at previous resistance?US500 - Intraday - We look to Buy at 4081 (stop at 4049)
Previous resistance level of 4141 broken. Majority of the initial daily gains being overturned.
Bespoke support is located at 4047.
The sequence for trading is higher highs and lows.
The bias is still for higher levels and we look for any dips to be limited.
Our profit targets will be 4153 and 4170
Resistance: 4153 / 4194 / 4548
Support: 4047 / 4000 / 3954
Risk Disclaimer
The trade ideas beyond this page are for informational purposes only and do not constitute investment advice or a solicitation to trade. This information is provided by Signal Centre, a third-party unaffiliated with OANDA, and is intended for general circulation only. OANDA does not guarantee the accuracy of this information and assumes no responsibilities for the information provided by the third party. The information does not take into account the specific investment objectives, financial situation, or particular needs of any particular person. You should take into account your specific investment objectives, financial situation, and particular needs before making a commitment to trade, including seeking advice from an independent financial adviser regarding the suitability of the investment, under a separate engagement, as you deem fit.
You accept that you assume all risks in independently viewing the contents and selecting a chosen strategy.
Where the research is distributed in Singapore to a person who is not an Accredited Investor, Expert Investor or an Institutional Investor, Oanda Asia Pacific Pte Ltd (“OAP“) accepts legal responsibility for the contents of the report to such persons only to the extent required by law. Singapore customers should contact OAP at 6579 8289 for matters arising from, or in connection with, the information/research distributed.

SPX500 weekly has just turned bullish$SPX weekly is showing bullish signs.
$AMZN $AAPL $GOOG $GOOGL good earnings can boost the market further.

SPX TOP!! Final leg to 6100 by July 22nd 2024This just lines up so perfect for me. A measured move from the March 2020 lows would be 6100 in July 22nd ish 2024. That would line up with the tops from 1929 and 2001, oh man. At that point I'm selling it all and running for the hills cuz it could get REAL nasty.
