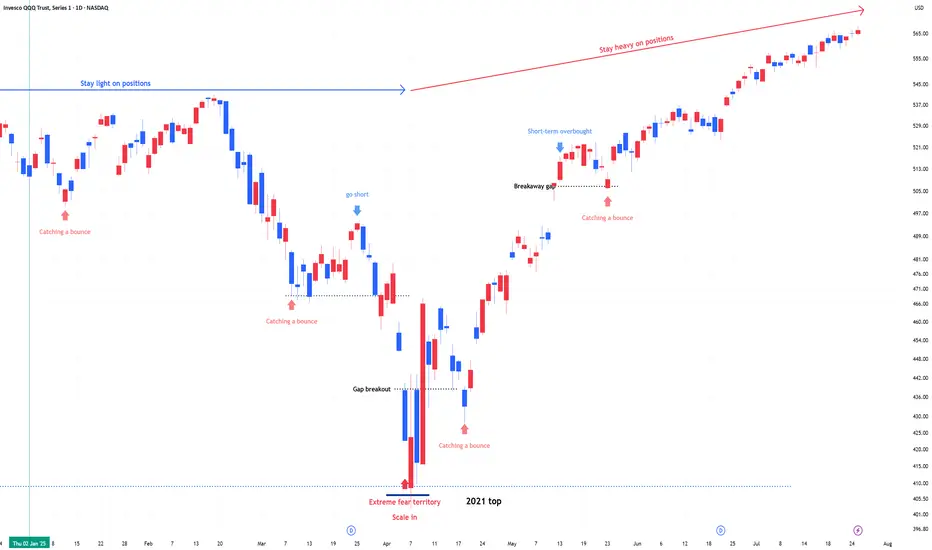
QQQ : Stay Heavy on Positions QQQ, QLD, TQQQ : Stay Heavy on Positions
Amid record-high markets, fear-hedging sentiment is slowly transitioning into renewed risk-taking.
When entering an underweight zone, I rotate out of QLD or TQQQ into QQQ and reduce overall exposure.
Spx500short
S&P 500 (CASH500) - Double Top H1Risk/reward = 2.7
Entry price = 6388.4
Stop loss price = 6399.7
Take profit level 1 (50%) = 6360.4
Take profit level 2 (50%) = 6352
Also, waiting on confirmation on some variables

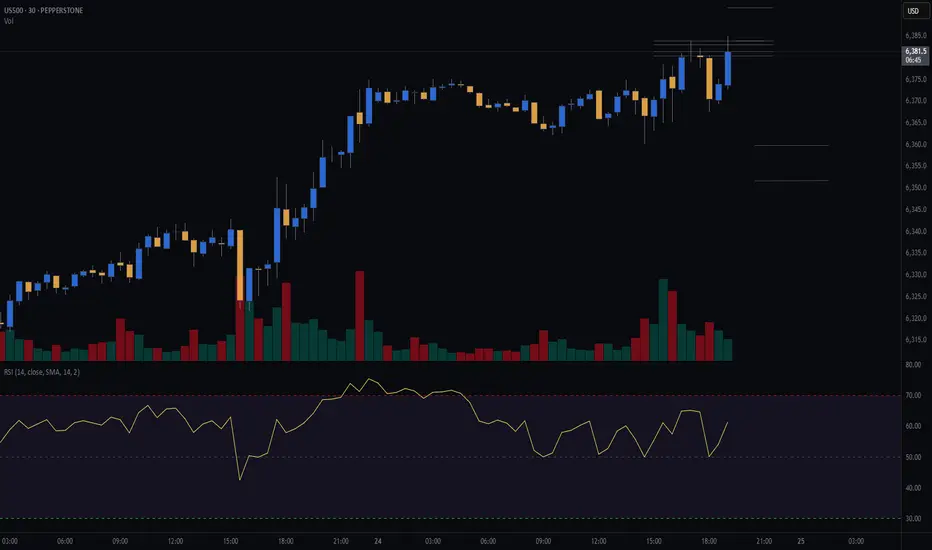
S&P500 (CASH500) SHORT - head and shoulders 30minRisk/reward = 4.1
Entry price = 6378
Stop loss price = 6385.9
Take profit level 1 (50%) = 6349.2
Take profit level 2 (50%) = 6337.2
Still waiting on confirmation of a few variables at close of this 30min candle at 17.00

S&P (CASH500) SHORT - Double top 30minRisk/reward = 2.7
Entry price = 6384
Stop loss price = 6393.8
Take profit level 1 (50%) = 6359.8
Take profit level 2 (50%) = 6351.8
Will get confirmation of remaining variables at close of this 30min candle at 19.30.
S&P 500 (CASH 500) SHORT - Double top H8Risk/reward = 4.1
Entry price = 6343.3
Stop loss price = 6365.3
Take profit level 1 (50%) = 6268.1
Take profit level 2 (50%) = 6232.1
Still waiting on some variables on checklist to be confirmed before I enter the trade.

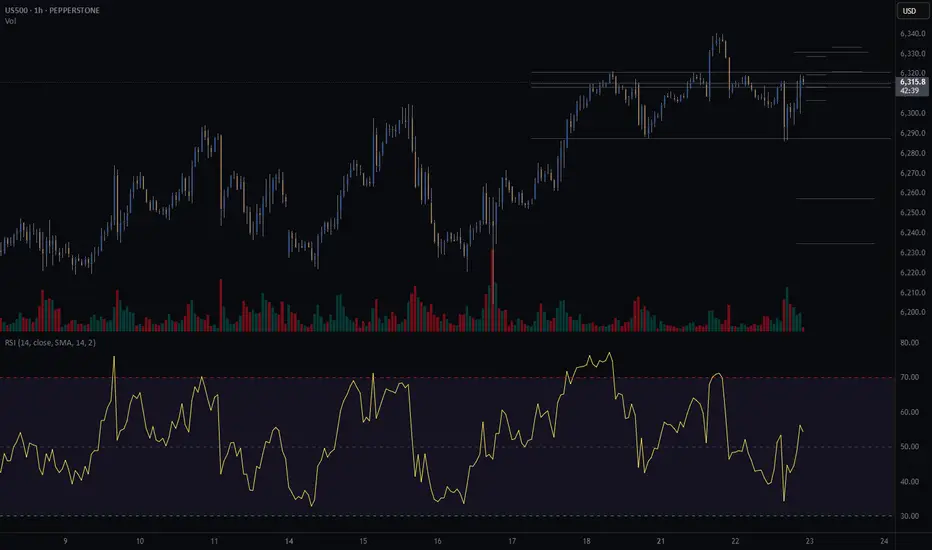
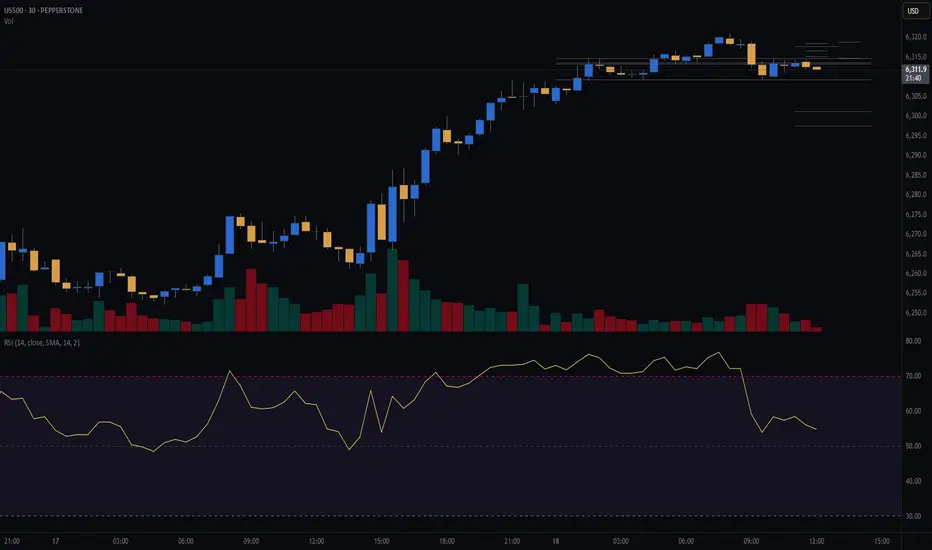
S&P500 (CASH500) SHORT - Head and shoulders Risk/reward = 5.8
Entry price = 6321.1
Stop loss price = 6333.5
Take profit level 1 (50%) = 6257.3
Take profit level 2 (50%) = 6234.9
Still waiting for confirmation on a few variables before I enter the trade.
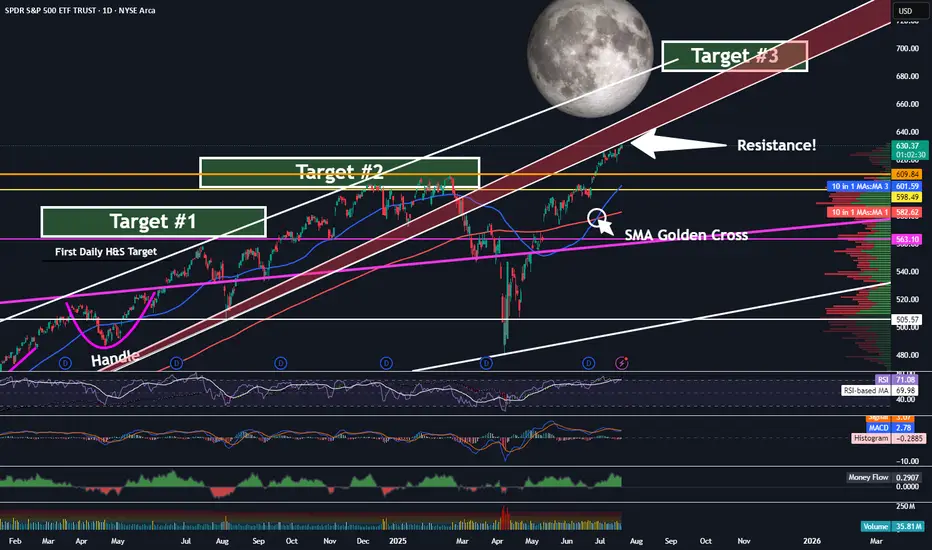
SPY - On Our Way To Target 3 ...But First?Trading Fam,
It's been a while since I updated you all on the SPY, which, as you know, we track closely to help us determine the overall market trend. Since we have now exceeded my Target #2, it's time for me to give you all another update. But first, a little context for my new readers which I have been getting a lot of recently, thanks to my new indicator hitting it out of the park.
So, we began marking targets on our chart here after spotting an inverse H&S on the daily chart a few years ago. Many of my followers back then were doubtful the pattern would fully form, or if it did, that it would actually play out. But the pattern completed about 14 months ago and subsequently broke the neckline in June of last year. I then knew we were going full send and have been predicting a 700 SPY final target since. This target has been made utilizing both that inverse H&S pattern as well as a longer-trend Elliot Wave, which I don't have denoted here at this point. The chart gets too messy with all of my markings. Regardless, we are currently in wave 5 and heading steadily towards that 670-700 target #3, my final target.
But be careful! Today, we have hit the underside of that RED area, which is HUGE resistance. I would expect that we will NOT break straight through this without some pullback prior. Indeed, the market is overextended at this moment, and we'll need the volume to be able to push through. Could this occur? Of course, anything is possible. But, it is not likely right now.
My guess is that we'll at least pull back to one of those levels below us or possibly even re-touch that 200 SMA in red before the final push.
Anyways, it is worth taking note of what may be ahead of us in the next few weeks or months so that you can plan your trades accordingly. Stay with me. We're almost there.
✌️Stew
S&P500 (CASH500) (SPX500) SHORT - Head and shoulders 30minRisk/reward = 3.3
Entry price = 6314.8
Stop loss price = 6318.4
Take profit level 1 (50%) = 6301.3
Take profit level 2 (50%) = 6297.5
Waiting on validation from a few other variables.
For example, waiting for the current 30min candle to close in range.
Letssss goooooo
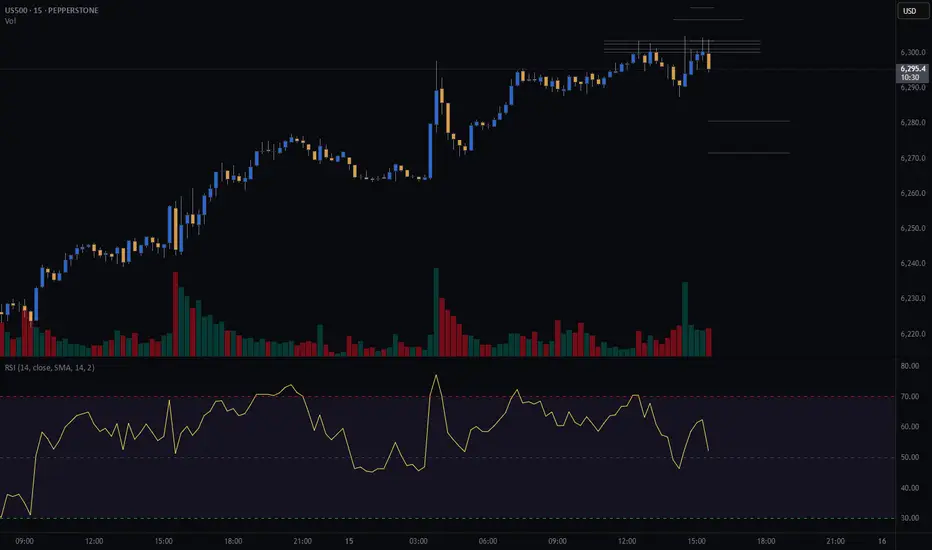
SPX500 Short From Resistance!
HI,Traders !
#SPX500 is trading in an
Uptrend but the price will
Soon hit a horizontal resistance
Area around 6285.44 from
Where we will be expecting
A local bearish correction !
Comment and subscribe to help us grow !

S&P500 (CASh500) Short - double top 15minEntry = 6303.4
SL = 6312.8
Take profit level 1 = 6280.7
Take profit level 2 = 6271.6
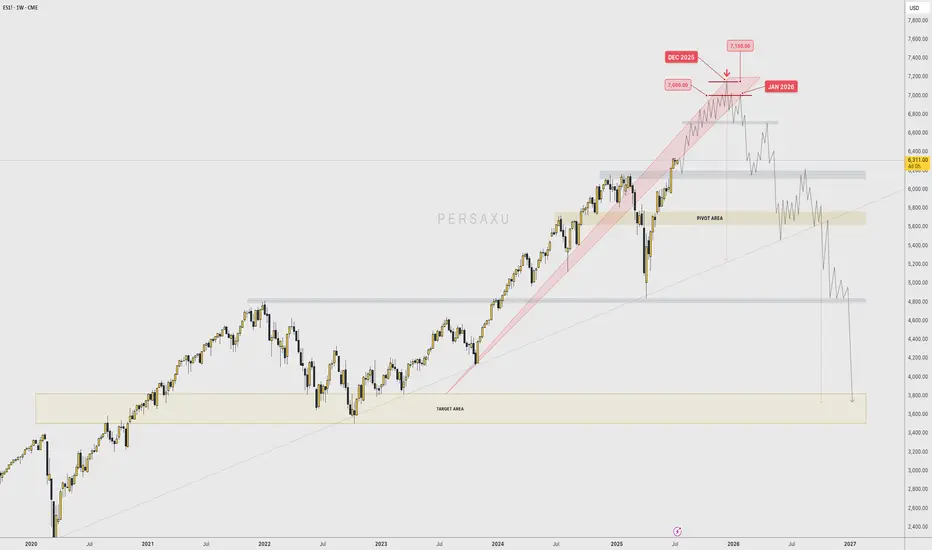
BEAR WITH ME... First of all, I'm getting into the field of other players and trying to call their type of shots.
I don't intend to come across as ignorant when it comes to this market, since I only trade gold and I have seen FOREX traders try to predict gold and get it completely wrong.
I have NO ARGUMENTS WHATSOEVER with which I could back this PREDICTION up; NOT PROJECTION...
As a matter of fact, Technically speaking , the " PROJECTION " would actually be BULLISH , because price is entering a "discovery" phase, In which there is no previous high to "top" a potential impulse with.
When price is making ATH, YOU CAN'T CALL THE TOP UNTIL THE TOP IS FORMED.
That being said, I only want to have this on my profile for personal use and see if my "prediction" comes a reality between December 2025 and February 2026.
--
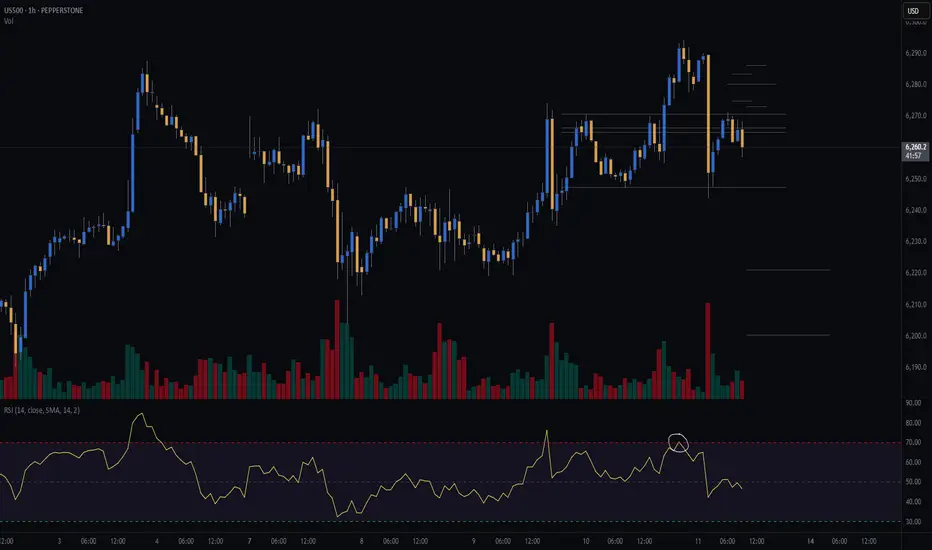
S&P 500 (CASH500) Short - Head and shoulders H1Potential short on S&P 500.
Risk/reward = 3.4
Entry = 6264.9
Stop loss = 6280.3
TP level 1 = 6221.7 (50%)
TP level 2 = 6200.5 (50%)
Need current candle to close back in range at 10.00 for all variables to be met.
Volume exception applied since current candle is the open of European markets.
SPX500 Bearish Breakout!
HI,Traders !
#SPX500 was trading along
The rising support line but
Now we are seeing a bearish
Breakout so we are bearish
Biased and we will be expecting
A further bearish move down !
Comment and subscribe to help us grow !

Low frequency trading (LFT) vs HFTHey fellow tarders and financial mojol,
I've got some insider info that's going to blow your minds! 🤯
According to my top-secret sources (aka my pet parrot who squawks numbers at me), low-frequency trading algorithms have finally figured out the true fair price of the S&P 500. Drumroll, please... It's $550! That's right, folks, all those high-frequency trading bots are currently aiming for this magical number as we speak.
But wait, there's more! The next step in this thrilling financial adventure involves radiowaving all the way down to $400. Yes, you heard it here first. We're talking about some serious next-level trading strategies that involve actual radio waves. Who needs fiber optics when you've got good old-fashioned radio, right?
So, buckle up and get ready for the ride of your life. The market's about to take a trip back to the good old days when $550 was the dream and $400 was just a stone's throw away.
Happy trading, and remember, if your broker gives you weird looks, just tell them you're tuning into the market's frequency! 📡💸

S&P500: Within reachThe S&P 500 has edged past the 88.70% retracement and is now trading within our magenta Target Zone (Coordinates: 5,880 points to 6,166 points). This places magenta wave (B) likely near its peak - a move that could soon give way to a sharper decline as part of the anticipated wave (C). At current levels, the setup remains favorable for initiating short positions. To manage risks, a stop just 1% above the upper boundary of the Target Zone is recommended. If the index breaks above resistance at 6,6675 points, however, we would shift to an alternative interpretation: a bullish continuation in the form of the wave alt.(III) in blaue. We currently assign a 40% probability to this scenario. One final note: the minimum technical requirement for wave (B) has already been fulfilled by the entry into the Target Zone. This means wave (C) could begin any time.
Over 190 precises analyses, clear entry points and defined Target Zones - that's what we do.

SHORT The S&P 500 Index: Not A Bear Market, Just A CorrectionWe are about to witness an inception of bearish action. A correction within a correction.
After 7-April, the Cryptocurrency market started to recover, but the main Altcoins that were growing were all memecoins, and I wondered, "Why are mainly memecoins growing?" I know that when memecoins grow the market is actually bearish on the bigger picture. I shrugged it off and went LONG.
It seems I have an explanation now, this recovery was only a partial recovery or, we are just in front of a classic retrace, a small correction. This means that regardless of how fast and strong it goes the end will result in a higher low, compared to 7-April. This means that the bullish structure will remain intact, but you can't change the fact that strength is not present on this chart.
The SPX is going down next. There two main support levels to consider, you decide which one is the one that you should take. My job is to alert you of the event before it happens, great timing and entry prices, you can take care of the rest.
Thank you for reading.
This is a friendly reminder.
Market conditions can always change.
Namaste.

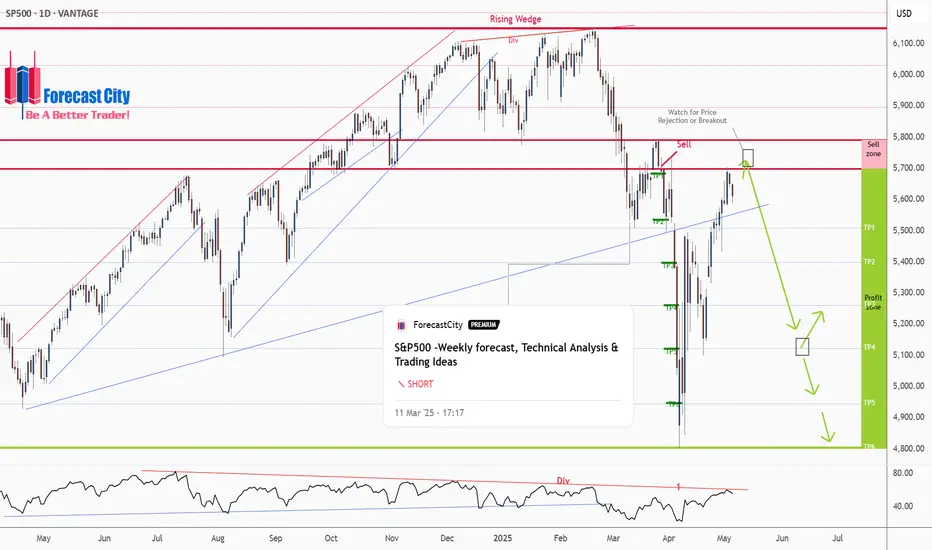
S&P500 -Weekly forecast, Technical Analysis & Trading IdeasPrevious forecast result:
As you can see in the 4CastMachine forecast on 12/03/2025, the price, after rejecting the sell zone, began its sharp decline and touched all TPs.
Midterm forecast:
While the price is below the resistance 6149.57, resumption of downtrend is expected.
We make sure when the support at 4804.01 breaks.
If the resistance at 6149.57 is broken, the short-term forecast -resumption of downtrend- will be invalid. CSEMA:S&P
Technical analysis:
While the RSI downtrend #1 is not broken, bearish wave in price would continue.
A trough is formed in daily chart at 4807.10 on 04/07/2025, so more gains to resistance(s) 5698.65, 5791.00, 5896.50 and maximum to Major Resistance (6149.57) is expected.
Price is above WEMA21, if price drops more, this line can act as dynamic support against more losses.
Relative strength index (RSI) is 55.
Take Profits:
5509.32
5363.90
5261.00
5122.47
4944.41
4804.01
__________________________________________________________________
❤️ If you find this helpful and want more FREE forecasts in TradingView,
. . . . . . . . Hit the 'BOOST' button 👍
. . . . . . . . . . . Drop some feedback in the comments below! (e.g., What did you find most useful? How can we improve?)
🙏 Your support is appreciated!
Now, it's your turn!
Be sure to leave a comment; let us know how you see this opportunity and forecast.
Have a successful week,
ForecastCity Support Team
Little Rest For SPXI think the SPX structure is more prone to bearishness. There is a structure that will probably move quickly in one direction. I don't think a good structure has been formed for a bottom. And the rise does not seem very strong. For this reason, I expect an increase after the first fall.
Since this situation will probably reflect on crypto, my bearish contracts are still in place. But I am thinking of buying a bullish contract until the FOMC time.

S&P 500 records 9 days of gains, longest streak in 20 years🚨S&P 500 records 9th consecutive day of gains, the longest winning streak in over 20 years..
🚨
MartyBoots here , I have been trading for 17 years and sharing my thoughts on ETH here.
SP:SPX
Watch video for more details

The SPX Sell Off at 5500Hi all,
It has been a while since we posted as we waited for a really good trade setup. The SPX is hovering at 5500 and we believe it is the right level to sell.
1) There is a shark pattern at this level
2) RSI is overbought on every time frame except H4 and D1
3) There are smaller patterns to sell
4) There is very strong structural resistance at 5510 to 5520
The first target will be 5306 which has a great risk to reward of 1:5.
We will wait for M15 divergence and a trend line break to enter.

S&P 500 Rally Exhausted? Watch This Level for the Next Drop!The S&P 500 Index( SP:SPX ) has finally touched the Resistance zone($5,680-$5,500) as I expected in my previous post .
The S&P 500 Index is moving near the Resistance zone($5,680-$5,500) , the Resistance line, and Yearly Pivot Point .
Also, we can see the Regular Divergence(RD-) between Consecutive Peaks .
In terms of Elliott Wave theory , it seems that the S&P 500 Index is completing the Zigzag Correction(ABC/5-3-5) , and if the uptrend line breaks , we can confirm the end of the Zigzag correction .
When the S&P 500 Index started to rise on April 22 , Bitcoin also started to rise at the same time , so a decline in the S&P 500 Index can cause Bitcoin ( BINANCE:BTCUSDT ) to decline .
I expect the S&P 500 Index to drop to at least $5,313 AFTER breaking the uptrend line .
Note: If the S&P 500 Index touches $5,712, we can expect more pumps.
Please respect each other's ideas and express them politely if you agree or disagree.
S&P 500 Index Analyze (SPX500USD),2-hour time frame.
Be sure to follow the updated ideas.
Do not forget to put a Stop loss for your positions (For every position you want to open).
Please follow your strategy and updates; this is just my Idea, and I will gladly see your ideas in this post.
Please do not forget the ✅' like '✅ button 🙏😊 & Share it with your friends; thanks, and Trade safe.

S&P500 Index Intraday Trend Analysis for April 23, 2025Market Timing tool signals Bearish Trend for the day and the Sell Signal got confirmed with Stop Loss @ 5471. Trailing Stop Loss for running sell is at 5394. First Target for the bearish trend is at 5318 and if the market moves down further, it may take support at 5173.
It's my view. Traders are suggested to follow technical analysis for trade entries with proper risk management rules.

$S&P500 macro analysis , market approaching correction °•° $SPXHi 👋🏻 check out my previous analysis ⏰ on SP:SPX macro bullish analysis ⏰
As provided it went up up 🚀 completed my target's 🎯 💯💪🏻 ✅ ✔️
Click on it 👆🏻 just check out each and every time updates ☝🏻 ☺️
•••••••••••••••••••••••••••••••••••••••••••••••••••••••••••••••••••••••••••••••••••••••••
NOW I was completely 🐻 BEARISH on the market with in upcoming months SP:SPX
📌 Expecting liquidation pump $6500 - $6700
Invalid 🛑 when complete month close above $6700
¹support - $5500 ( 🎯 ¹ )
²support - $5130 ( 🎯 ² )
🎯 3 ... Will be updated based on market conditions by that time ☺️
📍 A wise 🦉 man said - always having patience " is " always gaining only /-
NASDAQ:TSLA ( i accumulate slowly until it cross above $400 )
rest of stocks i will follow index ☝🏻 i will invest based on market conditions ..... ✔️
