S&P500 got that short so now waiting..So sent this bearish pattern to a friend of mine the other day before it actually to be turned out right, so now I think we are going a for a new low 3.3k seems like coming soon, generally the market is bad, however kind of a bit late to short, so imo cashing out and waiting to long/buy again seems like the way to go and imo 3.2-3.3k seems like the buy zone for me, good luck and merry christmas everyone! :)
Spx500short

SPX Fair Value Ranges - SPX ES1! SPY - Updated 121722Here is a chart that calculates SPX "Fair Value", based off FED Net Liquidity variables. SPY ES1!
Looking to the end of the year 2022 and the start of 2023, here are some SPX target ranges to keep in mind when taking into account the current FED Net Liquidity:
Upper Bound: $4,271.69
Fair Value: $3,921.69
Lower Bound: $3,771.69
If you want a copy of this chart, here is the link to make a copy: 📊👇🏼
SPX Fair Value (FED Net Liquidity)
www.tradingview.com
SPX Net Liquidity Band Indicator via @dharmatechnology8:
www.tradingview.com

SPX low was right at the CPI opening gap candle low (LOD)Needs below today's lows to confirm the move down, then should test low 3800
There is a big SPY put wall at 3800, so I expect it to hold and close around 385 or so

Selling SPX at previous support.US500 - Intraday - We look to Sell at 3918 (stop at 3988)
Trades at the lowest level in 25 days.
The 161.8% Fibonacci extension is located at 3861 from 4140 to 3968.
The medium term bias remains bearish.
Bespoke support is located at 3504.
Our profit targets will be 3745 and 3505
Resistance: 3918 / 3958 / 4140
Support: 3861 / 3746 / 3503
Disclaimer – Saxo Bank Group.
Please be reminded – you alone are responsible for your trading – both gains and losses. There is a very high degree of risk involved in trading. The technical analysis , like any and all indicators, strategies, columns, articles and other features accessible on/though this site (including those from Signal Centre) are for informational purposes only and should not be construed as investment advice by you. Such technical analysis are believed to be obtained from sources believed to be reliable, but not warrant their respective completeness or accuracy, or warrant any results from the use of the information. Your use of the technical analysis , as would also your use of any and all mentioned indicators, strategies, columns, articles and all other features, is entirely at your own risk and it is your sole responsibility to evaluate the accuracy, completeness and usefulness (including suitability) of the information. You should assess the risk of any trade with your financial adviser and make your own independent decision(s) regarding any tradable products which may be the subject matter of the technical analysis or any of the said indicators, strategies, columns, articles and all other features.
Please also be reminded that if despite the above, any of the said technical analysis (or any of the said indicators, strategies, columns, articles and other features accessible on/through this site) is found to be advisory or a recommendation; and not merely informational in nature, the same is in any event provided with the intention of being for general circulation and availability only. As such it is not intended to and does not form part of any offer or recommendation directed at you specifically, or have any regard to the investment objectives, financial situation or needs of yourself or any other specific person. Before committing to a trade or investment therefore, please seek advice from a financial or other professional adviser regarding the suitability of the product for you and (where available) read the relevant product offer/description documents, including the risk disclosures. If you do not wish to seek such financial advice, please still exercise your mind and consider carefully whether the product is suitable for you because you alone remain responsible for your trading – both gains and losses.

SPX so far so good from yesterday's updateI was sleeping in today after my BD celebration yesterday and what a present I got:) The only issue is I didnt short 2am last night as was looking to do it and tweeted about it!
Good I got some of those lotto puts (tweeted yesterday as well)
We got a gap down I was looking for, hope people are not trapped long since yesterday as I warned so many times as well as tweeted!
Now the question if SPX gets below 3832-31, then it should close at the lows and the next support will be at 3808 (target I was looking for for last several days)
Usually these types of moves are ending up with closing at the lows, so if we get a bounce, I will short it to exit either tomorrow am or AHs

SPX Model Trading Plans for THU. 12/15Bull Trap from Last Week Re-testing Key Support
In our last trading plans published on Wed., 12/07, we wrote: "Last two sessions turned the recent spike up into a bull trap. However, our models are indicating that the index is likely to find some support around the 3910-3915 range. Longs might want to wait to see if the index holds this level, and shorts need to be nimble in taking their profits if it does". Our models went into an indeterminate state since then and have come out with some trading levels only this morning.
If you went to sleep after reading our last trading plan and are waking up today, you would not realize that a full week of trading transpired since then, as we are exactly where we were then! The bounce from our published support level proved only short-lived post the FOMC rate decision yesterday, and the index is feeling heavy again. With the key support level of 3900-3910 in the range again, BOTH bulls and bears need to be nimble in any positions they open today, as any bounce or breakdown could be swift and spiky.
Positional Trading Models: Our positional trading models indicate going long on a break above 3955 or 3925 with a 35-point trailing stop and a hard stop on a break below 3940, and going short on a break below 3930 or 3895 with a 40-point trailing stop and a hard stop on a break above 3913. Models also indicate instituting a break-even hard stop once a position gets into a 10-point profit level.
By definition, positional trading models may carry the positions overnight and over multiple days, and hence assume trading an instrument that trades beyond the regular session, with the trailing stops - if any - being active in the overnight session.
Intraday/Aggressive Models: Our aggressive, intraday models indicate the trading plans below for today.
Trading Plans for THU. 12/15:
Aggressive Intraday Models: For today, our aggressive intraday models indicate going long on a break above 3955, 3948, or 3915 with a 9-point trailing stop, and going short on a break below 3940, 3933 or 3910 with a 10-point trailing stop.
Models indicate long exits on a break below 3963, and short exits on a break above 3896. Models also indicate a break-even hard stop once a trade gets into a 4-point profit level. Models indicate taking these signals from 11:01 am ET or later.
By definition the intraday models do not hold any positions overnight - the models exit any open position at the close of the last bar (3:59pm bar or 4:00pm bar, depending on your platform's bar timing convention).
To avoid getting whipsawed, use at least a 5-minute closing or a higher time frame (a 1-minute if you know what you are doing) - depending on your risk tolerance and trading style - to determine the signals.
***** No Idle Analysis-paralysis here! Only actionable trading plans - every morning! And, transparent, verifiable results of each and every trading plan, every night!
LET THE RESULTS SPEAK FOR OUR MODELS! See for yourself how our Morning Trading Plans have been doing for the last one month or one year or since started! *****
NOTES - HOW TO INTERPRET/USE THESE TRADING PLANS:
(i) The trading levels identified are derived from our A.I. Powered Quant Models. Depending on the market conditions, these may or may not correspond to any specific indicator(s).
(ii) The results of these indicated trades would vary widely depending on the timeframe you use (tick chart, 1 minute, or 5 minute, or 15 minute or 60 minute etc), the quality of your broker's execution, any slippages, your trading commissions and many other factors.
(iii) These are NOT trading recommendations for any individual(s) and may or may not be suitable to your own financial objectives and risk tolerance - USE these ONLY as educational tools to inform and educate your own trading decisions, at your own risk.
#spx, #spx500, #spy, #sp500, #esmini, #indextrading, #daytrading, #models, #tradingplans, #outlook, #economy, #bear, #yields, #fomc, #fed, #newhigh, #stocks, #futures, #inflation, #powell, #interestrates, #rates, #earnings, #midterms, #elections, #cpi, #fedpivot, #shortsqueeze, #bulltrap, #fomc

The 4th Horseman of the Apocalypse"When the Lamb broke the fourth seal, I heard the voice of the fourth living creature saying, “Come.” I looked, and behold, an ashen horse; and he who sat on it had the name Death; and Hades was following with him. Authority was given to them over a fourth of the earth, to kill with sword and with famine and with pestilence and by the wild beasts of the earth."
Congratulations. If you've been following my ideas then you've done very well for yourself this. Sadly, all good things must come to an end and we must bring this bull run to a close. However, not without some spectacular fireworks at the end to give everyone hope things are turning around. Overleveraged governments and companies will collapse within the next 3 months causing spillover across the globe, glorious. I'm scaling into puts as we've hit the peak of what should be expected (don't be surprised if we get 400) and am going all in on this play on the 24th. God speed to you all and I hope to see you alive in the apocalypse once the dust has settled.
Previous posts:

SPX re tested broken wedgeThis is a perfect re test of the broken wedge.
No Santa Crappy is coming your way!
Watch for the Grinch train running over bulls into the EYO close
First maj stop is at 3748SPX gap close, ideally this Fri!

Recovery ends in S&P500Time cycle plays a vital role in Neo wave analysis.
Both time and price are the Manthra in Trading.
The ancient Fibonacci and Elliott waves are the only TWO usefull tools foy my analysis both for trading and forecasting.
I find this method of trading which suits me and giving consistency of profits for the past 20 years
ok! S&P500 index almost reached its destination @4048 which is a less than 38.2% of recovery
Black Friday is the turning point ,IF any miracle happens on Monday ,the index surpasses 4088 then we have a different story,
Let's Hope least

SPX /S&P 500 📈Top 3: AAPLE, MSFT, AMZNHi Traders, Investors and Speculators 📈📉
Ev here. Been trading crypto since 2017 and later got into stocks. I have 3 board exams on financial markets and studied economics from a top tier university for a year. Daytime job - Math Teacher. 👩🏫
If you're into stonks, today's update is for YOU. Cryptocurrencies are the largest part of our focus, but that doesn't mean we don't consider other markets suck as Forex, commodities and stocks. So today, let's take a look at the SPX / S&P 500 :
The top 3 stocks in the SPX by weight are :
1) Apple Inc. / AAPLE weighing 6.488138
2) Microsoft Corporation / MSFT weighing 5.52972
3) Amazon.com Inc. / AMZN weighing 2.386112
To put it into perspective, number 500 on the list is DaVita Inc. / DVA weighing only 0.012525. (There are actually 503 stocks in the S&P500).
From the above, we can clearly conclude that what happens in those 3 markets, especially AAPLE, holds quite a lot more weight than the rest. Taking a look at AAPLE from a Macro perspective, the chart seems to be in trouble. A very clear Wyckoff Distribution Phase is about to form:
On the Microsoft chart, thins are not looking rosy either. Infact, it seems as though we have just finished the low volume rally, meaning distribution phase in full force is up next:
AMZN is the only chart of the Top 3 lookin remotely bullish, seeming to have completed a full Wyckoff Method Cycle. Next up would be accumulation phase which involves range bound or sideways trading :
The S&P 500 index is a great way to diversify your portfolio and so manage your risk. It consists of most (but not all) of the largest companies in the United States. The S&P market cap is 70% - 80% of the total US stock market capitalization. It is a commonly used benchmark for stock portfolio performance in the US and abroad. Beating the performance of the S&P with less risk is the goal of nearly every portfolio manager, hedge fund and private investor/speculator.
Interested in Cryptocurrencies? Check out this bullish idea on Litecoin :
_______________________
📢Follow us here on TradingView for daily updates and trade ideas on crypto , stocks and commodities 💎Hit like & Follow 👍
We thank you for your support !
CryptoCheck

Estimated Path To Next SummerFull analysis to follow with specific near-term levels. Prior Intermediate 5 did not move as expected so that likely puts us inside of Primary wave B heading down. Early estimates have us in
Primary B
Intermediate A
Minor 3
Minute 2
This means wave 3 of 3 is next with the inflation report tomorrow morning. Early signs per this would have November inflation hotter than expected. Fed also determines next rate hike on Wednesday. Looks like first near-term bottom could be prior to Christmas followed by highs after New Year while most of January points down. The January bottom should hold for quite some time as we should rally after the late January low until the early summer. The final downturn is still slated to begin in early to mid summer for northern hemisphere folks. Early estimates still place the final bottom around 2200-2400 by March 2025.

40 Bar Cycle Chart - S&P 500 SPY SPX ES - Updated 121022 Given that we are headed into the release of the November Consumer Price Index this upcoming (Tuesday, December 13th ) and also the December Federal Reserve Interest Rate Decision (Wednesday, December 14th) , are markets set up for another short opportunity into the end of January (Q1)?
SPY Daily Chart Template
www.tradingview.com
Which camp are you in on the short-term (end of year into Q1/23') direction of markets?
Camp A: We are likely we headed for new lows in Q1/23 (Fluctuating Inflation + Persistent Price/Wage Pressures + Hawkish FED).
Camp B: We are likely to break the downtrend into the start of Q1/23' (Peak Inflation + Deflationary Forces + Dovish FED).
Let me know your prediction in the comments below!

SPX is getting close to its targetNothing has changed, SPX is on the way to its target zone
I wanted a good gap up and crap from there, but we got completely the opposite.
Waiting patiently to enter with short position at 4007-20SPX zone
I havent traded much today, want to short, but this can continue squeezing on low vol

S&P 500 3D. Interesting waiting. Hi. As usual, I am looking at the SPX to understand the underlying market sentiment.
It should drop lower. We have some symptoms on the 3 day chart.
I can only imagine the bloodbath that will ensue for altcoins.
We will talk a little later about possible consolidation levels.

R.I.P. The S&PAs you can see, History repeats itself. To my technical eye, The S&P is loosing momentum at a price of major resistance AND(+) a Major trend line where price has previously ended its bull rally to return to its overall bear market downtrend. Second possibility attached. I see The S&P returning to the 350's if not much much lower. Its divergent sister, the VIX is showing similar confluence because it is also at a price area of major lows where it has previously reversed overall direction longterm. I see The VIX returning to 34.32.

Look where we hit bounced off todayDidnt see this yesterday, this makes today's rejection off the top a possible indicator of the price going down to test low 3900
Careful if long!

SPX is at support levelNothing much to add since yesterday's updates.
Im looking up for a breakdown trendline test. If its very bearish, then it can just get to 3965-70SPX and stop there.
That would mean much lower levels are coming this month!
Ideal pathway is to test 4k level and reverse down. That would be your shorting opportunity
The whole move off CPI will be erased next!
If it happens before the CPI on the 13th, be ware of a move down to 3400-3500!!!
So be careful if long here! especially if we stop at 3970SPX

SPX Model Trading Plans for WED. 12/07Fed Pivot Hope Turned Into a Bull Trap; Approaching Support
In our trading plans published post-NFP on Fri., 12/02, we wrote: "After 20 days of meandering around 3950/4000 level, the index rocketed out of the range to a session high of 4093.50 on the FOMC day, 11/30/22. This morning's Non Farm Payrolls data could be suggesting that it could potentially be an "irrational exuberance", and the futures' reaction so far post-NFP points to this proving to be the case. Of course, how the index trades in the regular session and how it closes today will hold further clues to this".
Last two sessions turned the recent spike up into a bull trap. However, our models are indicating that the index is likely to find some support around the 3910-3915 range. Longs might want to wait to see if the index holds this level, and shorts need to be nimble in taking their profits if it does.
Positional Trading Models: Our positional trading models went into today's regular session with a short opened on Monday, 12/05, at 4014.57 with a 38-point trailing stop which was tightened to a 33-point trailing stop on Tue, 12/06. This trail from yesterday's low of 3918.39 was hit at 3951.39 within the first ten minutes of today's open, closing out the short with a gain of 73.18 index points. Models indicate staying flat until posted otherwise.
Positional Models assume that we are trading an instrument that trades the futures hours, with the trailing and other stops effective overnight.
Intraday/Aggressive Models: Our aggressive, intraday models indicate the trading plans below for today.
Trading Plans for WED. 12/07:
Aggressive Intraday Models: For today, our aggressive intraday models indicate going long on a break above 3948, 3931, or 3912 with a 9-point trailing stop, and going short on a break below 3926 or 3908 with a 10-point trailing stop.
Models indicate long exits on a break below 3958, and short exits on a break above 3893. Models also indicate a break-even hard stop once a trade gets into a 4-point profit level. Models indicate taking these signals from 01:01 pm ET or later.
By definition the intraday models do not hold any positions overnight - the models exit any open position at the close of the last bar (3:59pm bar or 4:00pm bar, depending on your platform's bar timing convention).
To avoid getting whipsawed, use at least a 5-minute closing or a higher time frame (a 1-minute if you know what you are doing) - depending on your risk tolerance and trading style - to determine the signals.
***** No Idle Analysis-paralysis here! Only actionable trading plans - every morning! And, transparent, verifiable results of each and every trading plan, every night!
LET THE RESULTS SPEAK FOR OUR MODELS! See for yourself how our Morning Trading Plans have been doing for the last one month or one year or since started! *****
NOTES - HOW TO INTERPRET/USE THESE TRADING PLANS:
(i) The trading levels identified are derived from our A.I. Powered Quant Models. Depending on the market conditions, these may or may not correspond to any specific indicator(s).
(ii) The results of these indicated trades would vary widely depending on the timeframe you use (tick chart, 1 minute, or 5 minute, or 15 minute or 60 minute etc), the quality of your broker's execution, any slippages, your trading commissions and many other factors.
(iii) These are NOT trading recommendations for any individual(s) and may or may not be suitable to your own financial objectives and risk tolerance - USE these ONLY as educational tools to inform and educate your own trading decisions, at your own risk.
#spx, #spx500, #spy, #sp500, #esmini, #indextrading, #daytrading, #models, #tradingplans, #outlook, #economy, #bear, #yields, #fomc, #fed, #newhigh, #stocks, #futures, #inflation, #powell, #interestrates, #rates, #earnings, #midterms, #elections, #cpi, #fedpivot, #shortsqueeze, #bulltrap, #nfp, #nonfarmpayrolls, #jobs, #pmi, #ism

SPY SPX Short? S&P 500Quick look at the S&P500 SPY
Technical is working great on this one.
We are clearly in a rising wedge, unclosed gap, and RSI divergence. Many things are working against us.
Chart:
- Rising Wedge, will break into down side on a 1H
- Unclosed gap at $380
- RSI divergence and shows bearish trend.
Will we test $380?


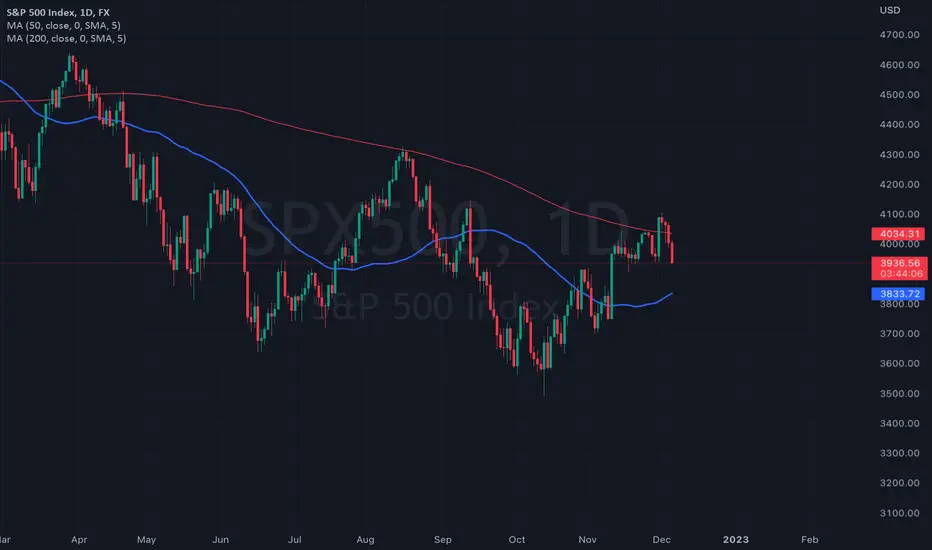
SPX500 kisses 200 MA for the third timeS&P 500 reverses from 200 MA for the third time.
Bear market continues..🧸
$SPX $SPY
SPX Model Trading Plans for TUE. 12/06Fed Pivot Hope Turning Into a Bull Trap Nightmare? Day 3
In our trading plans published post-NFP on Fri., 12/02, we wrote: "After 20 days of meandering around 3950/4000 level, the index rocketed out of the range to a session high of 4093.50 on the FOMC day, 11/30/22. This morning's Non Farm Payrolls data could be suggesting that it could potentially be an "irrational exuberance", and the futures' reaction so far post-NFP points to this proving to be the case. Of course, how the index trades in the regular session and how it closes today will hold further clues to this".
Yesterday morning's hotter than expected ISM numbers, the post-PMI reaction, and this morning's market action so far are all lending more plausibility to our hypothesis that the recent spike up could be turning into a bull trap. The price action today and tomorrow could give us a confirmation. Bulls need to be cautious, and bears need to be nimble.
Positional Trading Models: Yesterday's published positional models closed 6.51 points in gains and went into the close with an open short at 4014.57 and a 38-point trailing stop. For today's session, models indicate tightening the trailing stop to 33-points. If stopped out, the models will stay flat for the rest of the session.
Intraday/Aggressive Models: Our aggressive, intraday models indicate the trading plans below for today.
Trading Plans for MON. 12/05:
Aggressive Intraday Models: For today, our aggressive intraday models indicate going long on a break above 4052, 4028, or 4003 with a 9-point trailing stop, and going short on a break below 4048, 4024, or 4000 with a 10-point trailing stop.
Models indicate long exits on a break below 4064, and short exits on a break above 3992. Models also indicate a break-even hard stop once a trade gets into a 4-point profit level. Models indicate taking these signals from 11:01 am ET or later.
By definition the intraday models do not hold any positions overnight - the models exit any open position at the close of the last bar (3:59pm bar or 4:00pm bar, depending on your platform's bar timing convention).
To avoid getting whipsawed, use at least a 5-minute closing or a higher time frame (a 1-minute if you know what you are doing) - depending on your risk tolerance and trading style - to determine the signals.
***** No Idle Analysis-paralysis here! Only actionable trading plans - every morning! And, transparent, verifiable results of each and every trading plan, every night!
LET THE RESULTS SPEAK FOR OUR MODELS! See for yourself how our Morning Trading Plans have been doing for the last one month or one year or since started! *****
NOTES - HOW TO INTERPRET/USE THESE TRADING PLANS:
(i) The trading levels identified are derived from our A.I. Powered Quant Models. Depending on the market conditions, these may or may not correspond to any specific indicator(s).
(ii) The results of these indicated trades would vary widely depending on the timeframe you use (tick chart, 1 minute, or 5 minute, or 15 minute or 60 minute etc), the quality of your broker's execution, any slippages, your trading commissions and many other factors.
(iii) These are NOT trading recommendations for any individual(s) and may or may not be suitable to your own financial objectives and risk tolerance - USE these ONLY as educational tools to inform and educate your own trading decisions, at your own risk.
(iv) Positional Models assume that we are trading an instrument that trades the futures hours, with the trailing and other stops effective overnight.
#spx, #spx500, #spy, #sp500, #esmini, #indextrading, #daytrading, #models, #tradingplans, #outlook, #economy, #bear, #yields, #fomc, #fed, #newhigh, #stocks, #futures, #inflation, #powell, #interestrates, #rates, #earnings, #midterms, #elections, #cpi, #fedpivot, #shortsqueeze, #bulltrap, #nfp, #nonfarmpayrolls, #jobs, #pmi, #ism

SPX Huge Short incomingLooking for the benchmark index to go up a little more in to the 4hr poi and daily descending trendline resistance before dropping to make new lows.
Mid to end of November should mark the start of a new and more aggressive downwards movement where we could see price reach the 2750 level.
This is a very important level as it represents the 50% from ATHs and the 08/09 financial crisis where we saw unprecedented drops.
Once we reach this level and rebalance the COVID-19 crash, I'd start looking to hedge buys into the market.
