S&P 500 Index Under Pressure – Another -10% Drop Incoming?Today, I want to analyze the S&P 500 Index ( FOREXCOM:SPX500 ) for you. This index is one of the most important indices in the US stock market , which has been determining the direction of parallel financial markets such as crypto and especially Bitcoin ( BINANCE:BTCUSDT ) for the past few days, so an analysis of this index can be important for us.
The S&P 500 Index started to fall after Donald Trump imposed new tariffs on countries around the world, which was like a coronavirus .
The question is whether this fall is temporary or will continue . To answer this question, we need to consider many parameters, but if we look at the sds chart from a technical analysis chart , we can expect a further decline .
The S&P 500 Index is moving near the Resistance zone($5,284-$5,095) and is completing a pullback . It also lost its important Uptrend lines last week, which is not good news for the S&P 500 Index and US stocks .
From an Elliott wave theory , the S&P 500 IndexS&P looks like it has completed the main wave 4 , and we should expect the next decline(-10%) .
I expect the S&P 500 Index to attack the Heavy Support zone($4,820-$4,530) at least once more. The area where we can expect the S&P 500 Index to pull back is the Potential Reversal Zone(PRZ) .
What do you think? Will the S&P 500 Index continue its downward trend, or was this decline temporary?
Note: If the S&P 500 Index touches $5,408, we can expect further Pumps.
Note: There is a possibility of a Bear Trap near the Heavy Support zone($4,820-$4,530) and PRZ.
Please respect each other's ideas and express them politely if you agree or disagree.
S&P 500 Index Analyze (SPX500USD),4-hour time frame.
Be sure to follow the updated ideas.
Do not forget to put a Stop loss for your positions (For every position you want to open).
Please follow your strategy and updates; this is just my Idea, and I will gladly see your ideas in this post.
Please do not forget the ✅' like '✅ button 🙏😊 & Share it with your friends; thanks, and Trade safe.
Spx500short

Island Bottom CONFIRMED on $SPY IF we GAP up tomorrow!Island Bottom CONFIRMED on AMEX:SPY SP:SPX IF we GAP up tomorrow!
I only believe we can GAP up tomorrow if there is news of China coming to the negotiation table with the U.S. after they raise the Reciprocal Tariffs to 104%.
If this doesn't happen, then this isn't confirmed, and we see a retest of $482, IMO!
I'm not playing this as a trade until we get confirmation! Too dangerous!
Not financial advice

Bulls are not of the woods, not by far1. What happened yesterday?
In my weekend analysis covering US indices , I mentioned that US500 (SP500) could drop and test the ascending trend line starting back at the pandemic low. This line is confluent with the horizontal support level given by January 2022 ATH, offering a good opportunity for traders to open long positions.
Indeed, at least on CFDs and futures, this trend line was touched, and the price rebounded strongly from there.
2. Key Question:
Will we have a full V-shape recovery, or will the price drop back below 5k in the coming sessions?
3. Why I expect a continuation of the correction:
🔸 Strong Resistance: The US500 has established a robust ceiling around the 5350-5400 zone(also a gap there)
🔸 Lack of Building Momentum on Support: There's no clear indication that this resistance will be broken anytime soon with the lack of accumulation under 5k
🔸 Potential for Further Decline: Given the current market structure, a drop below 5k remains a realistic possibility in the upcoming sessions.
4. Trading Plan:
🎯 My Strategy: Playing the range.
✅ Buy near the 4800 support.
✅ Sell into the resistance zone between 5350 and 5400.
5. Conclusion:
I’m watching for market confirmations and will continue applying this range strategy until there’s a clear directional change. 🚀
Disclosure: I am part of Trade Nation's Influencer program and receive a monthly fee for using their TradingView charts in my analyses and educational articles.

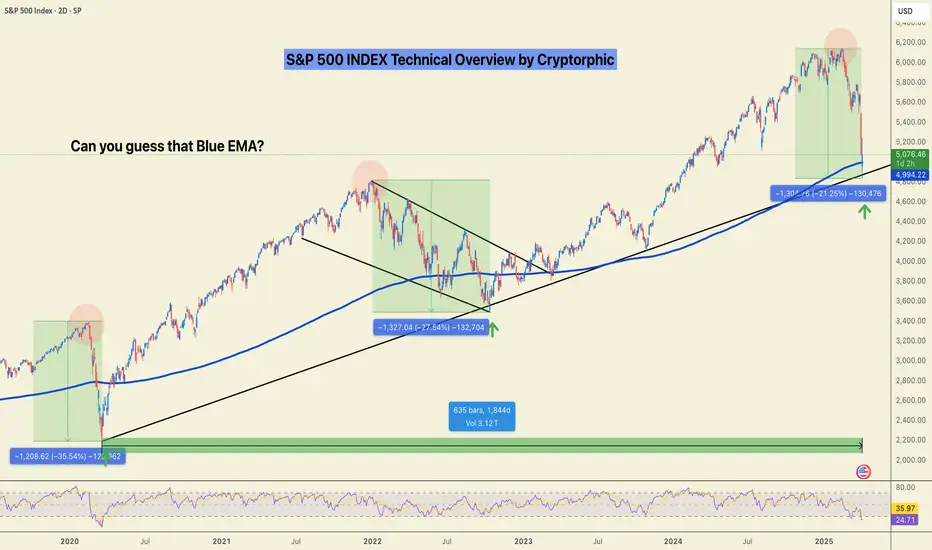
S&P 500: Valuation Correction or the Start of a Breakdown?Valuation Correction or the Start of a Breakdown?
Zoom out. Clear the noise.
We might still sweep the lows, but when viewed on the weekly timeframe, this current S&P 500 move looks more like a healthy valuation correction than a structural breakdown.
Let’s break it down by the numbers using fractal analysis:
🟩 March 2020 (COVID Crash):
▪️~35% drop
▪️V-shaped recovery
▪️Oversold RSI bounce
🟨 2022 Bear Market:
▪️~27% correction
▪️Multi-month wedge consolidation
▪️Eventually led to an upside breakout
🟦 Now (2025):
▪️~21% correction so far
▪️Retesting long-term trendline
▪️RSI in familiar oversold zone
📊 Fractal Math:
- From 35% to 27% = 22.86% decrease
- From 27% to 21% = 22.22% decrease
Both legs show a consistent ~22% drop in correction depth suggesting bearish momentum is weakening with each cycle. Currently bouncing off the1844 days of support.
Is this the bottom? Will there be relief?
🔁 If this pattern holds:
- We could see a short-term sweep or deviation under recent lows.
- But structure favours a potential recovery from this zone, unless the trendline breaks decisively.
📌 Watch levels closely. Timing matters.
🧠 What’s your take, is this another “buy the dip” moment?
Do hit the like button if you liked this update and share your views in the comment section.
Head & Shoulder Breakdown: Will S&P 500 Drop Another 10%?● The S&P 500 has experienced significant volatility recently, mainly due to President Donald Trump's announcement of new tariffs.
● On April 3, 2025, the index saw a nearly 5% drop, its worst single-day loss in five years.
● The recent price action suggests that the index has broken below the neckline of the Head and Shoulder pattern, indicating a potential continuation of the downward trend.
◉ Key support levels to watch
● 1st Support - 5,200 - 5,250
● 2nd Support - 4,950 - 5,000

SPX to find sellers at previous resistance?SPX500USD - 24h expiry
Daily signals are bearish.
Short term bias has turned negative.
Previous resistance located at 5700.
20 1day EMA is at 5699.8.
5705.4 has been pivotal.
We look to Sell at 5699.5 (stop at 5743.5)
Our profit targets will be 5585.5 and 5565.5
Resistance: 5630.0 / 5658.9 / 5700.0
Support: 5602.4 / 5564.3 / 5495.3
Risk Disclaimer
The trade ideas beyond this page are for informational purposes only and do not constitute investment advice or a solicitation to trade. This information is provided by Signal Centre, a third-party unaffiliated with OANDA, and is intended for general circulation only. OANDA does not guarantee the accuracy of this information and assumes no responsibilities for the information provided by the third party. The information does not take into account the specific investment objectives, financial situation, or particular needs of any particular person. You should take into account your specific investment objectives, financial situation, and particular needs before making a commitment to trade, including seeking advice from an independent financial adviser regarding the suitability of the investment, under a separate engagement, as you deem fit.
You accept that you assume all risks in independently viewing the contents and selecting a chosen strategy.
Where the research is distributed in Singapore to a person who is not an Accredited Investor, Expert Investor or an Institutional Investor, Oanda Asia Pacific Pte Ltd (“OAP“) accepts legal responsibility for the contents of the report to such persons only to the extent required by law. Singapore customers should contact OAP at 6579 8289 for matters arising from, or in connection with, the information/research distributed.

A short on S&P at 5770S&P has been moving up quick strongly over the past few days. It has reached a level that is a strong resistance and we will show this pair today.
1) There is deep crab pattern
2) H1 is overbought
3) There is RSI divergence on M15, M30 and H1
We will take profit when RSI is oversold.

EURUSD TECHNICAL ANALYSIS FOCOUS ON KEY POINTS , EUR POSSIBLEhis chart is a technical analysis of the EUR/USD currency pair on a 1-hour timeframe, featuring several indicators and annotations. Here's a breakdown of what it means:
Key Features of the Chart:
Support & Resistance Levels:
The black horizontal lines indicate important support and resistance levels.
Support: Around 1.08739 (marked with a black line).
Resistance: Around 1.09491 (upper blue zone).
Fibonacci Circles:
The red and blue circular patterns in the middle of the chart suggest Fibonacci time and price levels.
These are used to predict potential reversal points or price movements.
Supply & Demand Zones:
Blue shaded areas indicate resistance (supply zones) where price previously reversed.
The price may react again when reaching these levels.
Candlestick Patterns & Trend Lines:
A previous rejection at the upper blue zone (left side) led to a strong downtrend.
The blue diagonal trendline suggests previous bullish momentum.
Forecasted Price Movement:
The blue arrow suggests an expected bullish move toward the 1.09491 resistance level.
The setup suggests a buy trade with a stop loss around 1.08931 and a target near 1.09491.
Conclusion:
This chart suggests a potential bullish move in EUR/USD, with an expected rise toward 1.09491 if it breaks the resistance near 1.09104. However, if it fails, it could drop back to the 1.08739 support level.
Would you like further analysis or clarification on any aspect? 🚀

SPX500 Bearish Breakout!
HI,Traders !
SPX500 is going down
And the Indice made a bearish
Breakout of the key horizontal
Level of 5938.38 and the
Breakout is confirmed so we
Are bearish biased and we
Will be expecting a further
Bearish move down!
Comment and subscribe to help us grow !

S&P 500 BREAKOUT?! 18.2.25Simple as can be.
1. November 2024 - Feb 2025 wedge pattern, converging support and resistance with higher highs and lows.
2. Descending trend-lines within the wedge, first line broken Jan 16th (highlighted) - 3% jump in 3 days of trading, second line broken today, Feb 18th.
3. Potential rise to the top of the wedge pattern, around the mid 6300's.
Stay logical, with a plan and consistent.
Fortune favors the brave!

SPX Ready to pop? The pressure is buildingSPX Ready to Pop? The Pressure Is Building… | SPX Market Analysis 13 Feb 2025
The market is wound up tighter than a coiled spring, and I’m starting to wonder what will finally trigger the next move.
From a commentary standpoint, this is snooze-worthy—but from a trading standpoint, the Theta burn is quietly adding pennies to our pockets. Even if the market isn’t moving, we’re still getting paid.
Let’s break it down…
📉 SPX is Stuck – But That’s Not a Bad Thing
The market has been compressing into a tighter range, creating a pressure buildup that could snap in either direction. While traders watching for big swings are frustrated, we’re happily raking in Theta decay.
💰 Theta Burn – The Secret to Profiting in a Boring Market
In choppy or sideways conditions, directional traders get wrecked
But income traders get paid to wait, thanks to option decay
Every day that passes without a move = profits added to our pockets
📌 Overnight Futures – Still No Directional Clues
The futures market isn’t offering any strong signals 📉📈
Price compression continues, across all indexes
🚀 What Happens Next?
Eventually, this coiled spring will snap—we just don’t know when
The key is patience—we don’t need a big move to win
Whether SPX explodes up or down, we’ll be ready 💡
📌 Final Takeaway?
Sideways markets may be boring to talk about, but for income traders, they’re a steady payday. The key is knowing how to extract profits while waiting for the breakout.
Fun Fact:
📢 Did you know? The longest sideways market in history lasted nearly 17 years (1966–1982).
💡 The Lesson? Even in extended choppy periods, there are ways to profit—as long as you have the right strategy.

Sideways Markets? Heres why Im still getting paidSideways Market? Here’s Why I’m Still Getting Paid | SPX Market Analysis 12 Feb 2025
The markets may be moving like molasses, but that’s no problem when you’re getting paid to wait. While others are watching charts in frustration, our Theta decay is quietly dripping profits into our accounts. No rush, no panic—just letting the market do its thing while we collect.
Let’s break it down…
---
SPX Deeper Dive Analysis:
📉 Markets Are Moving Sideways—And That’s OK
SPX is stuck in a range, drifting aimlessly while traders wait for direction. But unlike those who need a big breakout to make money, we’re already profiting while standing still.
💰 Theta Decay – The Power of Getting Paid to Wait
While the market meanders, options lose value
That lost value turns into profits for our income trades
Instead of hoping for a massive move, we collect steady gains
📌 The Current Market View
We still anticipate a move from the upper range to the lower range 📉
No need to force trades—our edge is patience
If SPX moves, great. If not, we still win
🔑 Why Income Trading Wins in a Sideways Market
Unlike traditional trading methods where:
❌ You need a strong directional move to profit
❌ You rely on timing the market perfectly
❌ You risk getting stopped out too soon
We simply:
✅ Let Theta decay work in our favour
✅ Profit even when the market goes nowhere
✅ Have time on our side—no need for constant action
📌 Final Takeaway?
The market may be stuck, but profits aren’t. Theta is working, our positions are intact, and there’s no stress—just steady gains.
---
Fun Fact:
📢 Did you know? The S&P 500 has spent nearly 80% of its time trading sideways rather than trending up or down.
💡 The Lesson? The market isn’t always moving—but smart traders don’t need it to. That’s why income trading thrives when others struggle.

The S&P sell before the NFPWe are expecting a drop in the S&P later tonight based on what the charts are telling us.
1) The high of S&P is at 6118 and 6130.
2) There is a pattern to sell at the current level of 6080.
3) Yesterday's high to resist the trade.
4) H1 divergence present as well
The optimistic target is 5930 (1:3 risk to reward). We will monitor and post updates here as the trade moves.

Bearish Bias Locked int - Now We wait for the dropBearish Bias Locked In – Now We Wait for the Drop | SPX Market Analysis 11 Feb 2025
The bullish chapter is closed, and our focus is now entirely bearish as we eye a move toward 5980. Futures are already pointing lower, teasing a 20-point drop at the open.
Will we get the full range move, or will SPX keep stalling?
Either way, we’re locked and loaded—now, we wait for the market to tip its hand.
---
SPX Deeper Dive Analysis:
📉 Bearish Positions Locked In
SPX is now fully bearish, with bullish trades wrapped up profitably or at break-even following the bear turn signal. This continues to aligns perfectly with our 6 money-making patterns, where we expect a move from range highs to range lows.
📊 Futures Hint at a Lower Open
Overnight futures are already down 20 points, suggesting:
✅ A weaker SPX open
✅ A potential move toward 5980
✅ Confirmation that momentum is shifting lower
🔍 ADD Still Has Room to Fall
Yesterday’s ADD reading hit the upper bullish extreme
That leaves plenty of downside wiggle room
If ADD pushes lower, indexes could also follow through
⏳ For Now, It’s a Waiting Game
The bearish setup is in place
Price action will dictate the next move
A clean range move to 5980 remains the primary target
🚀 Key Takeaway? The market is aligning with expectations, but we still need follow-through to lock in profits.
Fun Fact:
📢 Did you know? In 1987, the Dow dropped 22.6% in a single day—the biggest percentage crash in history. That’s the equivalent of the S&P 500 dropping over 1,000 points today!
💡 The Lesson? Even in structured markets, major moves can happen fast. This is why having a rule-based trading system keeps you ahead of the chaos.

Monday sell Off? History May Repeat Itself...Monday Sell-Off? This Setup Says It’s Coming... | SPX Market Analysis 10 Feb 2025
Another week wraps up, and as I eye Monday’s open, I can’t shake a sense of déjà vu.
The last two weeks started with a gap down, followed by a bearish finish into the weekend.
Super Bowl Sunday is also here – Can the Kansas City Chiefs complete an unprecedented three-peat in Super Bowl 59 or will the Philadelphia Eagles gain revenge? Just like the markets, only time will tell and we will have to wait and see.
That said, Friday’s setup is setting the stage for another pop ‘n drop. The only question? What triggers the fall this time?
...
SPX Deeper Dive Analysis:
📉 Mondays Have Been Bearish – Will This One Be Too?
The last two Mondays started with a gap down, followed by a bearish move into the weekend. If the pattern holds, next week could open with a bang – but not necessarily to the upside.
🏈 Super Bowl & The Markets – A Perfect Parallel?
The markets are playing their own Super Bowl showdown. Will the bulls make a comeback, or will the bears crush their hopes yet again? Just like the Chiefs vs. Eagles, we can only wait and see.
🔻 Friday’s Bearish Setup – A Warning Sign?
- V-shaped reversal entry ✅
- Bearish pulse bar confirmation ✅
- Similar daily bar pattern to the last two Fridays ✅
📌 So What Happens Monday?
If history repeats itself, we could see:
- A pop higher at the open, luring in buyers 🏹
- A sharp drop shortly after, trapping the late bulls 🕳
- A repeat of the last two weeks' bearish close 📉
🔑 Key Takeaway: The setup is there. Now we wait for the trigger.
Fun Fact:
📢 Did you know? The Super Bowl Indicator suggests that if an AFC team wins, markets go bearish, but if an NFC team wins, markets go bullish.
💡 The Lesson? As ridiculous as it sounds, market psychology is a wild beast. While we don’t trade superstition, it’s always fun to see how random events get tied to stock performance.

Long term support on S&P 500Some support and resistance lines on the S&P 500. Important to keep in mind the long term support line from the 2020 bottom.

SPX to find sellers at market price?SPX500USD - 24h expiry
Price action looks to be forming a top.
A Doji style candle has been posted from the high.
This is negative for short term sentiment and we look to set shorts at good risk/reward levels for a further correction lower.
Further downside is expected although we prefer to sell into rallies close to the 6058 level.
Although the anticipated move lower is corrective, it does offer ample risk/reward today.
We look to Sell at 6058 (stop at 6099)
Our profit targets will be 5942 and 5920
Resistance: 6102 / 6190 / 6235
Support: 6030 / 5980 / 5940
Risk Disclaimer
The trade ideas beyond this page are for informational purposes only and do not constitute investment advice or a solicitation to trade. This information is provided by Signal Centre, a third-party unaffiliated with OANDA, and is intended for general circulation only. OANDA does not guarantee the accuracy of this information and assumes no responsibilities for the information provided by the third party. The information does not take into account the specific investment objectives, financial situation, or particular needs of any particular person. You should take into account your specific investment objectives, financial situation, and particular needs before making a commitment to trade, including seeking advice from an independent financial adviser regarding the suitability of the investment, under a separate engagement, as you deem fit.
You accept that you assume all risks in independently viewing the contents and selecting a chosen strategy.
Where the research is distributed in Singapore to a person who is not an Accredited Investor, Expert Investor or an Institutional Investor, Oanda Asia Pacific Pte Ltd (“OAP“) accepts legal responsibility for the contents of the report to such persons only to the extent required by law. Singapore customers should contact OAP at 6579 8289 for matters arising from, or in connection with, the information/research distributed.

SPX500 to find a top?US500 - 24h expiry
Price action continues to trade around the all-time highs.
Previous resistance located at 6102.
A 5 wave bullish count has been completed at 6107.
There is scope for mild buying at the open but gains should be limited.
Further downside is expected and we prefer to set shorts in early trade.
We look to Sell at 6102 (stop at 6147)
Our profit targets will be 6003 and 5955
Resistance: 6102 / 6107 / 6179
Support: 6003 / 5955 / 5886
Risk Disclaimer
The trade ideas beyond this page are for informational purposes only and do not constitute investment advice or a solicitation to trade. This information is provided by Signal Centre, a third-party unaffiliated with OANDA, and is intended for general circulation only. OANDA does not guarantee the accuracy of this information and assumes no responsibilities for the information provided by the third party. The information does not take into account the specific investment objectives, financial situation, or particular needs of any particular person. You should take into account your specific investment objectives, financial situation, and particular needs before making a commitment to trade, including seeking advice from an independent financial adviser regarding the suitability of the investment, under a separate engagement, as you deem fit.
You accept that you assume all risks in independently viewing the contents and selecting a chosen strategy.
Where the research is distributed in Singapore to a person who is not an Accredited Investor, Expert Investor or an Institutional Investor, Oanda Asia Pacific Pte Ltd (“OAP“) accepts legal responsibility for the contents of the report to such persons only to the extent required by law. Singapore customers should contact OAP at 6579 8289 for matters arising from, or in connection with, the information/research distributed.

SPY bearish pitchfork setupSPY reached the middle (red) of the pitchfork line which may act as a resistance line. There is also a chance that it will break through and go to the next line up but I find it more likely that it will go down over the coming weeks.

US500/SPX500 "Standard & Poor" Indices Market Bullish Heist Plan🌟Hi! Hola! Ola! Bonjour! Hallo!🌟
Dear Money Makers & Robbers, 🤑 💰
Based on 🔥Thief Trading style technical and fundamental analysis🔥, here is our master plan to heist the "US500 / SPX500" Indices market. Please adhere to the strategy I've outlined in the chart, which emphasizes long entry. Our aim is the high-risk Red Zone. Risky level, overbought market, consolidation, trend reversal, trap at the level where traders and bearish robbers are stronger. Be wealthy and safe trade.💪🏆🎉
Entry 📈 : You can enter a Bull trade after the breakout of MA level 5960 (OR) Entry in Pullback 5820
Stop Loss 🛑: Using the 2H period, the recent / nearest low or high level.
Goal 🎯: 6000.00 (or) escape Before the Target
Scalpers, take note 👀 : only scalp on the Long side. If you have a lot of money, you can go straight away; if not, you can join swing traders and carry out the robbery plan. Use trailing SL to safeguard your money 💰.
Warning⚠️ : Our heist strategy is incompatible with Fundamental Analysis news 📰 🗞️. We'll wreck our plan by smashing the Stop Loss 🚫🚏. Avoid entering the market right after the news release.
Fundamental Outlook 📰🗞️
Expected Trend: The US500/S&P500 index is expected to move in a bullish trend.
Drivers of the Trend: The bullish trend is driven by:
Strong US economic growth
Low interest rates
A potential rebound in corporate earnings
Current Price: The current price of the S&P 500 is around 5802.
Client Sentiment: 51% of client accounts are holding long positions on this market.
Top Risers: Some of the top risers in the US500 index include stocks with percentage changes of:
27.55%
5.8%
32.96%
Top Fallers: Some of the top fallers in the US500 index include stocks with percentage changes of:
-26.21%
-17.09%
-49.06%
Dow Jones Index: The Dow Jones index has been holding support, despite rising yields putting pressure on global indices.
Earnings Growth: The S&P 500 is expected to report its strongest earnings growth since Q4 2021, with an 11.9% increase.
Market Sentiment:
Bullish Sentiment: 60% of traders and investors are bullish on the US500/S&P500, expecting the market to continue its upward trend.
Bearish Sentiment: 30% of traders and investors are bearish on the US500/S&P500, expecting the market to pull back or reverse its trend.
Neutral Sentiment: 10% of traders and investors are neutral on the US500/S&P500, waiting for more information or confirmation before making a trade.
Please note that this is a general analysis and not personalized investment advice. It's essential to consider your own risk tolerance and market analysis before making any investment decisions.
Take advantage of the target and get away 🎯 Swing Traders Please reserve the half amount of money and watch for the next dynamic level or order block breakout. Once it is resolved, we can go on to the next new target in our heist plan.
Keep in mind that these factors can change rapidly, and it's essential to stay up-to-date with market developments and adjust your analysis accordingly.
💖Supporting our robbery plan will enable us to effortlessly make and steal money 💰💵 Tell your friends, Colleagues and family to follow, like, and share. Boost the strength of our robbery team. Every day in this market make money with ease by using the Thief Trading Style.🏆💪🤝❤️🎉🚀
I'll see you soon with another heist plan, so stay tuned 🫂

SPX500 Will Keep Falling!HI,Traders !
SPX500 broke the key
Horizontal level of 5825.23
While trading in a downtrend
So we are bearish biased and
We will be expecting a further
Bearish move down !
Comment and subscribe to help us grow!

Stock market correction in 2025??I personally believe we'll see a stock market correction in 2025.
1. 30yr treasury yield going higher while FED cut interest rates. Similar situation in 1970s and 1980s where we say a 50% correction in just 2 years in the 1970s (can't remember exact dates)
2. US 10yr/3m yield curve has turned positive. Last times it's done this has been 2000, 2008 and 2020. I'm guessing you know what happened each of those times.
3. Institutional investors increasing long contracts in the yen. The Japanese Yen is a 'risk-off' investment and investors tend to favour it when they don't have much faith in the stock market.
4. US have a volatile president in Trump. The power also seems to be getting to his head a bit - he disagrees with Fed Chair Powell over interest rates, despite not being as educated in economics. He has a lot of power right now and I don't think he will be able to stop a potential market crash for the first year or 2 of his presidency.
5. Back-to-back 20%+ years from the S&P500, could be due a pullback.
These are some reasons, I have some more but I don't want to be sat here writing all day.
Important to note that if you're a long term investor it's best to just ignore this. "Time in the markets beats timing the markets" as they say.
But if you're a day trader I wouldn't be taking many long positions on stocks this year. Could be better to start looking at opportunities in the currency markets.
Then again - you don't have to trust me. This isn't financial advice, just my opinion.

THE Scariest Trend Line you will ever have to see/consider !!!This upper line of resistance is where its all breakdown or break out !!!
